


- Meta's Q2 2024 Revenue: Meta achieved $39.1 billion in revenue, a 22% increase YoY, with robust financials.
- Operational Highlights: The Family of Apps generated $38.7 billion in revenue, while Reality Labs saw a 28% rise.
- Stock Performance: META stock rose 3.49% this quarter, underperforming relative to major indices.
- AI and VR Investments: Meta's advancements in AI and Reality Labs position it for future growth.
- Price Targets: Technicals project Meta stock could range between $375 and $640 by year-end.
I. Meta Q2 2024 Performance Analysis
A. Key Segments Performance
Financial Highlights
Meta reported robust financial performance in Q2 2024, with total revenue of $39.1 billion, marking a 22% year-over-year increase. Net income rose to $13.5 billion, reflecting significant profitability. Earnings per share (EPS) stood at $5.16, showcasing strong earnings growth. Operating income reached $14.8 billion, achieving a 38% operating margin. Total expenses increased by 7% to $24.2 billion, driven by higher infrastructure and Reality Labs inventory costs. The balance sheet remained solid with $58.1 billion in cash and marketable securities, while free cash flow was $10.9 billion, highlighting strong cash generation.
Operational Performance
Meta's operational performance was marked by diverse product sales and innovations. The Family of Apps segment, including Facebook, Instagram, and WhatsApp, generated $38.7 billion in revenue, a 22% increase. Reality Labs saw revenue grow by 28% to $353 million, driven by Quest headset sales. Market share analysis showed strong user engagement, with over 3.2 billion daily active users across Meta's apps. Significant advancements included the rollout of a unified video recommendation service and the launch of AI-driven innovations like Meta AI and AI Studio, fostering deeper user engagement and interaction.
Technological Advancements
AI was a significant focus for Meta. Advances in AI improved content recommendations on Facebook and Instagram, driving user engagement. The full-screen video player and unified video recommendation service enhanced user experience by integrating Reels and other video formats. Meta's AI innovations also impacted advertising. The Meta Lattice ad ranking system improved ad performance, and AI-driven tools like Advantage+ Shopping campaigns provided advertisers with enhanced return on ad spend. AI-generated creative content further streamlined advertising processes. Meta's investment in AI extended to its metaverse initiatives. The release of Llama 3.1, an open-source AI model, positioned Meta at the forefront of AI development. AI-powered products like Meta AI and AI Studio facilitated new user experiences and business opportunities, supporting Meta's long-term vision for AI and the metaverse.
B. META Stock Price Performance
Meta stock (NASDAQ: META) experienced a 3.49% price return this quarter, with its stock opening at $487.20 and closing at $504.22. The quarterly trading range was $414.50 to $531.49, indicating significant volatility. Despite a positive return, Meta's performance lagged behind major indices; the S&P 500 gained 3.85%, while the NASDAQ surged 7.67%. The market capitalization stands at $1.279 trillion, underscoring its substantial market presence. The underperformance relative to the NASDAQ suggests that Meta's stock was less favorable compared to the broader technology sector.
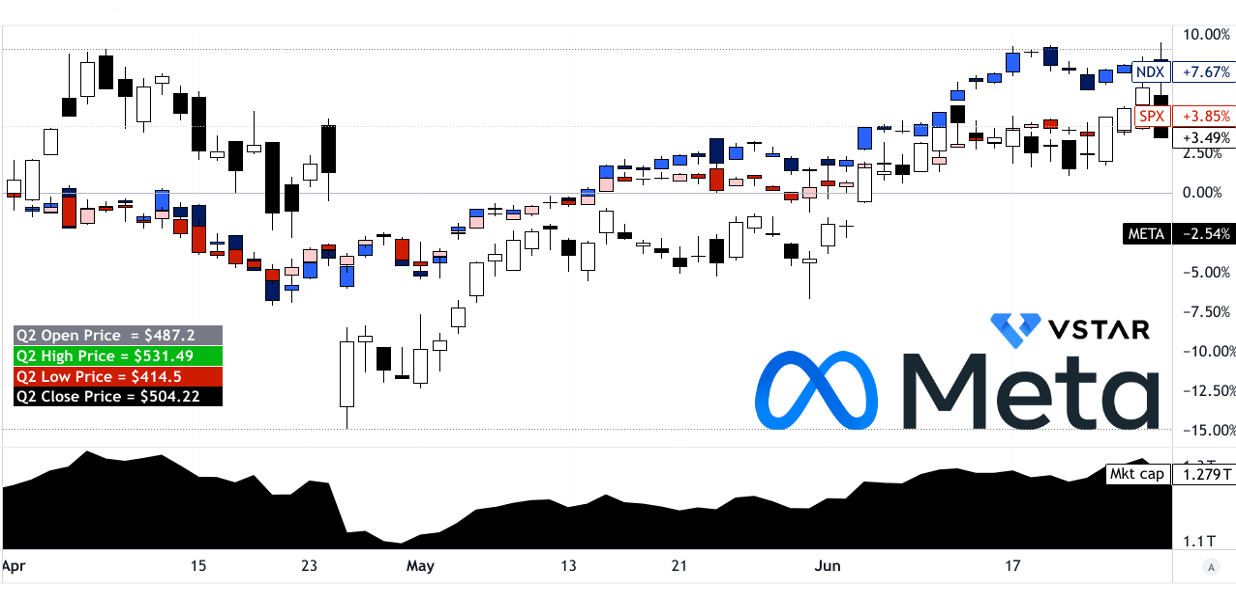
Source: tradingview.com
II. Meta Stock Price Prediction: Outlook & Growth Opportunities
Meta (NASDAQ: META) Looking forward, Meta anticipates third-quarter revenue between $38.5 billion to $41 billion, reflecting continued momentum in user growth and advertising effectiveness. The ongoing investments in AI, AR/VR, and strategic expansions position Meta for sustained growth and market leadership in the digital ecosystem.
A. Segments with Growth Potential
Family of Apps: Meta's Family of Apps continues to be a cornerstone of its revenue growth, with over 3.2 billion daily users globally. The strong growth in user engagement, particularly in the US and globally, underscores the potential for continued expansion. WhatsApp and Threads are standout performers, with significant user bases that contribute to Meta's overall ecosystem strength.
Generative AI: AI technologies are pivotal for Meta's future growth. The deployment of AI across its platforms enhances user experience through improved content recommendations and personalized advertising. This technology not only drives engagement but also boosts monetization efficiency, as evidenced by ongoing improvements in ad performance and relevance. The market (Generative AI) may hit $36 billion in 2024 with an annual growth rate (2024-2030) of 46.47%. Meta's topline will surely benefit from this trend.
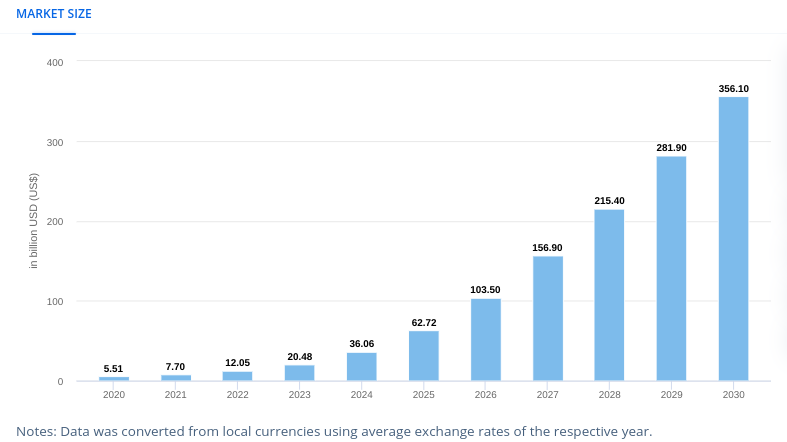
[Gen AI market size]
Source: statista.com
Reality Labs: Meta's investment in Reality Labs, highlighted by the success of Quest 3 and Ray-Ban Meta Glasses, underscores its commitment to augmented reality (AR) and virtual reality (VR) technologies. These products are not only popular among consumers but also represent a strategic push into new, immersive computing platforms.
B. Expansions and Strategic Initiatives
Mergers and Acquisitions: Meta's strategic acquisitions, such as those enhancing AI capabilities or expanding its product portfolio (like Oculus), are pivotal. These acquisitions bolster its technological edge and market position, driving long-term growth prospects.
Research and Development (R&D): Continued R&D investments are crucial for Meta's innovation pipeline. Advances in AI, particularly with the development of Llama 3.1 and future models, underscore its leadership in open-source AI technologies. These investments are critical for maintaining competitive advantage and driving future revenue streams.
Partnerships and Collaborations: Collaborations with industry leaders, such as EssilorLuxottica for Meta Glasses, amplify Meta's reach and innovation capacity. Strategic partnerships enable Meta to leverage expertise and resources beyond its core competencies, accelerating product development and market penetration.
III. META Stock Forecast 2024
META Stock Prediction 2024: Technical Analysis
Meta Platforms' (NASDAQ: META) stock price stands at $474.83. The technical indicators suggest mixed signals. The trendline, calculated using a modified exponential moving average (EMA), is at $480.17. The baseline EMA is slightly lower at $476.96. These figures indicate a marginal upward trend, as the current price is close to these moving averages.
Price Targets and Basis
- Average META Price Target: Technicals project an average Meta target price of $525.00 by the end of 2024. This target is based on the momentum of change-in-polarity observed over mid- to short-term periods, analyzed in conjunction with Fibonacci retracement and extension levels. The average target reflects a moderate expectation of price appreciation considering historical price patterns and current market conditions.
- Optimistic Meta Stock Price Target: The optimistic forecast is $640.00. This projection assumes continued upward price momentum from the current swing and aligns with Fibonacci levels. It reflects a scenario where the stock maintains strong bullish behavior, potentially driven by positive market developments or company-specific catalysts.
- Pessimistic Meta Price Target: Conversely, the pessimistic target is $375.00. This scenario assumes a downturn in momentum based on current price swings and Fibonacci projections. Such a decline might result from adverse market conditions or negative company news.
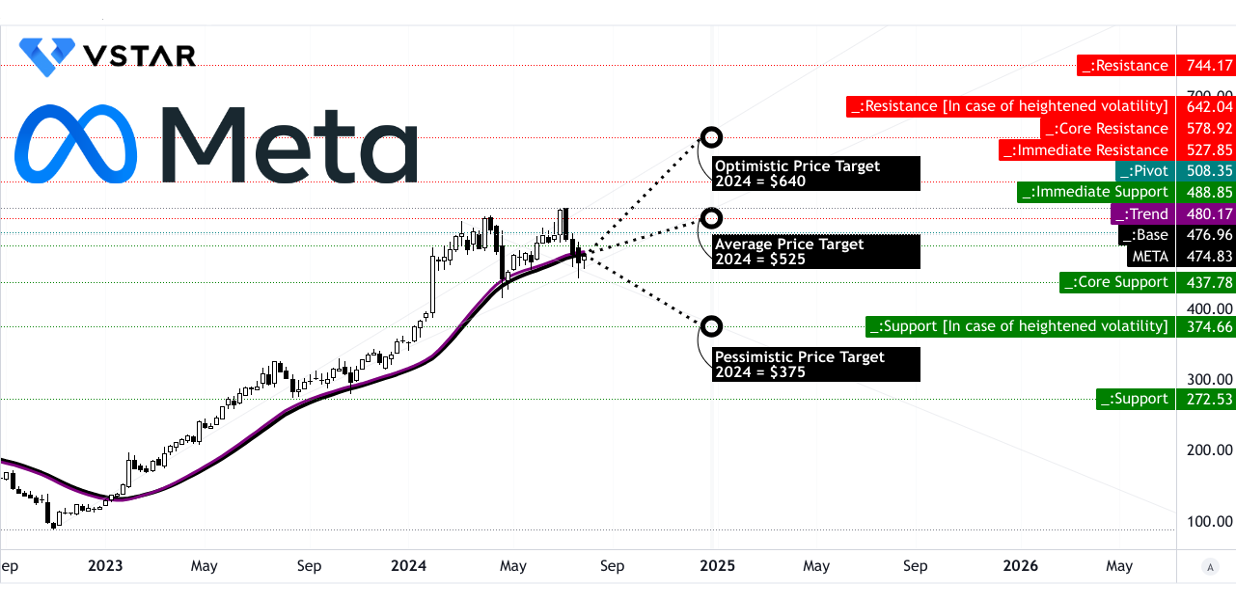
Source: tradingview.com
Key Technical Resistance and Support Levels
- Primary Resistance: The immediate resistance level is at $527.85. This is a crucial level where selling pressure could emerge, potentially halting further price increases.
- Pivot Level: The price channel's pivot is at $508.35, marking a midpoint where the price may oscillate before a breakout or breakdown.
- Resistance in High Volatility: During heightened volatility, resistance could extend to $642.04. This level reflects significant market turbulence, where price movements could be more pronounced.
- Core Resistance: A core resistance level is set at $578.92, above which the stock might face substantial resistance.
- Support Levels: The core support level is at $437.78. In the case of increased volatility, support could drop to $374.66. These support levels are crucial for identifying potential downside risks and price stabilization points.
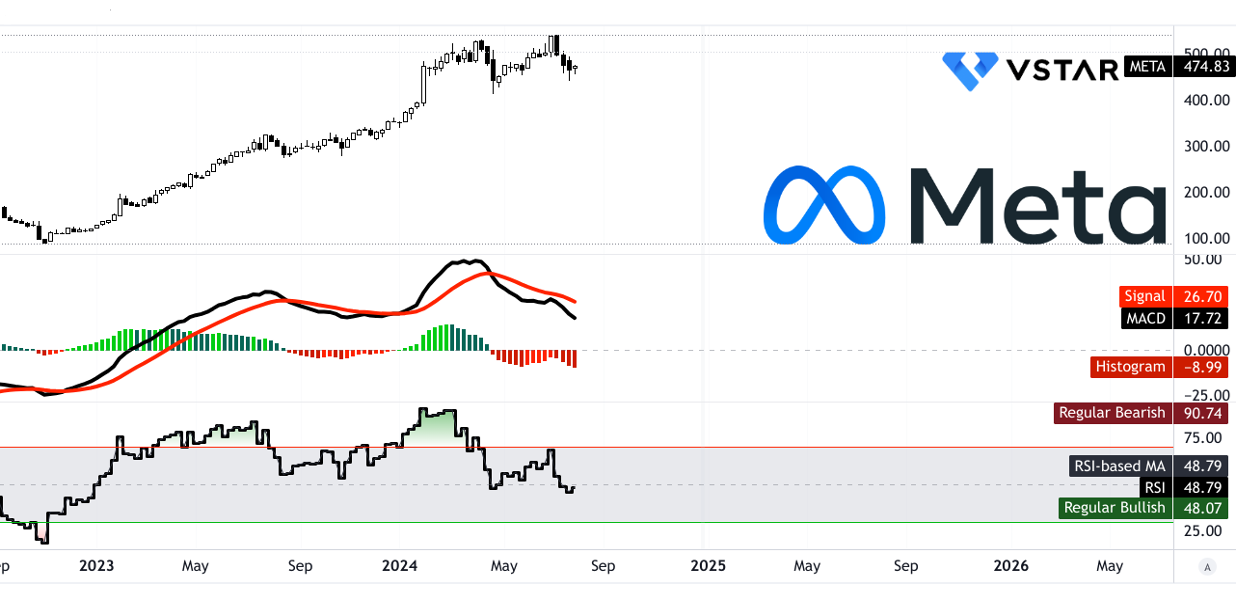
Relative Strength Index (RSI)
The RSI stands at 48.79, close to the neutral level of 50. The regular bullish level is at 48.07, indicating that META is slightly above this threshold, suggesting a potential for upward momentum. There is a bullish divergence noted, but no bearish divergence, implying that while momentum is weak, it is not yet showing signs of a severe downturn.
Moving Average Convergence/Divergence (MACD)
The MACD indicators show a bearish trend with the MACD line at 17.72, the Signal line at 26.70, and the MACD histogram at -8.99. The histogram's negative value and the increasing strength of the bearish trend signal a potential continuation of the current downtrend, suggesting caution for short-term investors.
Source: tradingview.com
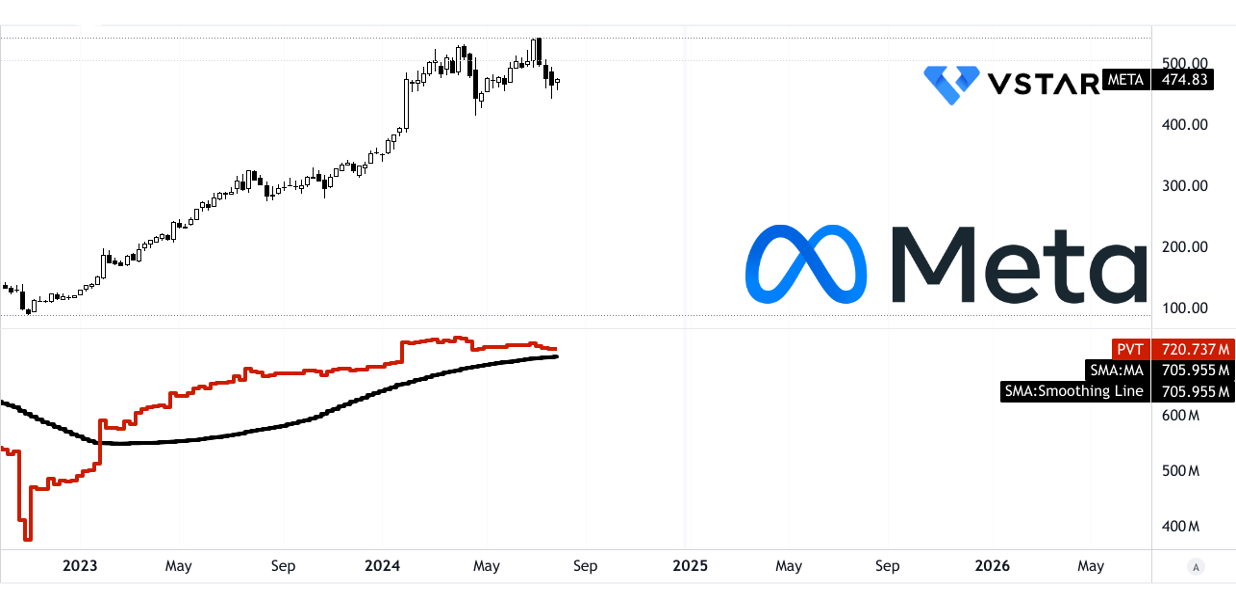
Price Volume Trend (PVT)
The PVT line is at $720.74 million, above the moving average of $705.96 million. This indicates a prevailing bullish volume momentum, supporting the possibility of upward price movement. The volume momentum is positive, suggesting that buying interest might drive the stock higher.
Source: tradingview.com
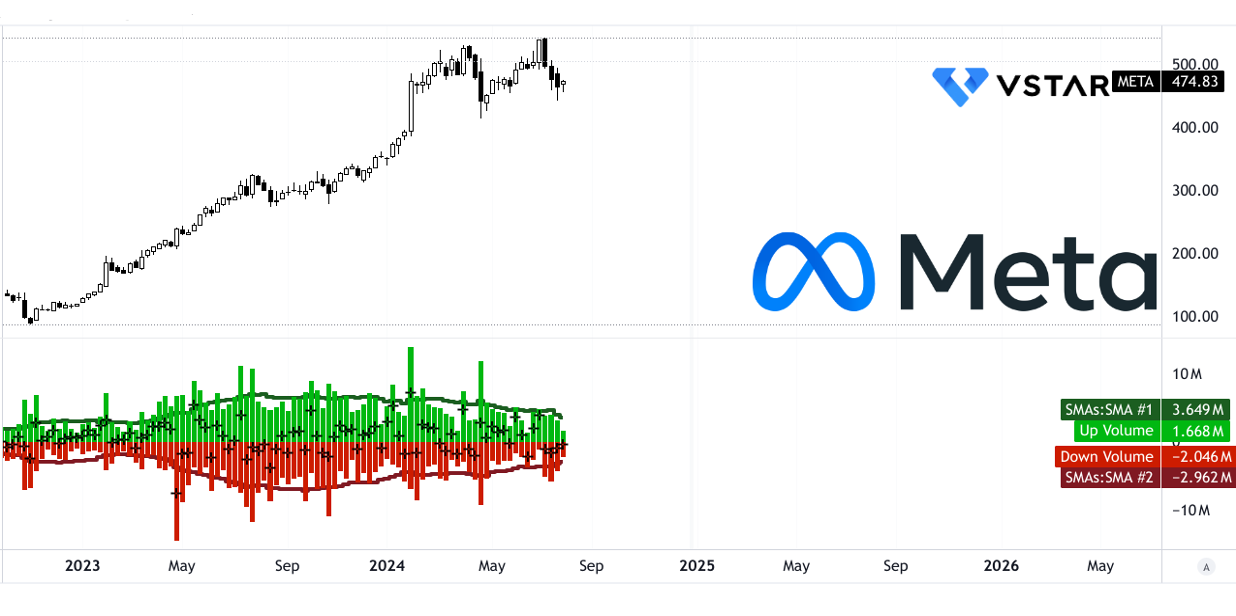
Volume Analysis
- Up Volume Average: $3.65 million
- Down Volume Average: -$2.96 million
- Volume Delta Average: $0.69 million
These figures show a bullish volume momentum, as up volume outweighs down volume, indicating strong buying pressure.
Source: tradingview.com
B. Meta Price Prediction: Fundamental Analysis
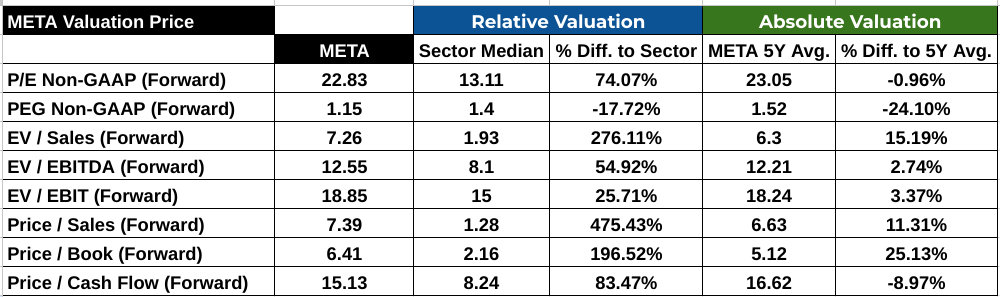
Financial Ratios:
P/E Ratio (Forward): Meta Platforms (NASDAQ: META) has a forward P/E ratio of 22.83, significantly higher than the sector median of 13.11, indicating a 74.07% premium. Compared to its five-year average of 23.05, the current P/E is almost on par, showing stability in its valuation approach relative to historical performance.
PEG Ratio (Forward): The forward PEG ratio for META stands at 1.15, which is lower than the sector median of 1.4 by 17.72%, and also lower than its five-year average of 1.52 by 24.10%. This suggests that META is potentially undervalued when considering its growth prospects relative to its earnings.
Price/Cash Flow (Forward): META's forward Price/Cash Flow ratio is 15.13, which is 83.47% higher than the sector median of 8.24. However, it is 8.97% below its five-year average of 16.62, suggesting a slight undervaluation in terms of cash flow.
Source: Analyst's compilation
C. META Forecast: Market Sentiment
Analyst Ratings and Price Targets:
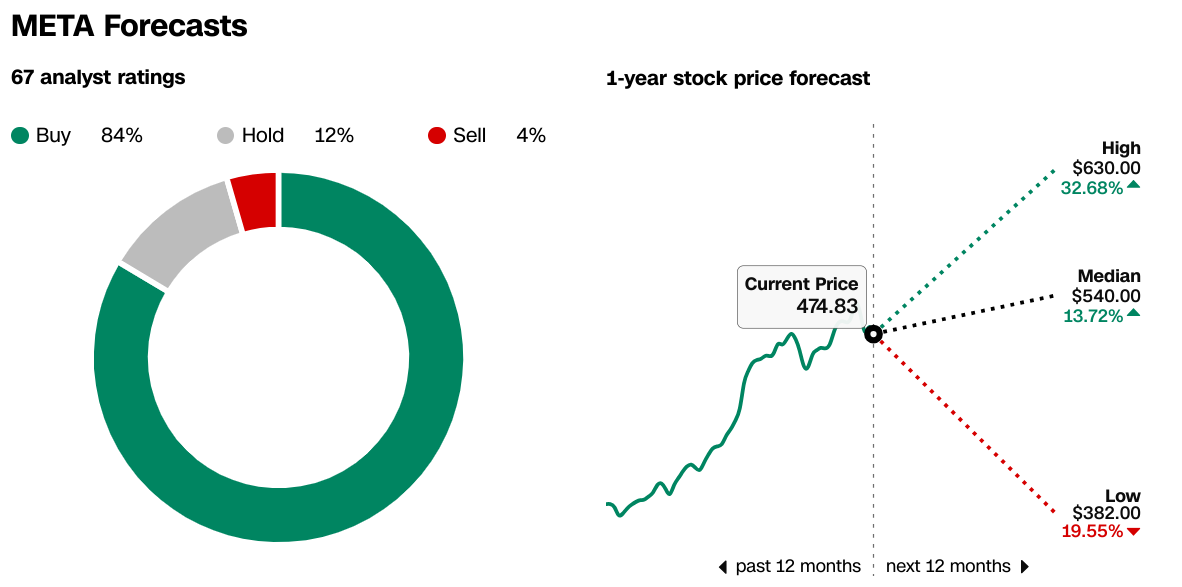
According to CNN.com, 84% of the 67 analysts covering META rate it as a buy, 12% rate it as a hold, and 4% rate it as a sell. The one-year stock price forecast ranges from a high of $630 to a low of $382, with a median target of $540. The current price of $474.83 suggests a potential upside.
Source:CNN.com
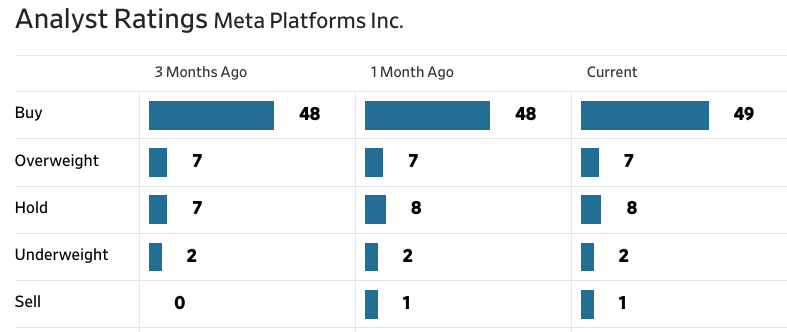
The Wall Street Journal reflects similar sentiment with 49 analysts rating it a buy, 7 as overweight, 8 as hold, 2 as underweight, and 1 as sell. The price targets align with CNN's, indicating strong market confidence.
Source:WSJ.com
Institutional Holdings:
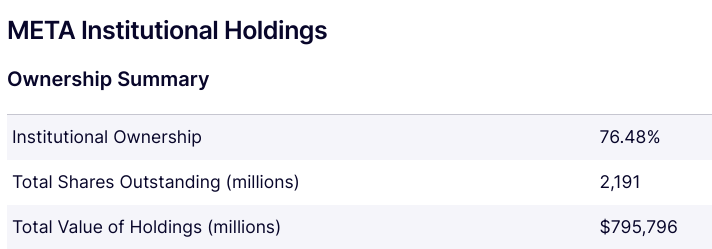
META has substantial institutional support, with institutional ownership at 76.48%. Out of 2,191 million total shares outstanding, institutions hold $795,796 million worth of shares, indicating strong institutional confidence and potentially stable support for the stock.
Source:Nasdaq.com
Short Interest:
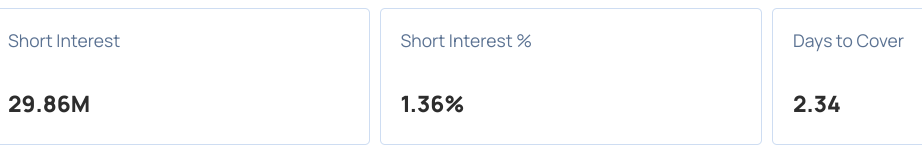
According to Benzinga.com, META has a short interest of 29.86 million shares, representing 1.36% of total shares outstanding and 2.34 days to cover. The relatively low short interest indicates that there is not significant bearish sentiment against META, suggesting a stable market outlook.
Source:Benzinga.com
IV. Meta Stock Forecast: Challenges & Risk Factors
Meta Platforms (NASDAQ: META) faces intense competition from various tech giants across different segments. In the ad market Meta is countering competitors like Google and Amazon. In the social media landscape, TikTok has emerged as a formidable rival, especially among younger users, by offering a unique short-form video experience. Instagram Reels, Meta's response to TikTok, is an attempt to capture this audience, but TikTok's US block support's Instagram's rapid growth. Additionally, Snap Inc. (Snapchat) continues to compete for the younger demographic with innovative features like augmented reality filters and a strong focus on private messaging. In the messaging domain, Meta's WhatsApp and Messenger face competition from services like Apple's iMessage and Telegram. Moreover, Meta's investments in the Metaverse and products like Oculus VR headsets are up against well-established companies like Microsoft (with its HoloLens) and new entrants like Apple's Vision Pro.
Source: quartr.com
Other Risks
Ongoing investigations and legal challenges globally could impact Meta's operations and financial performance. Also, Data privacy issues and evolving regulations, such as the GDPR in Europe, pose constant challenges. Moreover, Managing harmful content and misinformation remains a significant operational and reputational challenge.
Conclusion
Meta Platforms (NASDAQ: META) delivered a strong Q2 2024 performance with solid revenue growth. Despite this, its stock experienced only a 3.49% quarterly gain, underperforming compared to the broader market. Looking forward, analysts predict Meta's stock could reach $525, with potential highs of $640 and lows of $375. Investors should note that Meta faces competition and regulatory risks, but its robust AI and VR investments offer significant growth potential. For trading opportunities, consider CFD trading on platforms like VSTAR, which offers regulated access to Meta stock CFDs with low fees and high liquidity.