


EURUSD
Fundamental Perspective
Money markets are becoming more convinced that the Federal Reserve (Fed) will cut interest rates at a faster pace through 2024. This belief is driven by the fact that inflation is decreasing faster than most models can predict. Investors now anticipate more rate cuts than the Fed itself foresees, with markets predicting over 160 basis points in cuts. Some even believe the rate cut cycle could start as early as March. In contrast, the Fed's own projection, as indicated in its dot plot, only anticipates a reduction of 75 basis points by the end of 2024.
However, the market's momentum to short the USD was somewhat constrained by positive US Durable Goods Orders data. In November, these orders increased by 5.4%, a significant improvement from October's -5.1% (revised up slightly from -5.4%). This suggests that the US economy may still be strong enough for the Fed to consider fewer rate cuts than what many in the market anticipate.
Technical Perspective
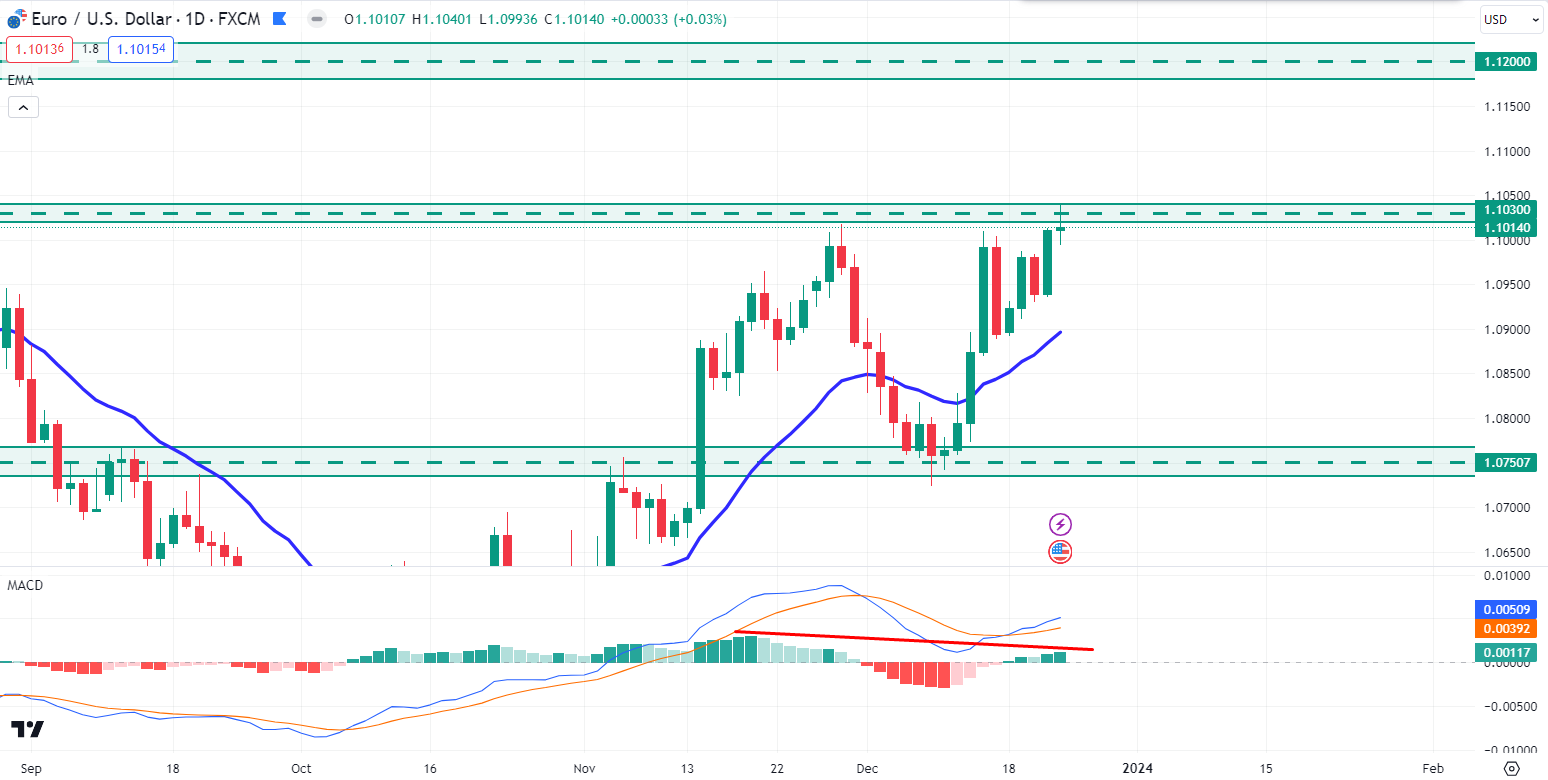
Image: TradingView
In the weekly chart, EURUSD price is still residing below the 1.1030 psychological event area. However, the dynamic level of 20 EMA is holding the price as strong support on the weekly timeframe.
In the daily chart, EURUSD went sideways after rejecting the 1.1030 event area last week Friday. So, if the price can have an impulsive bearish candle close below the 1.1030 low, bears may extend the pressure toward the 1.0750 price area in the days ahead. Moreover, the MACD indicator has created a bearish divergence on the daily chart, which indicates that bears may regain momentum.
On the bullish side, if the price can break above the 1.1030 resistance area with an impulsive daily bullish candle close, an upward pressure could extend toward the 1.1200 price area in the coming days.
GBPJPY
Fundamental Perspective
The GBP/JPY pair dropped when attempting to surpass 181.00 after the UK Office for National Statistics (ONS) reported a contraction in Q3 Gross Domestic Product (GDP). The unexpected downturn in the preliminary estimates has heightened concerns about a possible technical recession in the UK economy.
In the recent Summary of Projections (SOP), the Bank of England (BoE) predicted stagnant growth for the last quarter of 2024. Any unfavorable result could lead to a technical recession. BoE policymakers are grappling with the decision to either support rate cuts to prevent a recession or maintain a restrictive policy stance to bring inflation back to 2%. Meanwhile, better-than-expected Retail Sales data for November gives BoE policymakers a reason to consider keeping interest rates high.
Moreover, in Tokyo, the Bank of Japan's (BoJ) monetary policy minutes revealed a consensus to keep interest rates negative until clear signs of achieving 2% inflation through wage growth emerge. Additionally, the National Consumer Price Index (CPI) data for November, released early on Friday, slowed to 2.8% from the previous reading of 3.3%. Despite this, price pressures in the Japanese economy have remained above 2% for 20 consecutive months.
Technical Perspective
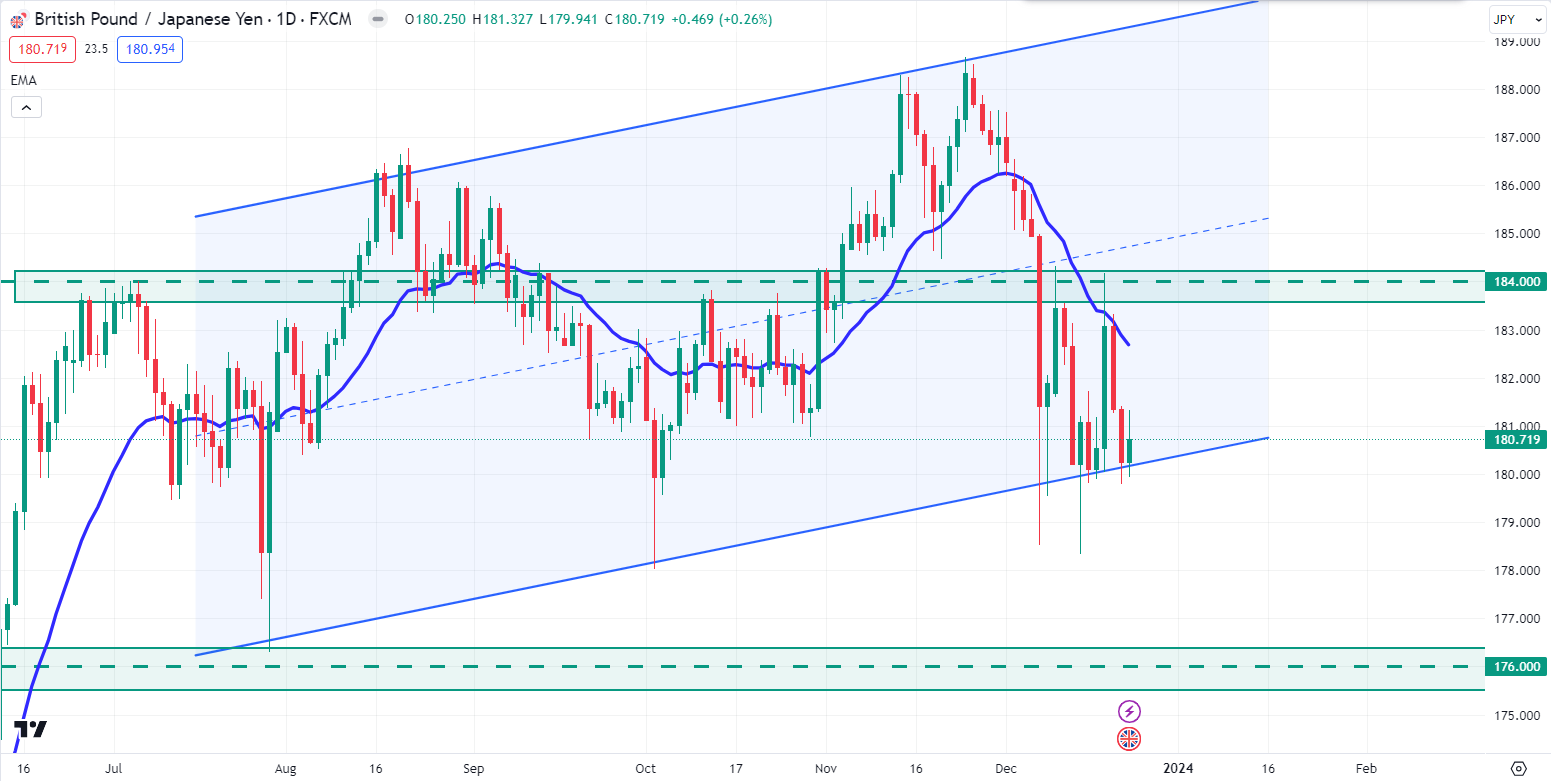
Image: TradingView
Last week, after bouncing from the channel support, GBPJPY bulls pushed the price higher but failed to continue above the 184.00 price area.
In the daily chart, the dynamic level of 20 EMA is still working as a strong resistance. So, if the price can break below the bullish channel’s support with a bearish D1 candle, it might extend the downside pressure toward the 176.00 support area.
On the bullish side, if the price bounces higher and breaks above the 184.00 resistance area with a daily bullish candle close, the price may recover further upward toward the bullish channel’s resistance level.
Nasdaq 100 (NAS100)
Fundamental Perspective
As we approach the week of December 25th to December 29th, 2023, the fundamental outlook for the NASDAQ 100 (NAS100) reflects a blend of positive trends and potential challenges. Recent market dynamics highlight the continued impact of technology and growth stocks, with several NASDAQ-listed companies driving innovation. Investors should monitor key indicators, such as tech sector earnings and regulatory developments, for insights into the index's performance.
However, caution is warranted amid concerns about rising interest rates and their impact on high-growth sectors. Stay attuned to global economic conditions, as external factors can influence NAS100 movements. A balanced and informed approach, considering both opportunities and risks, will be essential for navigating the NASDAQ 100 during the upcoming week, ensuring a well-rounded perspective for investors
Technical Perspective
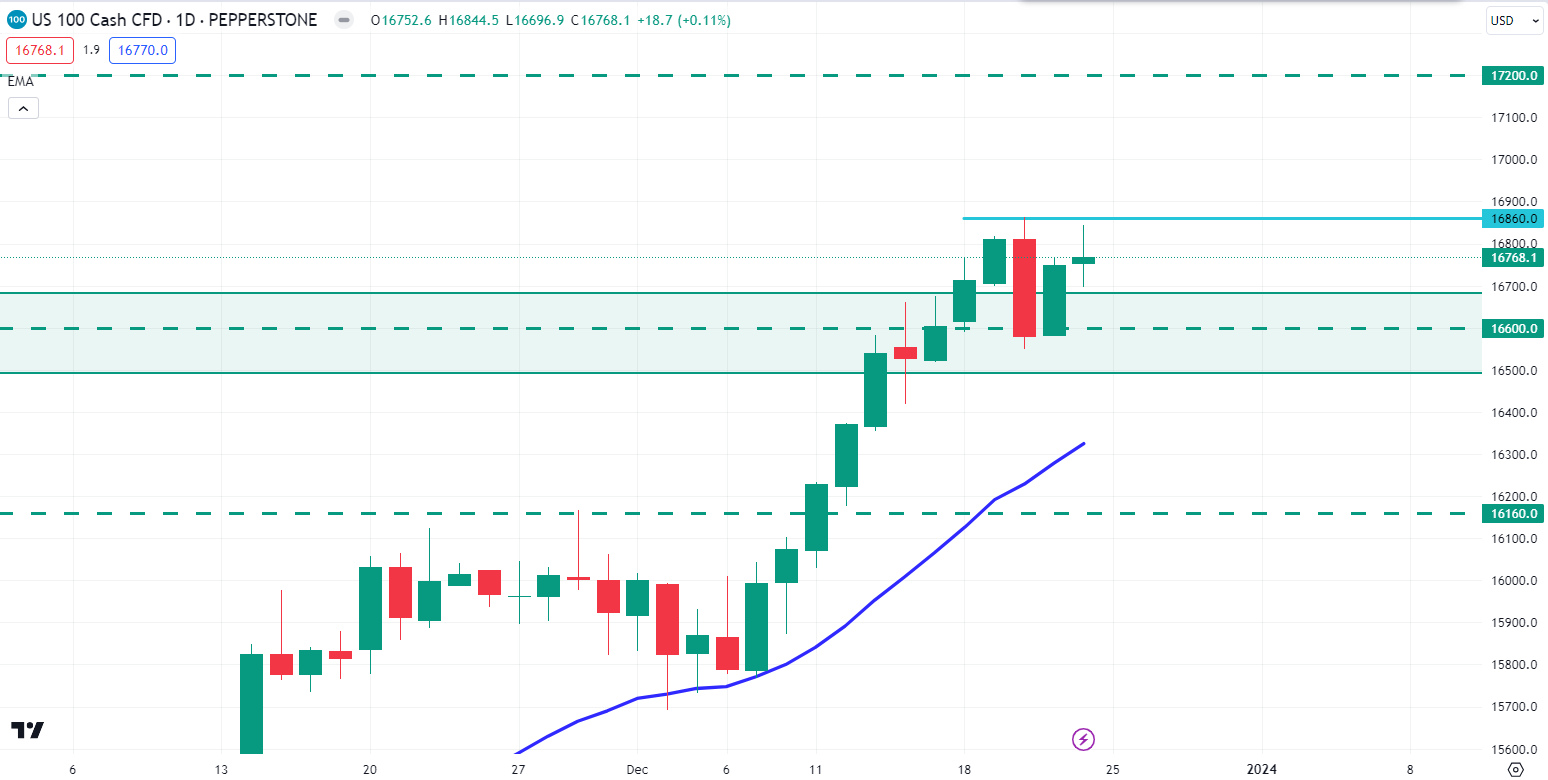
Image: TradingView
In the weekly NAS100 chart, the price broke above the $16600.0 psychological resistance area with a weekly bullish candle close. After bouncing from the $14250.0 price area, bulls have gained almost 2500 pips.
In the daily chart, if the price can break above the $16860.0 neckline area with a daily bullish candle close, NAS100 may recover further upside toward the $17200.0 psychological key area in the coming days.
On the bearish side, a bearish candle below the $16600.0 price area could push the price down to the $16160.0 price area in the days ahead.
S&P500 (SPX500)
Fundamental Perspective
Entering the week of December 25th to December 29th, 2023, the fundamental forecast for the S&P 500 hinges on several key factors. Recent economic data suggests a resilient U.S. economy, with positive indicators such as robust job growth and consumer spending. However, caution is advised as inflation concerns persist, and the Federal Reserve's policy decisions remain in focus. Market participants should closely monitor developments in trade relations and corporate earnings reports, which can significantly impact the index. Geopolitical events and global market sentiment also play crucial roles.
A diversified approach and a keen eye on emerging trends will be essential for navigating potential volatility. As always, staying informed about the ever-changing market landscape will empower investors to make informed decisions during this upcoming week in the S&P 500.
Technical Perspective
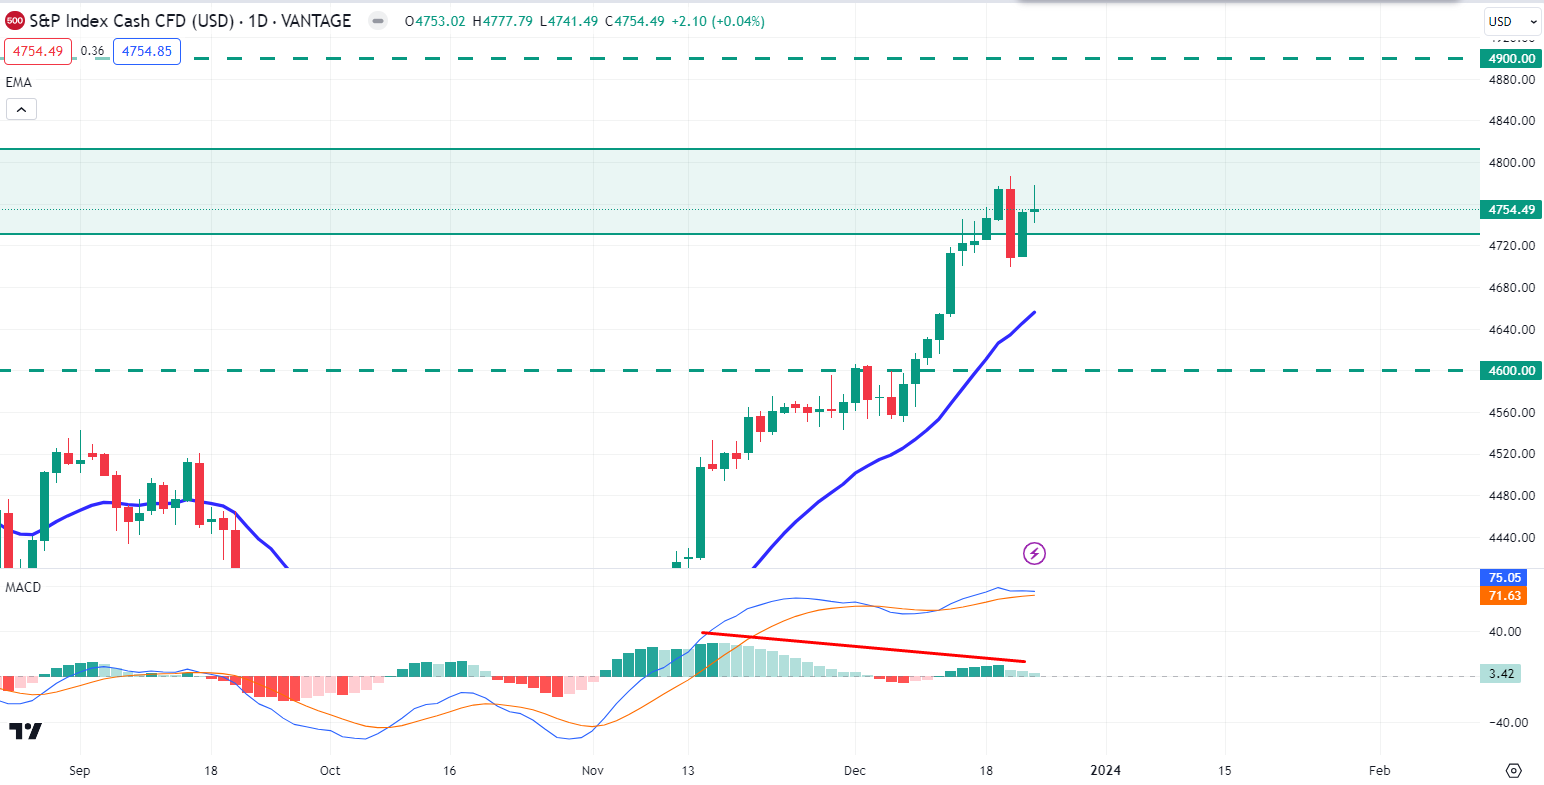
Image: TradingView
In the W1 S&P 500 chart, the price is still residing inside the weekly order block area. However, the price had a weekly rejection candle close inside the order block area.
In the daily chart, the price has created a bearish mother bar candle after rejecting the weekly order block zone. So, if the price can break below the mother bar’s low with a daily bearish candle close, bears extend the momentum toward the $4600.00 price area in the coming days. Also, the MACD indicator formed a bearish divergence, which might work as a confluence bearish factor.
On the bullish side, if the price can have an impulsive bullish candle close after breaking the bearish mother bar’s high, bulls may sustain the bullish bias toward the $4900.00 price area.
Hang Seng Index (HK50)
Fundamental Perspective
Heading into the week of December 25th to December 29th, 2023, the Hang Seng Index (HK50) is subject to various factors shaping its fundamental forecast. Recent market chatter around economic recovery and geopolitical developments will likely influence the index's performance. Keep an eye on key indicators such as trade data, central bank announcements, and global market sentiment as they impact Hong Kong's stock market. Potential shifts in government policies and regulatory environments may also play a role in HK50's movement. Given the interconnected nature of global markets, external events could trigger volatility.
Investors should exercise prudence, diversify portfolios, and stay informed about evolving economic conditions. In summary, a watchful and adaptable approach will be crucial for navigating the upcoming week's dynamics in the Hang Seng Index.
Technical Perspective
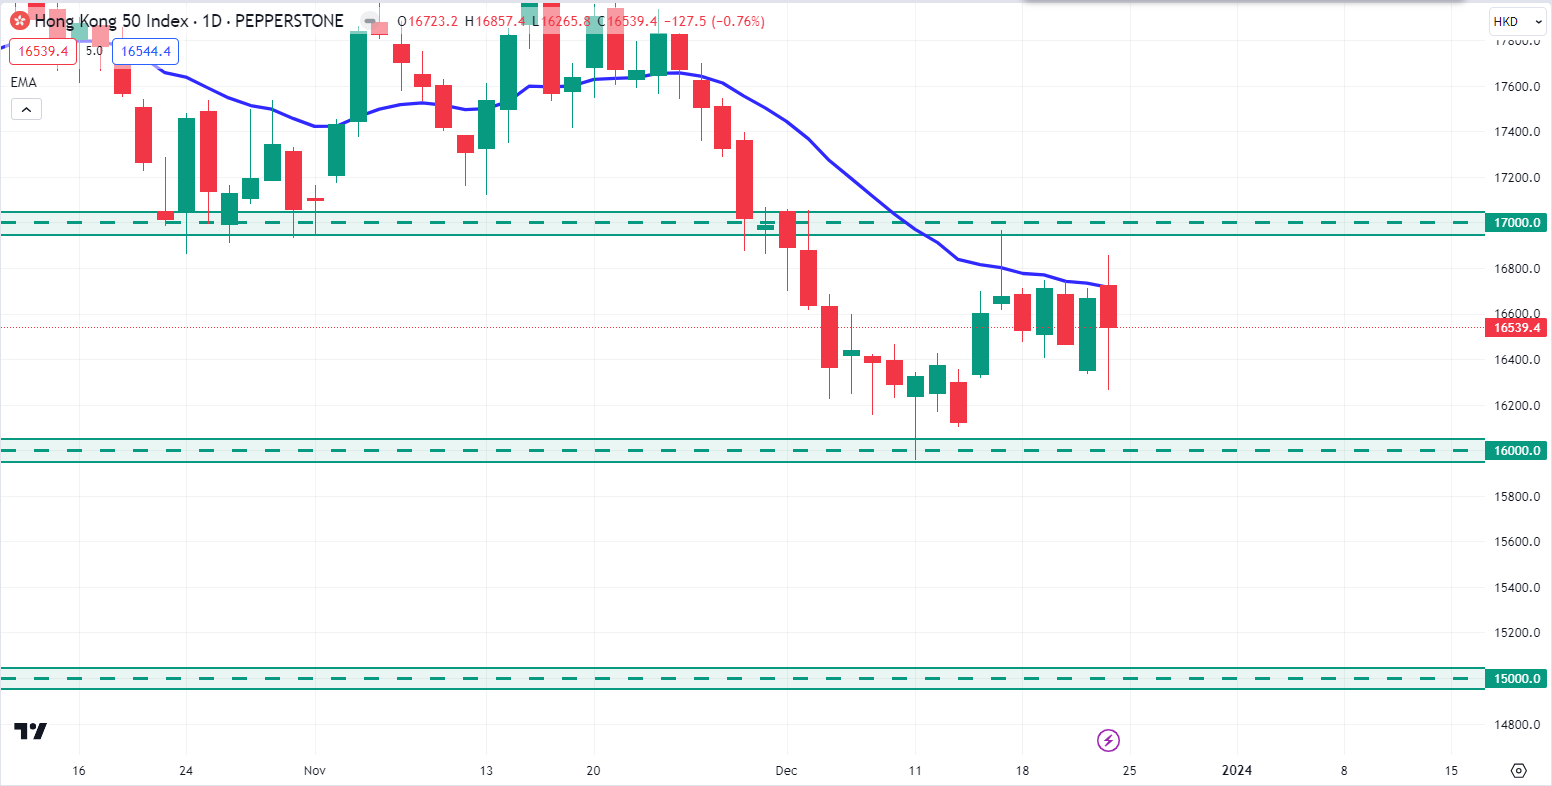
Image: TradingView
In the weekly chart, the HK50 price is currently residing below the $17000.0 level. After bouncing from the $16000.0 support level, the price retraced higher toward the $17000.0 price area.
In the daily chart, the price had a daily bearish candle close after rejecting the 20 EMA last week Friday. So, if the stock pushes downside and breaks below the $16000.0 support level with a daily bearish candle, bears may sustain the bearish pressure toward the $15000.0 key area in the days ahead.
On the bullish side, if the price pushes lower and bounces higher from the $16000.0 price area with a green D1 candle, bulls may regain momentum and push the price higher toward the $17000.0 price area.
Bitcoin (BTCUSD)
Fundamental Perspective
The $43,860 midline in this order block holds the key to BTC's next move, influencing the fate of the Christmas rally. On the other hand, the psychological $48,000 mark is the key level to watch, and the buyer congestion zone at $37,800 in the upcoming days. However, bitcoin (BTC) shows a positive trend as the weekend approaches, bringing the Christmas festivities.
With expectations of lower trading activity during the holiday season and the typical weekend dynamics, the market is poised for potential volatility. Significant moves for the king of crypto could occur around December 25, shaping the year-end landscape.
Technical Perspective
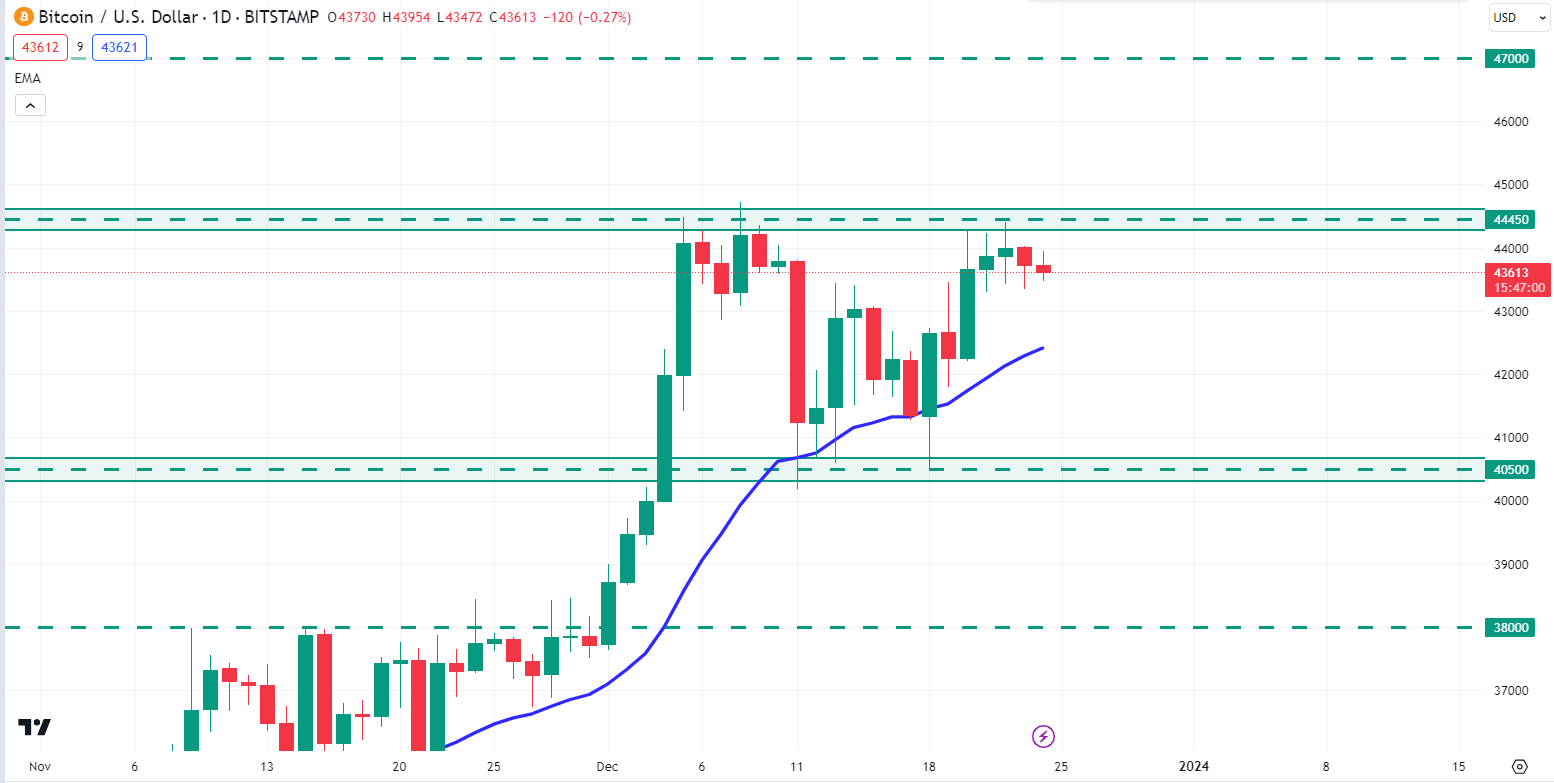
Image: TradingView
In the weekly chart, BTC bulls are still holding the price above the $40000 price area. After breaking above the $40000 price area, BTC retraced down to $40250 and climbed higher again with a weekly bullish candle close.
In the daily chart, BTC price is currently trading inside the range of $40500 - $44450 price area. So, if the price can break above the $44450 resistance area with an impulsive daily bullish candle close, bulls may continue the bullish trend toward the $47000 price area in the coming days.
On the bearish side, the break below the $40500 price area with a daily bearish candle could extend the loss towards the $38000 price area in the days ahead.
Ethereum (ETHUSD)
Fundamental Perspective
The supply of Ethereum available on exchanges increased noticeably from December 21 to Saturday. As the reserves of ETH on exchange wallets rise, more Ether becomes available for selling, potentially intensifying selling pressure on the altcoin. This increased selling pressure could lead to a pullback in the ETH price. According to Santiment's on-chain data, the percentage of Ethereum's total supply on exchanges rose from 8.07% to 8.16%. This surge in ETH tokens on exchange platforms is significant compared to the past three months, as depicted in the chart below. The growing selling pressure may drive down the ETH price.
Besides, data from IntoTheBlock indicates a 62% increase in Ethereum inflow to exchanges (aggregated exchanges) in the past week. The Network Realized Profit/Loss metric shows spikes in profit-taking by ETH traders between October 31 and December 23, suggesting that a substantial amount of profit-taking could result in an ETH price pullback.
Technical Perspective
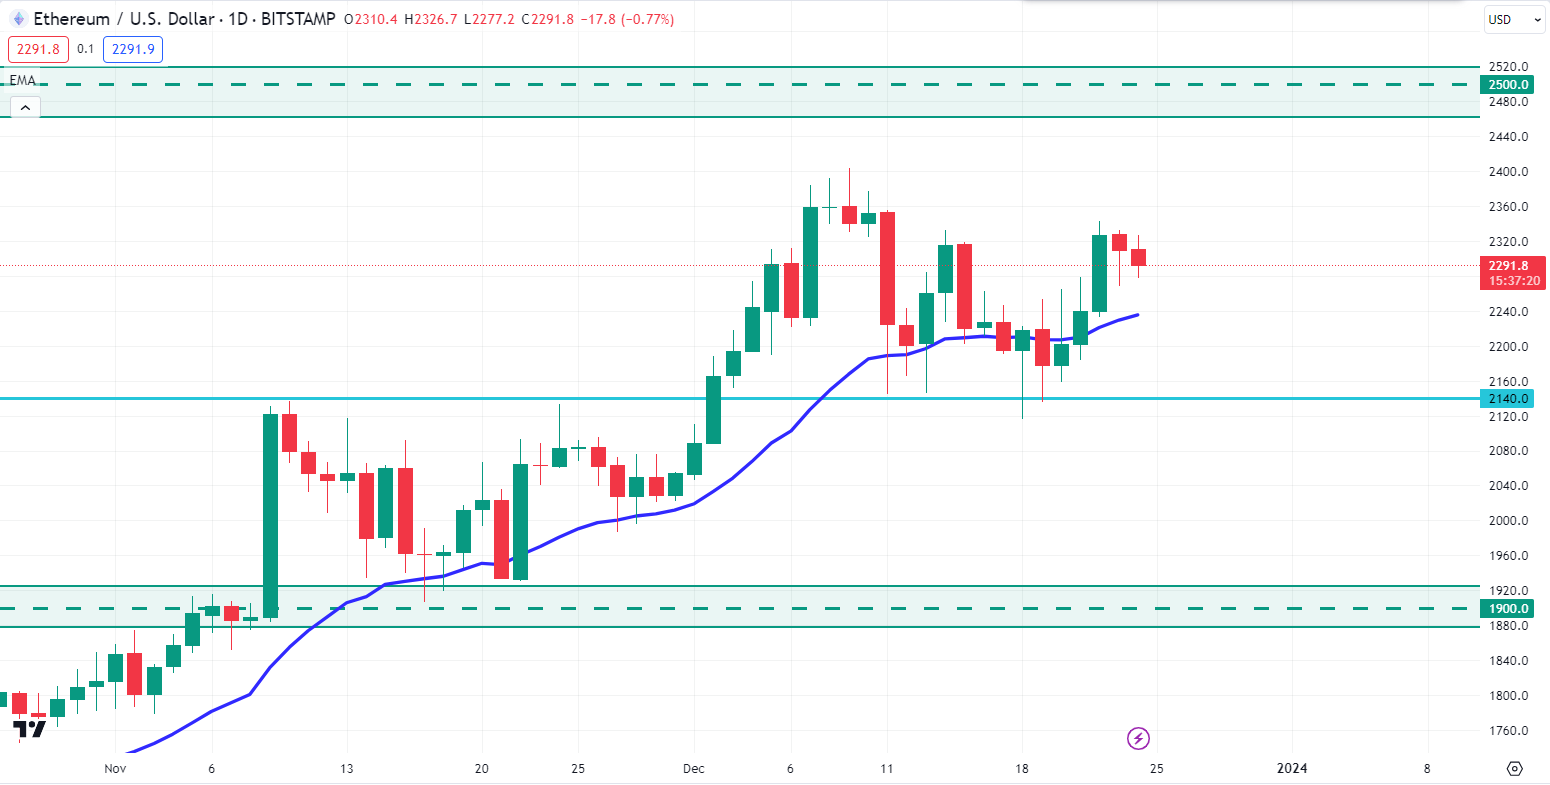
Image: TradingView
In the weekly chart, ETH bulls are still holding bullish momentum over the $2140.0 neckline area.
In the daily chart, the price may retrace the downside toward the dynamic level of 20 EMA. So, if the price retraces down to the 20 EMA and forms a rebound, bulls may sustain the bullish momentum toward the $2500.0 level.
On the bearish side, with a selling pressure below the $2140.0 neckline with a daily bearish candle, bears may regain momentum and push the price down to the $1900.0 price area.
Tesla Stock (TSLA)
Fundamental Perspective
As we approach the week of December 25th to December 29th, 2023, a fundamental forecast for Tesla (TSLA) reveals key drivers influencing the stock. Recent developments indicate continued market enthusiasm for electric vehicles, bolstering Tesla's position. The company's expansion into renewable energy solutions and advancements in autonomous driving technology contribute positively to its outlook. Additionally, regulatory tailwinds and increasing global demand for sustainable transportation amplify TSLA's growth potential. However, potential challenges, such as supply chain disruptions and global economic uncertainties, necessitate cautious monitoring.
Investors should track quarterly earnings reports, delivery figures, and updates on Tesla's Gigafactories for comprehensive insights. Overall, TSLA's performance in the upcoming week is poised to reflect the evolving dynamics of the electric vehicle market and macroeconomic conditions. Stay informed and agile in response to unfolding events to navigate this exciting period for Tesla.
Technical Perspective
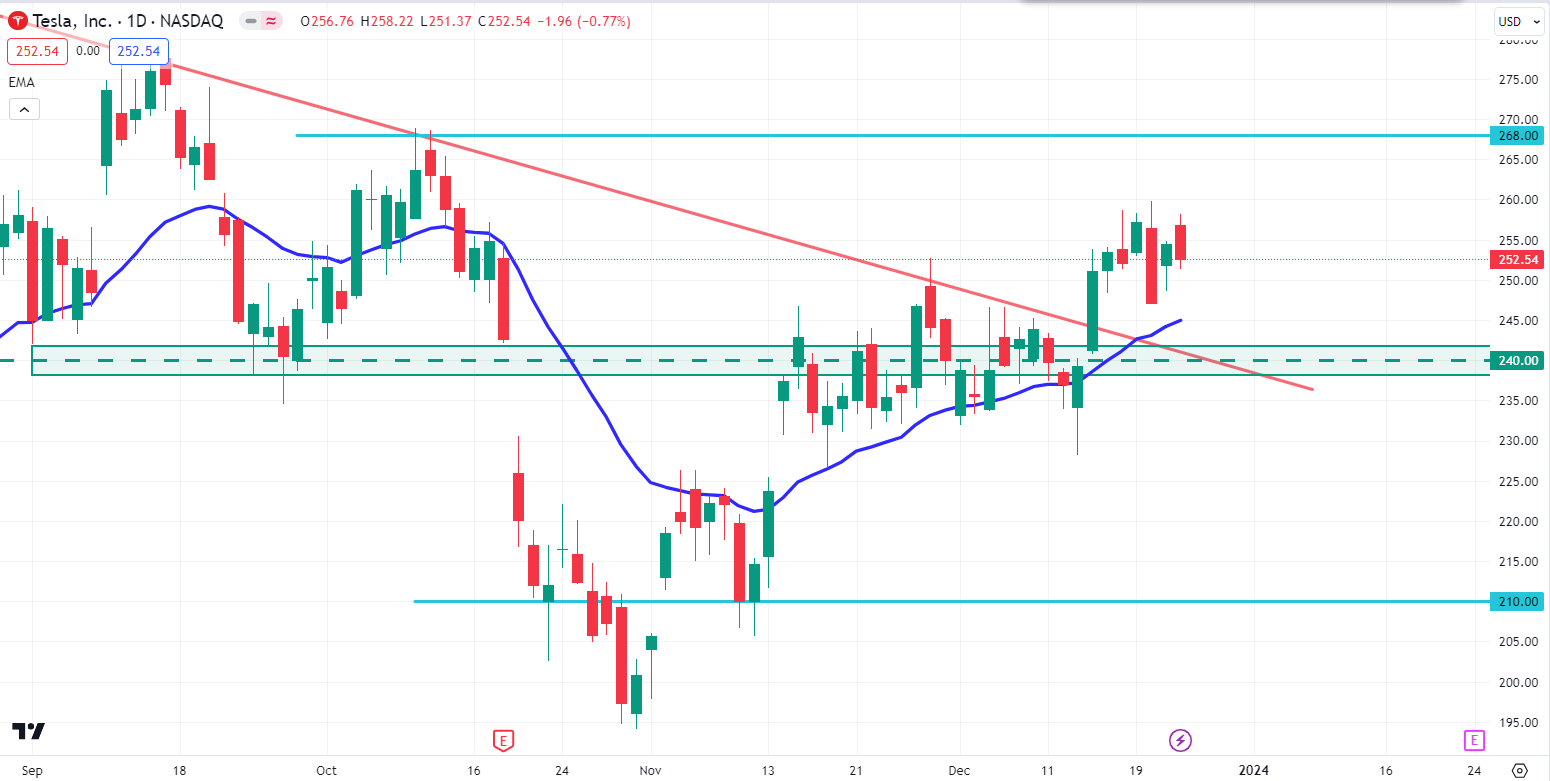
Image: TradingView
In the weekly chart, TSLA stock price has a weekly bearish indecision candle close after breaking above the bearish trend line.
In the daily timeframe, the price may retrace down to the $240.00 price area. So, if the price retraces down to the $240.00 price area and bounces higher with a daily bullish candle close, bulls may sustain the bullish pressure toward the $268.00 price area in the coming days.
On the bearish side, if the price breaks below the $240.00 support area with a daily bearish candle close, bears may push the price down to the $210.00 price area.
GOLD (XAUUSD)
Fundamental Perspective
XAU/USD briefly touched above $2,070 on Friday before retracing towards the day's opening levels. The Federal Reserve's main interest rate is currently at a 22-year high, creating heightened anticipation for potential rate cuts. The market is optimistic about an accelerated pace of Fed rate cuts in 2024, driven by receding US inflation.
In November, the US Annualized Core Personal Consumption Expenditures (PCE) Price Index increased by 3.2% from the previous year, slightly below market expectations of 3.3% and a further decline from the previous period's 3.4% (which was revised down from 3.5%). With US inflation easing, the US Dollar is under downward pressure, and Spot Gold is gaining traction in anticipation of potential Fed rate cuts. However, there's a concern that market expectations may be too aggressive. The Fed's dot plot forecasts 75 basis points in rate cuts by the end of 2024, while the market is pricing in 160 basis points in cumulative cuts, with some anticipating a rate cut as early as March.
Technical Perspective
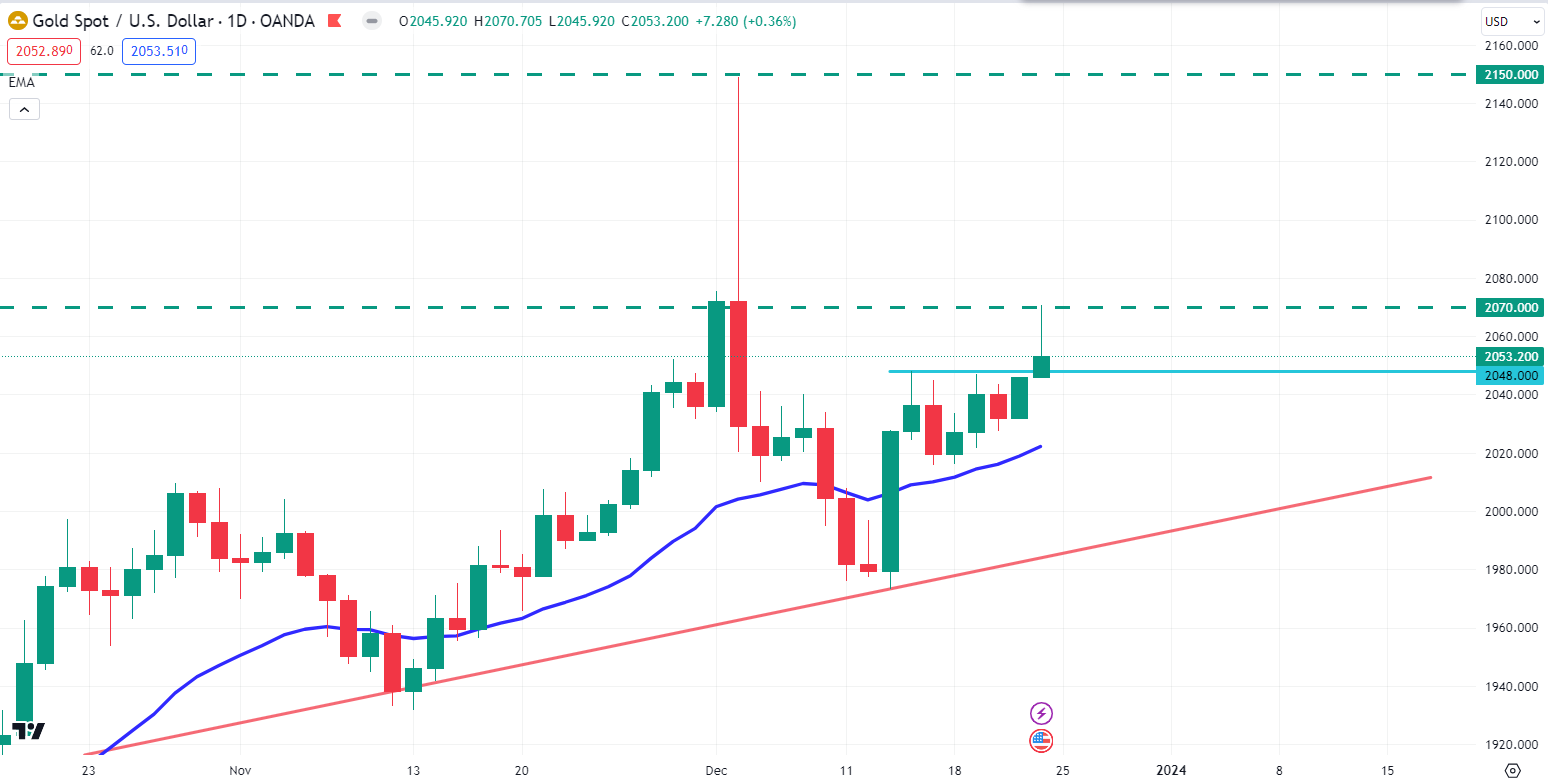
Image: TradingView
In the weekly chart, bulls are still holding the bullish momentum above the $2006.50 weekly neckline area.
In the daily chart, bears rejected the $2070.00 price area last week Friday. So, if the price can have a bearish candle close below the $2048.00 price area, bears may push the price down to the bullish trend line again.
On the bullish side, if the price can break above the $2070.00 resistance area with a daily bullish candle, Gold may recover further higher toward the $2150 key area in the coming days.
WTI Crude Oil (USOUSD)
Fundamental Perspective
WTI Oil rebounds above $74 in a volatile pre-Christmas week. Angola's exit from OPEC in January adds to the energy market dynamics. Meanwhile, the DXY US Dollar Index flirts with a significant breakdown, potentially erasing six months of gains.
Oil prices are trending towards $84 on Friday, driven by geopolitical tensions in the Red Sea. Houthi rebels' declaration of the Red Sea as a no-go zone for major freight operators has redirected fleets around Africa, anticipating increased demand and price pressure for Crude in the coming weeks. Additionally, Angola's decision to leave OPEC on Thursday stems from disagreements over lower Oil quotas.
The US Dollar (USD) is declining as markets bet on early 2024 interest-rate cuts, despite warnings from Federal Reserve (Fed) members cautioning against excessive optimism. The previously strong rate differential between US yields and other countries, a key driver for the USD in 2023, seems to be diminishing, potentially causing disruptions between the Fed and global markets at the beginning of 2024.
Technical Perspective
In the weekly chart, bears are still holding the price below the $75.00 psychological price area. After touching the $75.40 price area, bears pushed the price down and had a weekly rejection candle close below it.
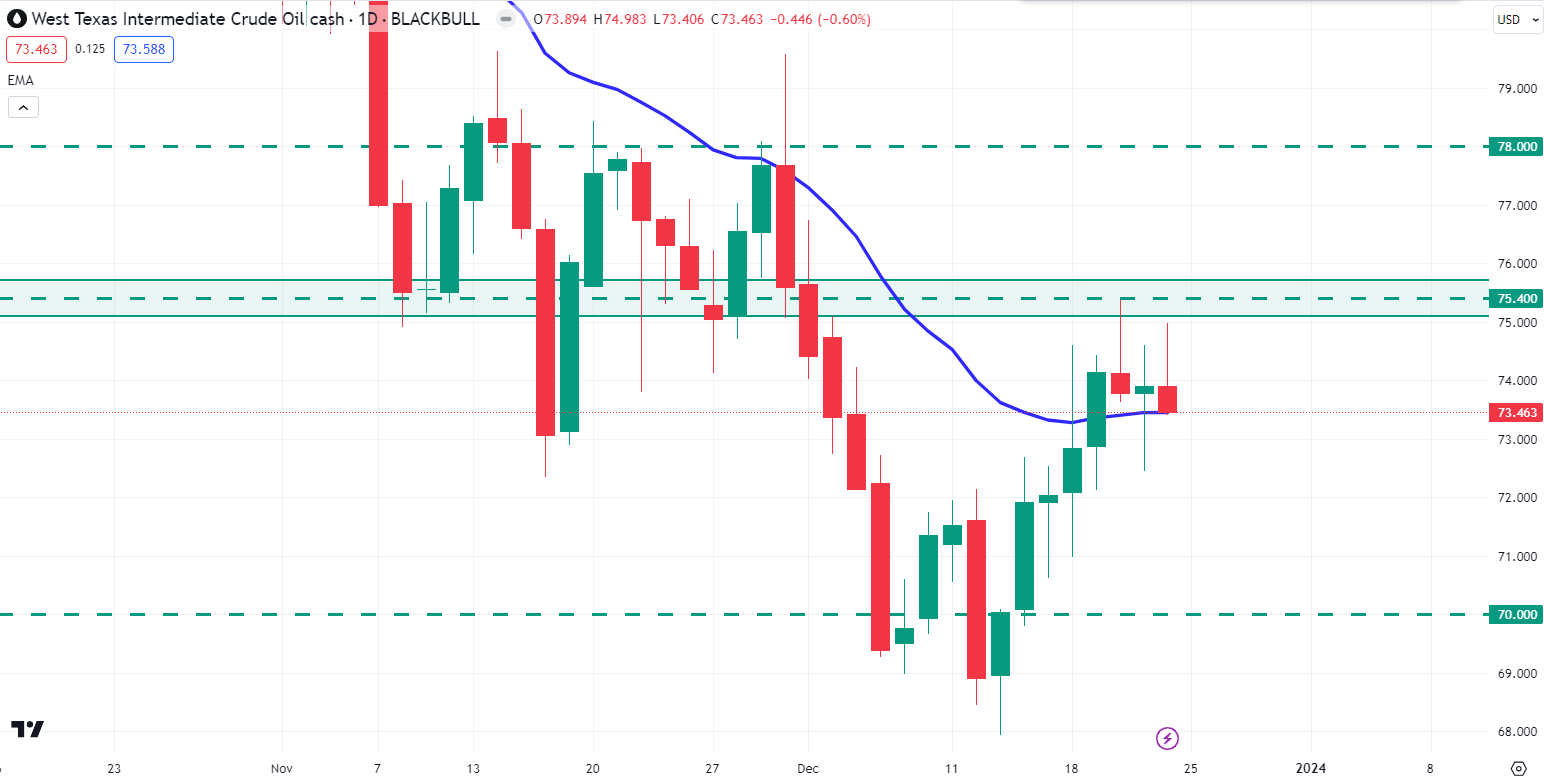
Image: TradingView
In the daily chart, the price had a daily bearish pin bar close below the $75.00 price area, but 20 EMA is still residing below the price. So, if the price can break below the 20 EMA with a daily bearish candle close, bears may continue the bearish trend toward the $70.00 price area.
On the bullish side, if the price bounces higher from 20 EMA and breaks above the $75.40 price area with a daily bullish candle close, bulls may continue further upward toward the $78.00 price area in the days ahead.