


EURUSD
Fundamental Perspective
The EURUSD pair ended the week around 1.0370, nearly unchanged from its previous close of 1.0361, as trade tensions remained the dominant market force. The US Dollar strengthened early in the week after President Trump imposed tariffs—25% on Mexican and Canadian imports and 10% on Chinese goods—while warning that levies on the EU and UK were likely. Although Mexico and Canada secured a temporary 30-day reprieve after agreeing to reinforce border security, China faced immediate tariffs and responded with duties on US coal, liquefied natural gas, and automobiles. This initial market turmoil saw the USD rise sharply before softening midweek as concerns eased.
Midweek, easing tensions with neighbouring countries briefly weighed on the USD, allowing EUR/USD to recover to 1.0441. Meanwhile, the US employment data painted a mixed picture. While ADP Employment Change surpassed forecasts, job openings declined, and weekly jobless claims unexpectedly rose. The January Nonfarm Payrolls report was disappointing, revealing only 143,000 new jobs versus the anticipated 170,000. However, the unemployment rate dipped to 4%, and annual wage inflation climbed to 4.1%, exceeding market expectations.
In Europe, economic indicators continued to weigh on the euro. With the ECB maintaining its dovish stance, inflation figures aligned with forecasts, while manufacturing remained sluggish. Germany posted firm factory orders, yet industrial production contracted. The upcoming testimony from Federal Reserve Chair Jerome Powell and key economic releases from both the US and EU will shape market direction.
Technical Perspective
The price is consolidating on the weekly chart, leaving mixed signals for investors—experts seeking a range breakout to determine further direction.
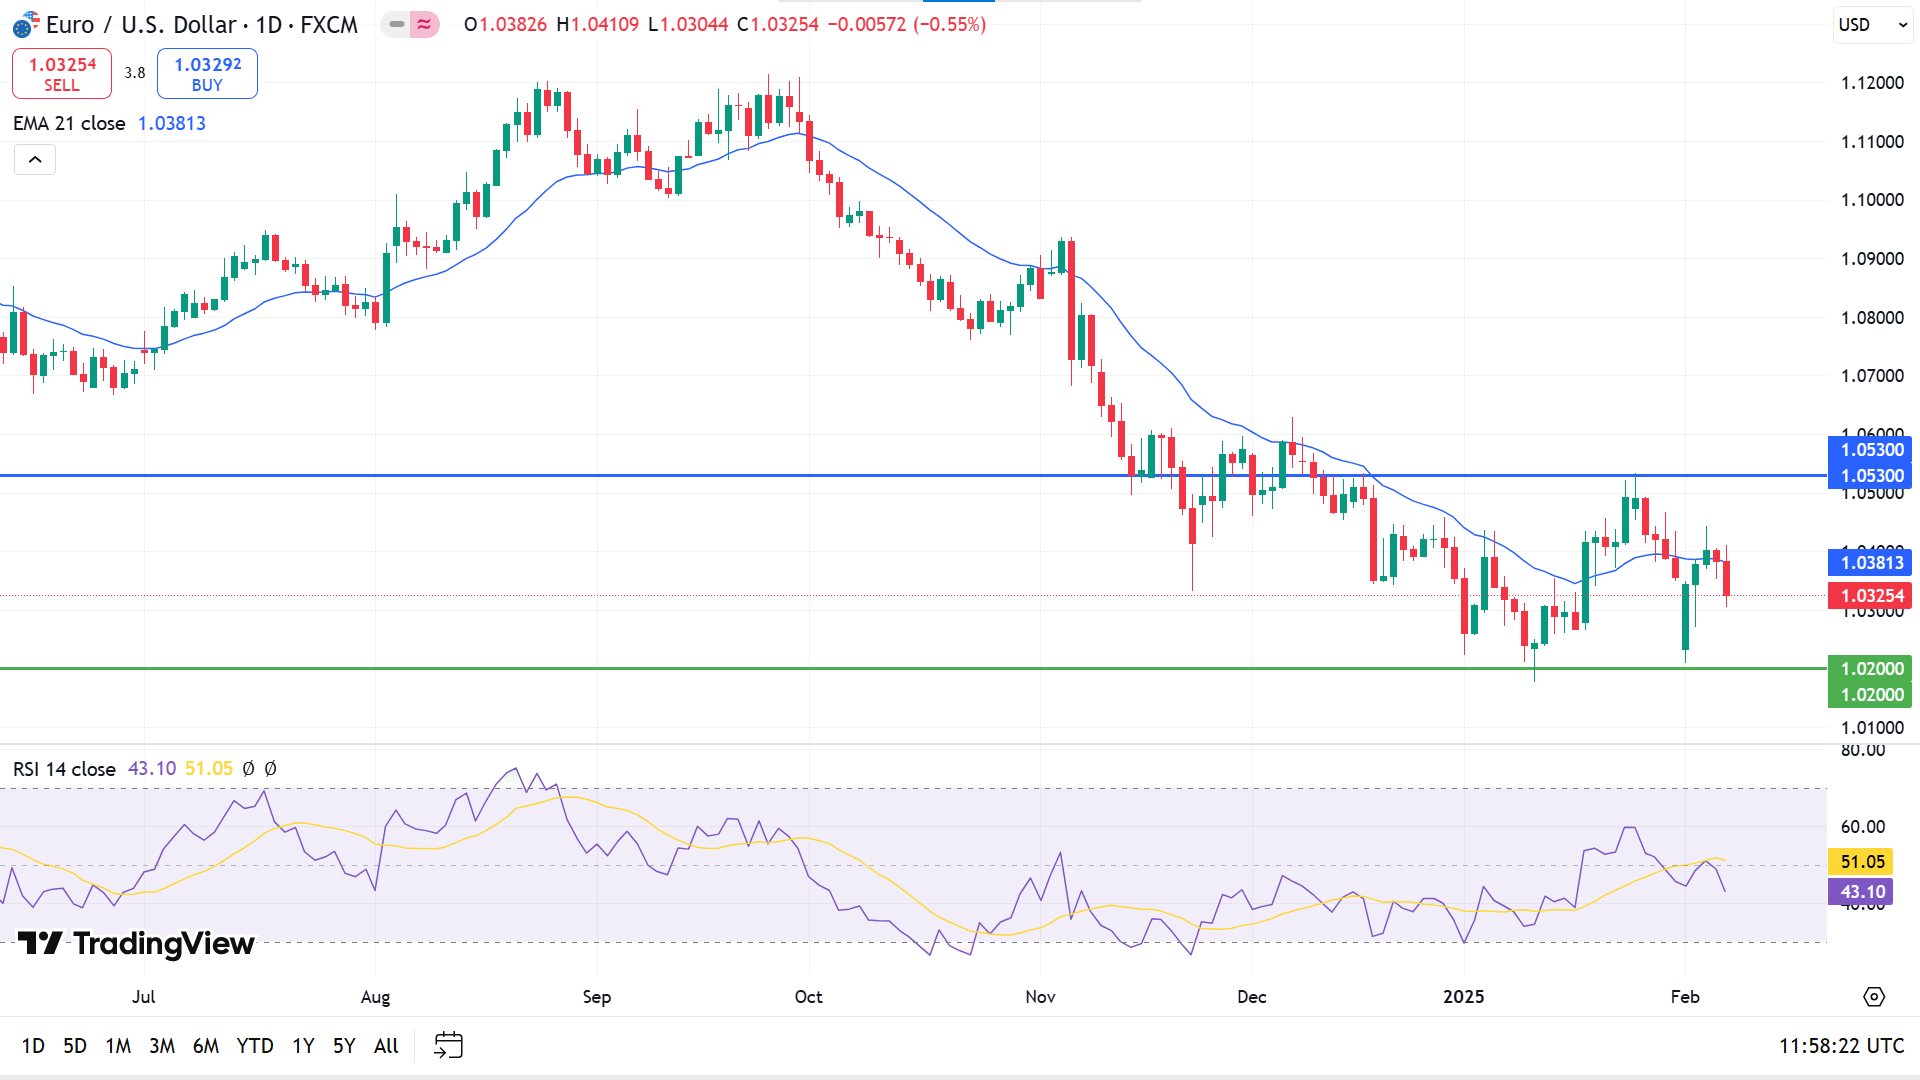
The daily chart shows that the price has been floating between 1.0530 and 1.0200 since mid-December, reaching below the EMA 21 line. The RSI indicator window also supports the bearish pressure through the dynamic signal line edging downward from the midline of the indicator window.
Based on the indicators' readings, the price remains in a downtrend, and price action traders may observe support at 1.0200. A breakout of that level might enable selling opportunities toward the next support level, near 0.9950.
Meanwhile, if the price reaches above the EMA 21, it might trigger short-term buyers toward the range top near 1.0530. A breakout of the resistance might invalidate the bearish signal and drive the price forward to the next resistance near 1.0771.
GBPJPY
Fundamental Perspective
The GBP/JPY pair rebounded to nearly 189.50 after an earlier four-month low of 188.00. The Pound Sterling regained strength as investors adjusted to the Bank of England's dovish stance and a downward revision of the UK's GDP growth forecast for the year, now at 0.75% compared to 1.5% in November. Although the BoE's 25 basis-point rate cut to 4.5% was widely expected, the voting pattern signalled a more accommodative stance than markets had anticipated.
Seven of the nine-member Monetary Policy Committee supported the 25 bps cut, while two, including noted hawk Catherine Mann, favoured a more significant 50 bps reduction. Market expectations had leaned toward eight members backing a cut and one advocating for steady rates, making the outcome softer than anticipated. This data contributed to the strength of the GBP as investors recalibrated their expectations.
Meanwhile, the Japanese Yen weakened despite more substantial expectations of a hawkish Bank of Japan. BoJ board member Naoki Tamura suggested rates rise by at least 1% in the second half of the fiscal year starting in April, contingent on broad-based wage growth sustaining inflation. However, the Yen struggled as the BoJ's policy path remained uncertain.
Technical Perspective
The price has resumed the bearish trend on the weekly chart, posting two consecutive losing candles, leaving sellers optimistic.
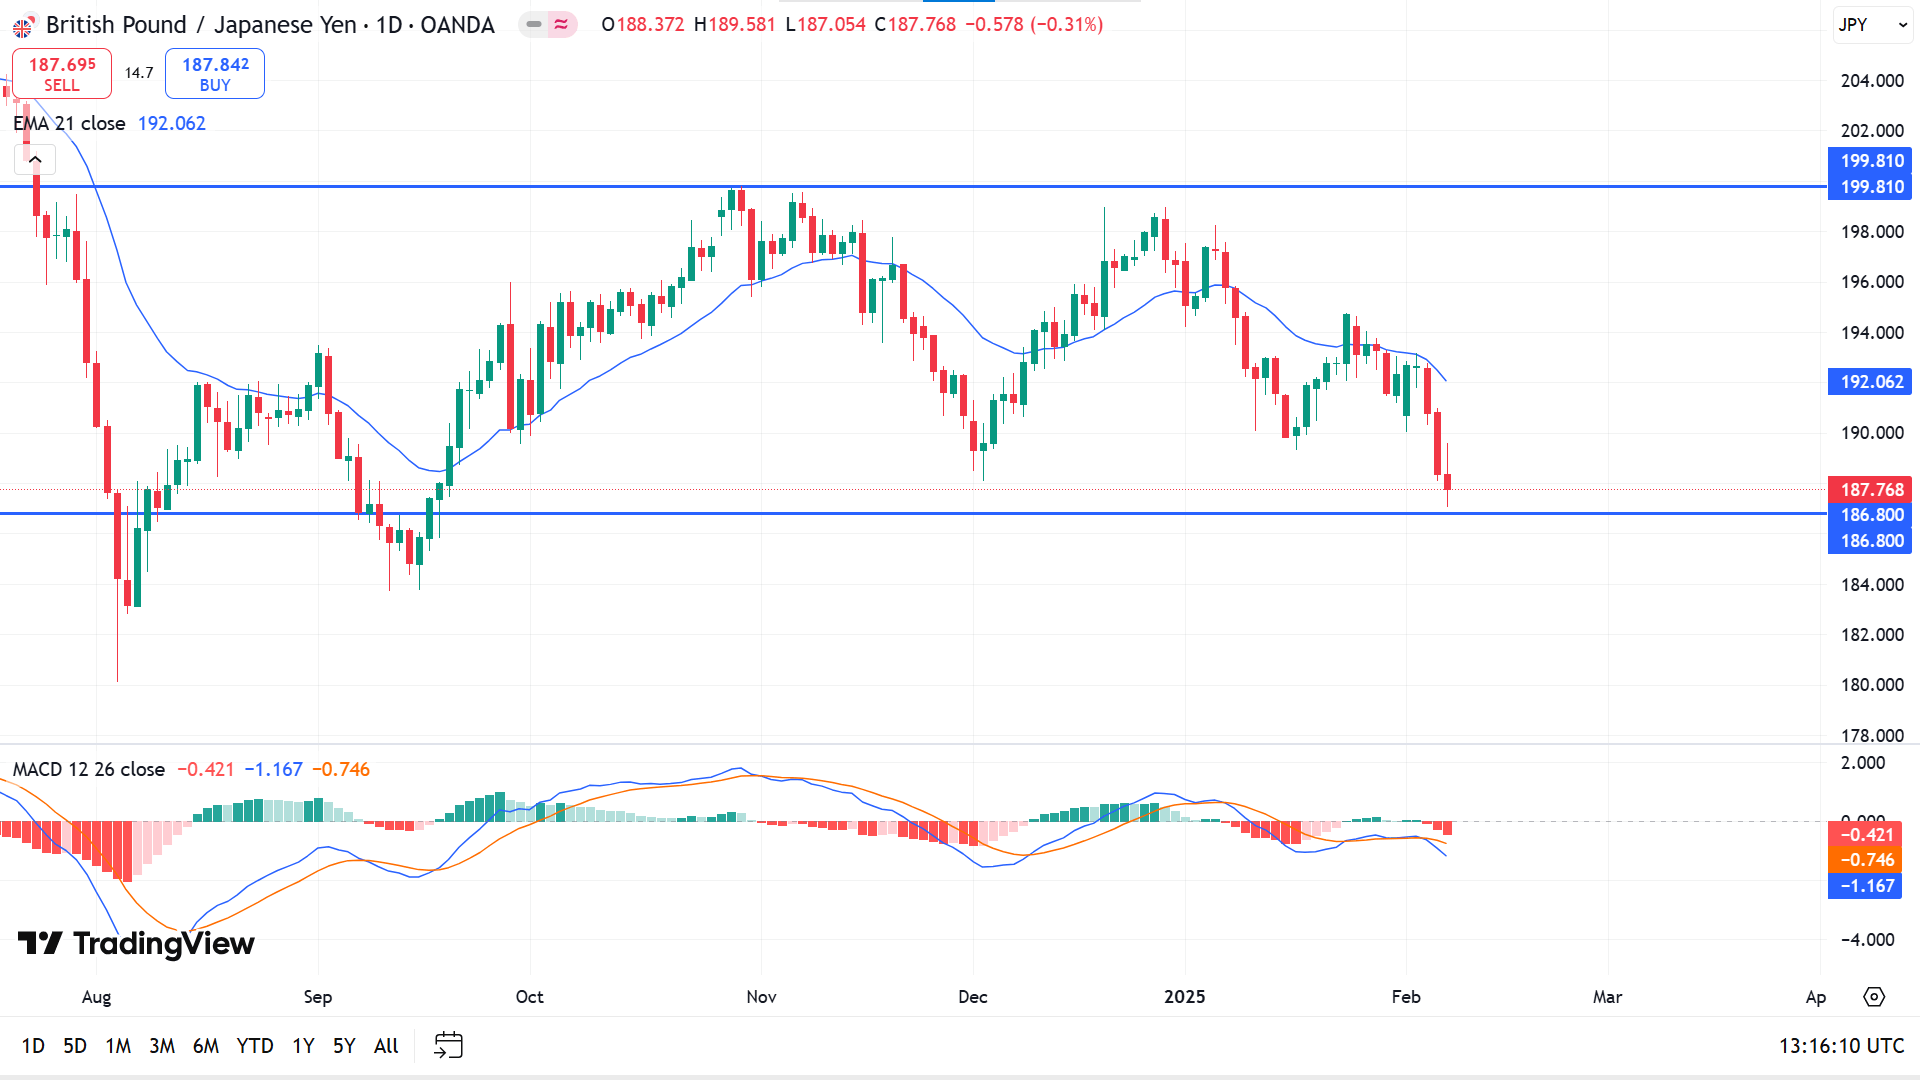
On the daily chart, the price moves below the EMA 21 line, declaring bearish pressure reaches adequate support near 186.80. The MACD indicator window supports the bearish pressure through the dynamic signal lines and red histogram bars below the midline.
Based on the market context, traders seek the reaction to the support near 186.80 for opening long orders. The price can surge toward the primary resistance of 192.06, followed by the next resistance near 199.81.
On the negative side, the bullish signal would be invalidated if the price declines below support at 186.80. This might trigger sellers toward support near 182.89.
Nasdaq 100 (NAS100)
Fundamental Perspective
The Dow and Nasdaq declined by 0.5% for the week, while the S&P 500 edged down 0.2%. US nonfarm payrolls increased by 143,000 last month, falling short of the 175,000 jobs expected by analysts surveyed by Bloomberg. Meanwhile, consumer sentiment dropped to its lowest level since July, and inflation expectations for the year ahead rose to their highest since November 2023, according to preliminary data from the University of Michigan. The report pointed to growing concerns about the economic impact of the Trump administration's tariff policies.
Earlier in the week, China imposed retaliatory tariffs on the US, while Washington delayed planned levies on Mexico and Canada for a month. Reports also indicated that President Trump intends to announce new reciprocal tariffs in multiple countries this week, adding to market uncertainty.
In the bond market, the US two-year Treasury yield climbed 8.1 basis points to 4.29%, while the 10-year yield increased 5.5 basis points to 4.49%. Among corporate movers, Amazon shares dropped 4.1%, ranking among the worst performers on major indices. While the company posted stronger-than-expected fourth-quarter earnings, its first-quarter revenue outlook fell short of Wall Street's forecasts, weighing on investor sentiment.
Technical Perspective
The price floats sideways on the weekly chart, creating green candles that leave buyers optimistic.
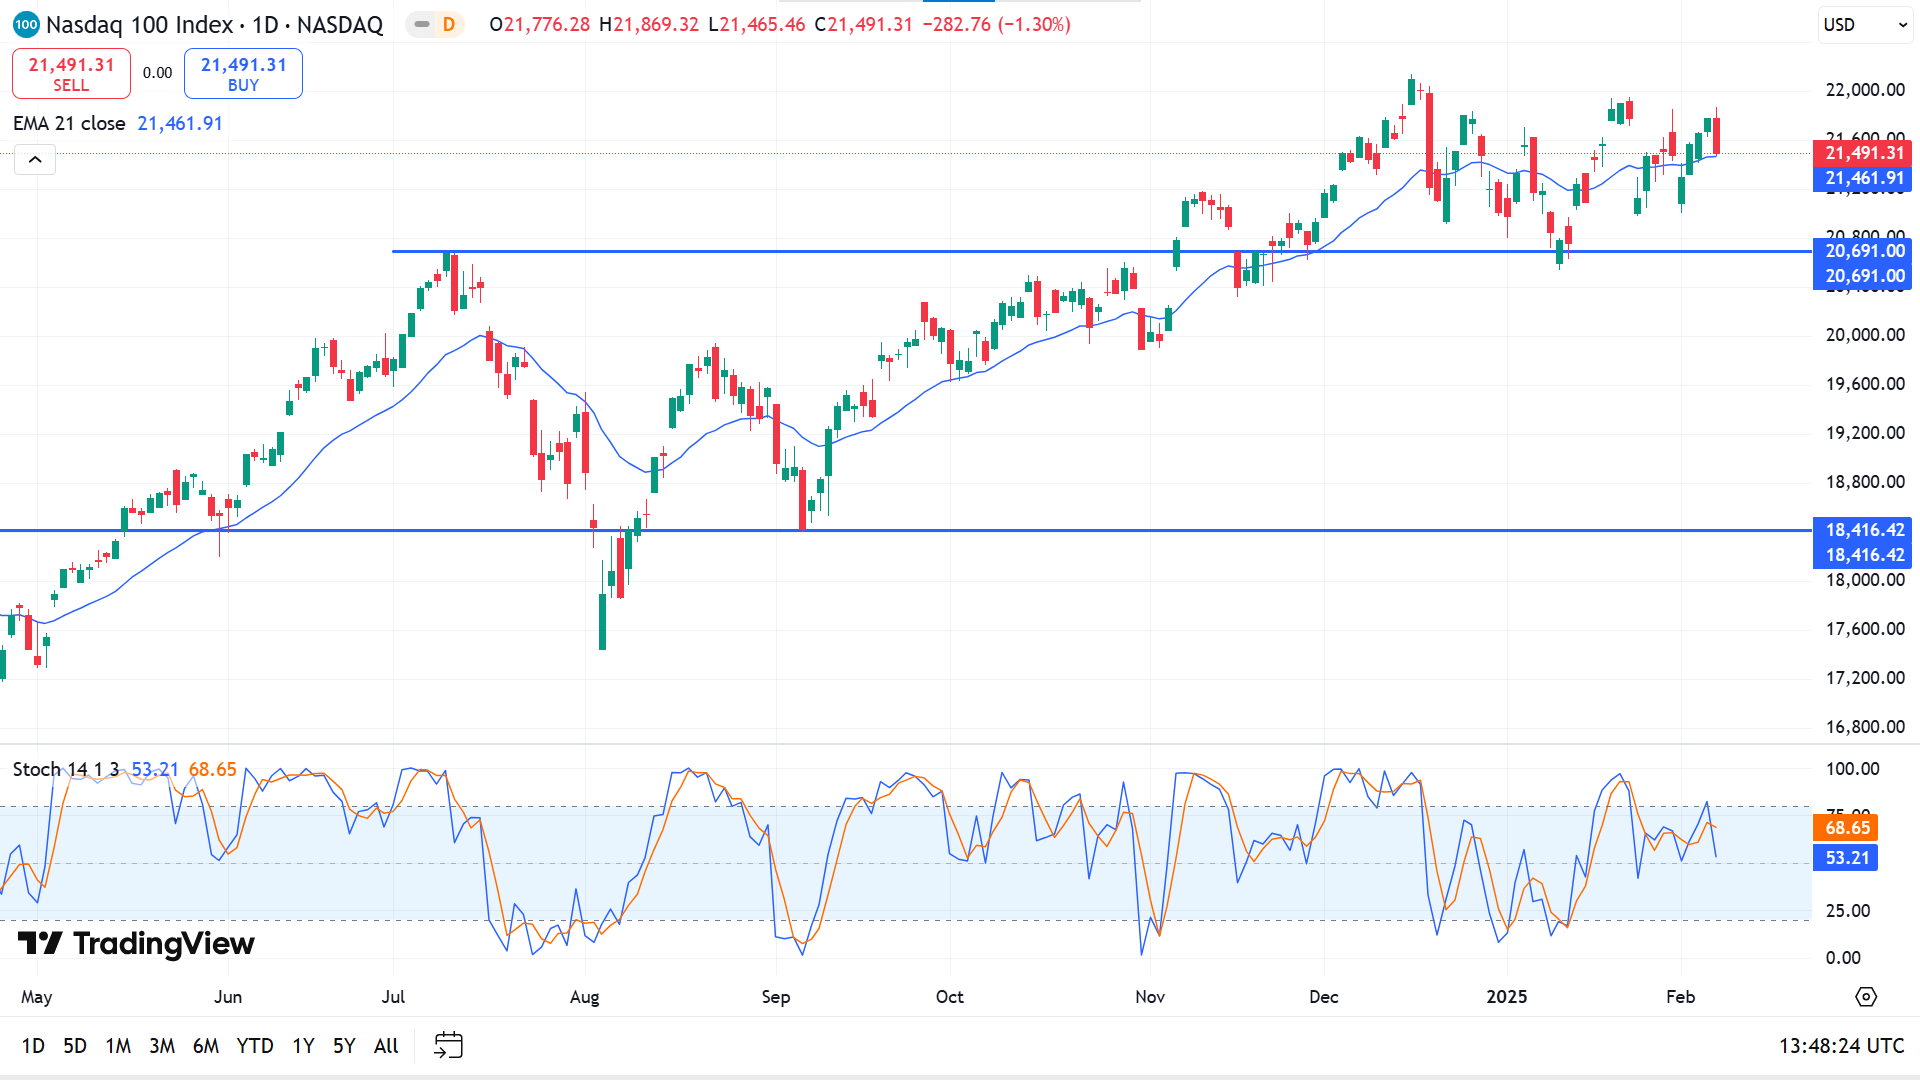
The price reached the EMA 21 line, reflecting bullish pressure on the daily chart. The stochastic indicator window declares fresh bearish pressure through dynamic signal lines, creating a bearish crossover below the upper level edging downside.
According to the current scenario, as long as the price remains above the resistance of 20691.00, it can beat the ATH of 22,133.22.
On the other hand, if the price drops below the support of 20691.00, it might disappoint buyers. It might enable short-term selling opportunities toward the primary support of 19,943.86.
S&P 500 (SPX500)
Fundamental Perspective
U.S. stocks declined on Friday, wiping out the S&P 500's weekly gain as investor sentiment weakened amid concerns over President Trump's plan for reciprocal tariffs. The S&P 500 fell 0.9%, ending the week down 0.2% and breaking a three-day winning streak.
Trade tensions remained in focus after Trump signalled that details of new tariffs would be announced this week. Last Friday, markets had already been unsettled by expected levies on Canada, Mexico, and China, though tariffs on the first two were later paused. Meanwhile, the Federal Reserve reaffirmed that the U.S. economy was growing steadily, keeping interest rates unchanged while monitoring inflation and labour market conditions. Fed Chair Jerome Powell noted that policy decisions would depend on the evolving impact of trade and fiscal uncertainties.
On the economic front, consumer inflation expectations rose, while the unemployment rate declined to 4% in January, accompanied by more substantial wage growth. Treasury yields climbed as investors digested economic data and trade-related risks, with the 10-year yield increasing 4.6 basis points to 4.483%.
Technical Perspective
The last green candles on the weekly chart reflect buyer domination on the asset, and the bullish trend remains intact.
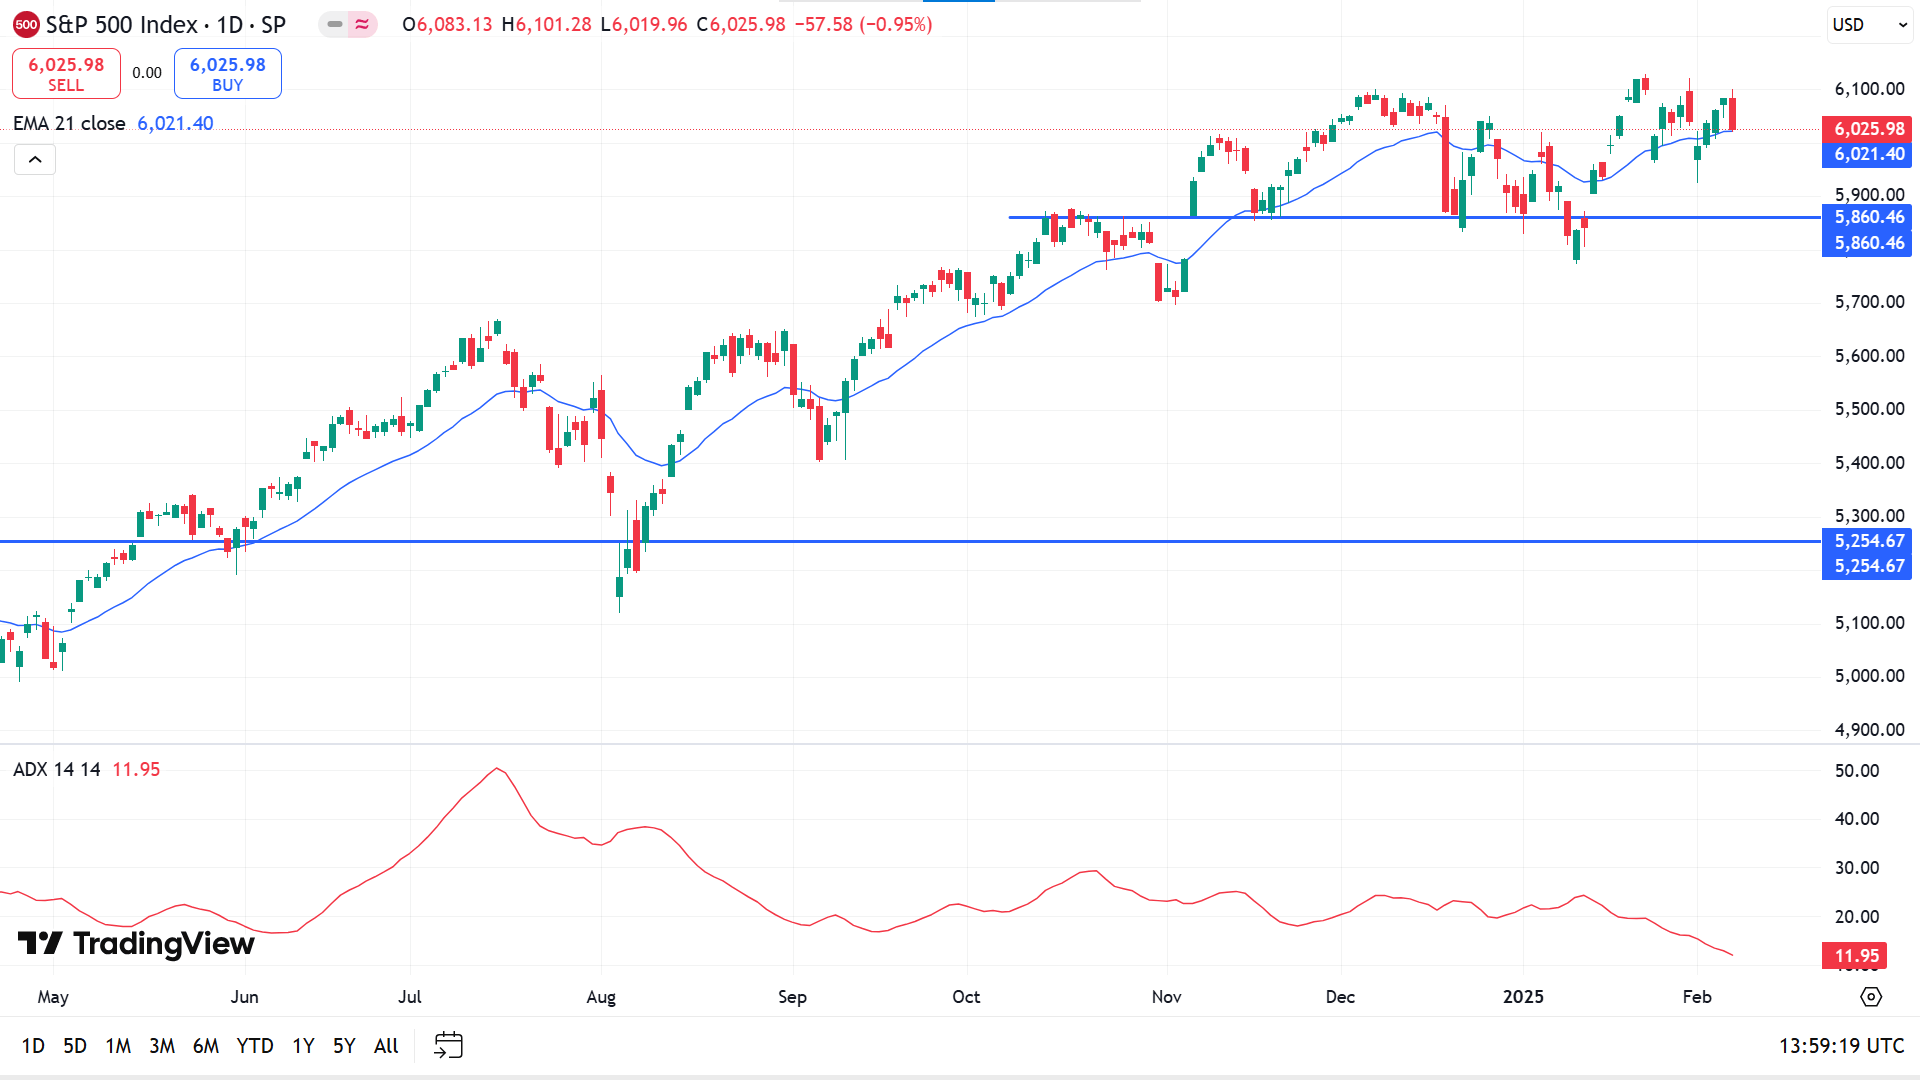
The price floats above the EMA 21 line on the daily chart. The ADX dynamic line slopes downward, indicating the current bullish trend might lose pressure and be subject to retrace.
According to the price action concepts, buyers are active near the resistance of 5860.46 to beat the ATH of 6,128.18. Meanwhile, buyers would be disappointed if the price declines below 5860.46, which might turn short-term sellers toward 5,646.03.
Gold (XAUUSD)
Fundamental Perspective
Gold (XAU/USD) failed to reach a new record high on Friday as the market reacted to the latest U.S. Nonfarm Payrolls data. The report showed job growth of 143,000 in January, falling short of the expected 170,000. However, market expectations had been even more pessimistic, with some estimates as low as 105,000. These data led to an initial surge in gold prices, but a swift reversal followed as investors adjusted their positions.
Despite this, gold remained supported by geopolitical uncertainty and continued central bank purchases. The People's Bank of China expanded its gold reserves for the third consecutive month, adding approximately 0.16 million troy ounces in January, even as prices hovered near record highs. China's central bank resumed purchases in November following a six-month pause, reflecting ongoing demand for the metal as a hedge against economic and trade risks.
Concerns over potential U.S. tariffs on the Eurozone and other nations further bolstered gold's appeal as a safe-haven asset. Citigroup forecasted that gold prices could reach $3,000 per ounce within three months if current conditions persist. Additionally, Zimbabwe's gold production rose to 3,134.34 kg in January, up from 2,375.32 kilograms a year earlier, with increased output driven primarily by smaller-scale miners.
Technical Perspective
On the weekly chart, six consecutive gaining candles reflect excessive bullish pressure on the asset, and buyers are in charge of the asset price.
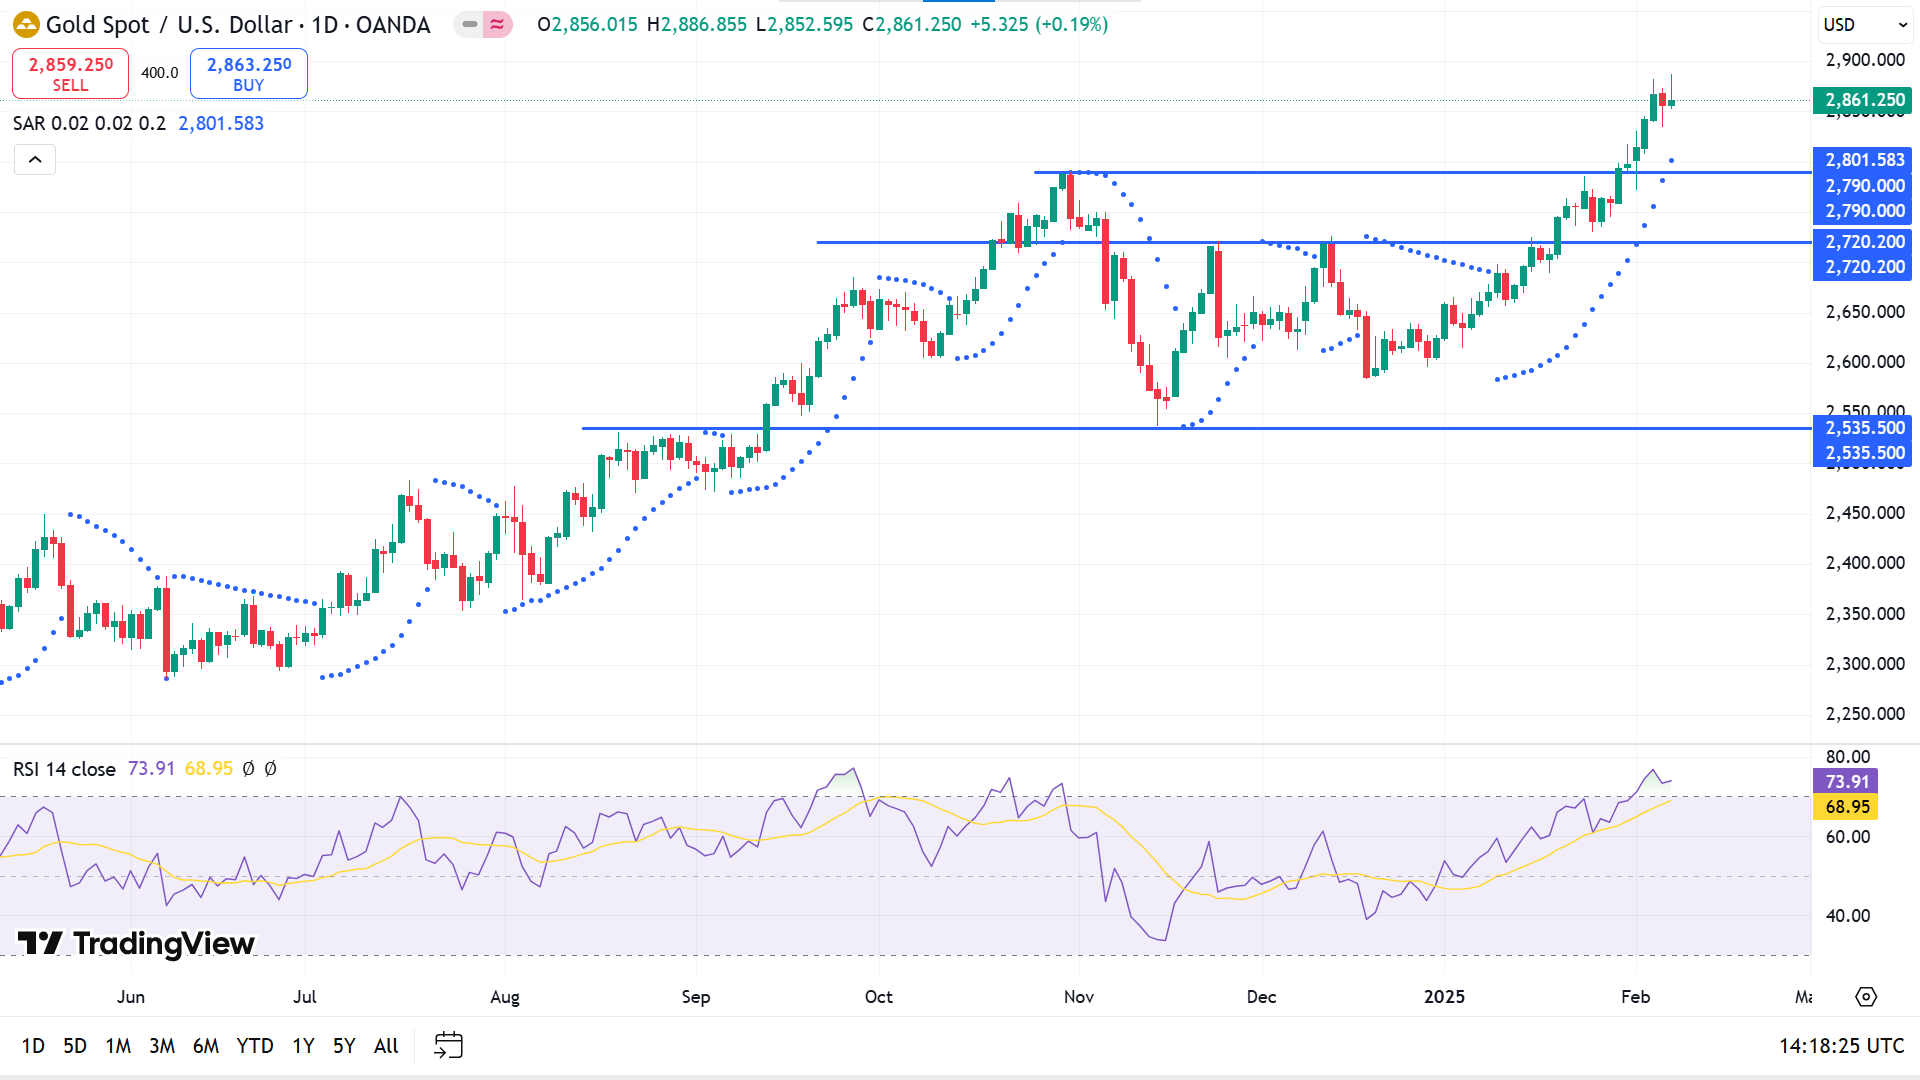
As the parabolic SAR continues, the price remains on a solid bullish trend on the daily chart, creating dots below the price candles. The RSI indicator shows overbought through the dynamic line floating above the upper line of the indicator window.
The price closed below the ATH near 2886.85. According to the current market scenario, buyers seek to open long orders near the primary support of 2790.00.
On the other hand, as the price is overbought, a retracement is expected to be made to 2790.00. Any breakout might spark optimism for short-term sellers toward the primary support near 2720.20.
Bitcoin (BTCUSD)
Fundamental Perspective
Bitcoin (BTC) hovered around $97,000 on Friday after shedding nearly 5% over three days, with CryptoQuant reporting network activity at a one-year low. Traders are closely monitoring FTX's creditor repayments, which are set to begin on February 18, which could introduce market volatility.
BTC's decline accelerated earlier in the week, briefly touching $91,231 after U.S. President Donald Trump imposed tariffs on imports from China, Canada, and Mexico. The broader crypto market faced selling pressure, prompting liquidations. However, sentiment shifted after Mexican President Claudia Sheinbaum and Canadian Prime Minister Justin Trudeau announced they had temporarily agreed with Trump to pause the tariffs for 30 days while negotiating security and trade terms, which helped BTC recover, closing above $101,300 on Monday.
The sell-off led to $1.72 billion in total liquidations, with $373 million in BTC alone, per CoinGlass data. Bybit CEO Ben Zhou suggested the actual liquidation figure was far higher, estimating between $8-10 billion. He noted Bybit's 24-hour liquidations exceeded $2.1 billion, significantly higher than CoinGlass's reported $333 million, attributing the discrepancy to API limitations.
Technical Perspective
The price moves sideways on the weekly chart, hovering above a baseline, reflecting mixed signals.
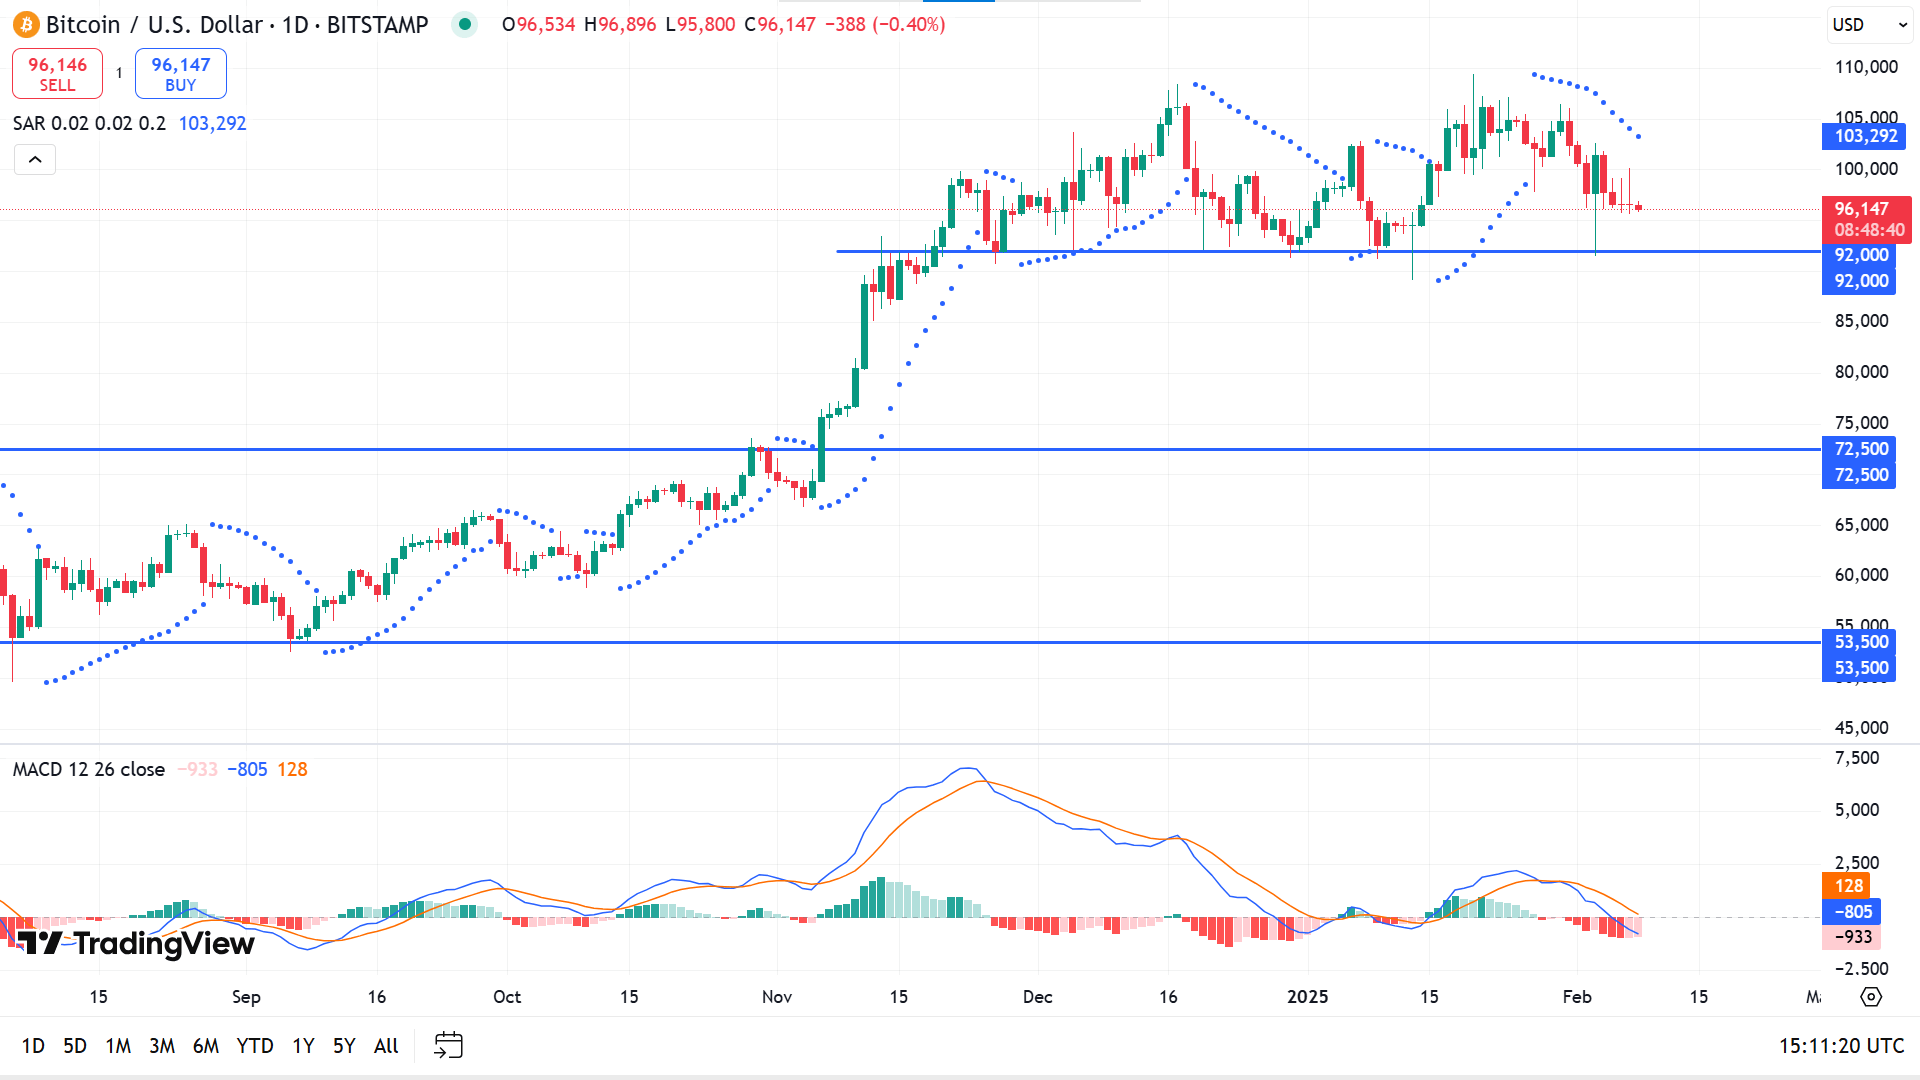
The price is currently on a short-term bearish trend as the parabolic SAR creates dots above the price candles. The MACD indicator window supports the bearish pressure through the dynamic lines sloping downward and red histogram bars below the midline of the indicator window.
According to this price action, the price keeps floating above 92,000, dimming optimism for buyers to beat the ATH of 109,356. Meanwhile, as the price fails to hold the 100,000 mark, it's always possible the price faces a retracement to collect sufficient liquidity.
If the price declines below the support of 92,000, it might invalidate the current bullish signal. Any breakout below the support might trigger short-term sellers toward the next support near 72,500.
Ethereum (ETHUSD)
Fundamental Perspective
Vitalik Buterin dismissed calls from venture capitalists and crypto experts advocating changes to the Ethereum Foundation. He rejected the notion of a "Degen Casino" approach that prioritises speculation over real-world utility. While acknowledging its popularity within the crypto space, he argued that such a model primarily benefits a small subset of users rather than fostering meaningful blockchain innovation.
His comments come amid ongoing scrutiny over the Ethereum Foundation's Ether sales, with platforms like Santiment and Arkham Intel tracking on-chain transactions. These sales have sparked debate among ETH holders and traders, raising concerns about their potential impact on market stability and selling pressure.
Shifts have also influenced market sentiment around Ethereum in large-scale holdings. IntoTheBlock data shows that wallets holding over $10 million in ETH saw their balances shrink from $379.36 billion to $312.93 billion last week, a 17% decline. Similarly, wallets in the $1 million to $10 million range reduced their holdings from $35.38 billion to $29.51 billion.
On-chain trends suggest that major investors remain cautious about Ethereum's short-term recovery, with whale sentiment turning more defensive amid recent price declines.
Technical Perspective
The last red candle in the weekly chart declares bearish pressure on the asset, leaving sellers optimistic.
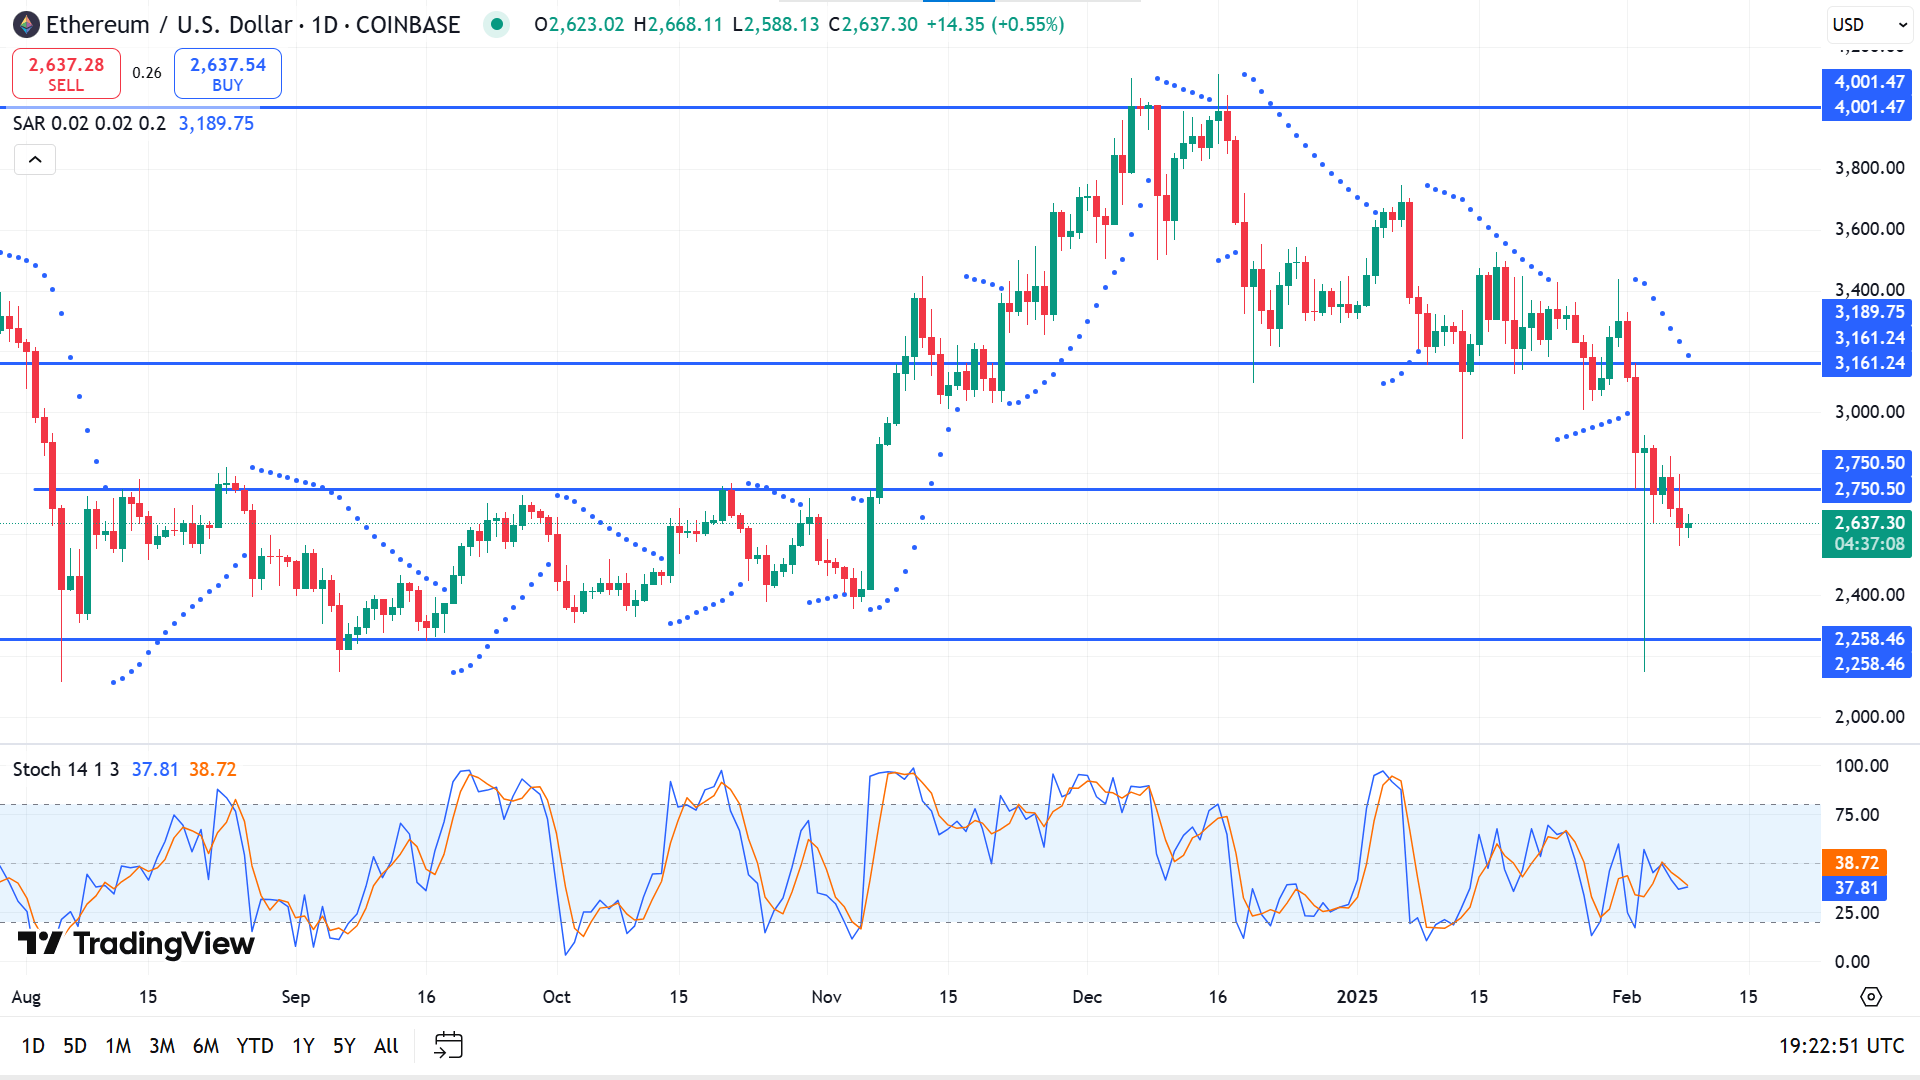
As the parabolic SAR indicates, the price reached below the support of 2750.50 on the daily chart due to recent bearish pressure. The stochastic indicator window supports the bearish trend through dynamic signal lines sloping downward.
According to the current scenario, as long as the price remains below 2750.50, sellers will remain optimistic about the previous support of nearly 2258.46.
However, price action traders might seek to open adequate long orders above the 2750.50 level. It can trigger the price toward the primary resistance near 3161.24.
Nvidia Stock (NVDA)
Fundamental Perspective
Nvidia (NVDA) has experienced a volatile year, with its stock reaching record highs before plunging as much as 22%. Investor concerns deepened after Chinese AI startup DeepSeek claimed its R1 model achieved cutting-edge results at a significantly lower cost. While experts continue scrutinising these claims, uncertainty remains about their implications for Nvidia's AI market position.
Some fear that if DeepSeek's model was developed using older Nvidia chips, demand for the company's advanced AI processors could diminish. However, growing evidence suggests this concern is overstated. Several major customers have publicly reaffirmed their commitment to Nvidia's technology, a positive sign that could translate into billions in future revenue.
Despite its growth potential, Nvidia's stock has experienced sharp volatility, losing over 20% multiple times in the past year. Investors familiar with its history know the stock shed 66% between late 2021 and 2022, highlighting its unpredictable nature.
For those willing to tolerate market swings, Nvidia trades at 28 times next year's expected earnings, well below its three-year average of 42. These data present an attractive opportunity to invest in an industry leader benefiting from strong secular trends.
Technical Perspective
NVDA recovers from the loss, and the last solid green candle reflects a bullish continuation, leaving buyers optimistic.
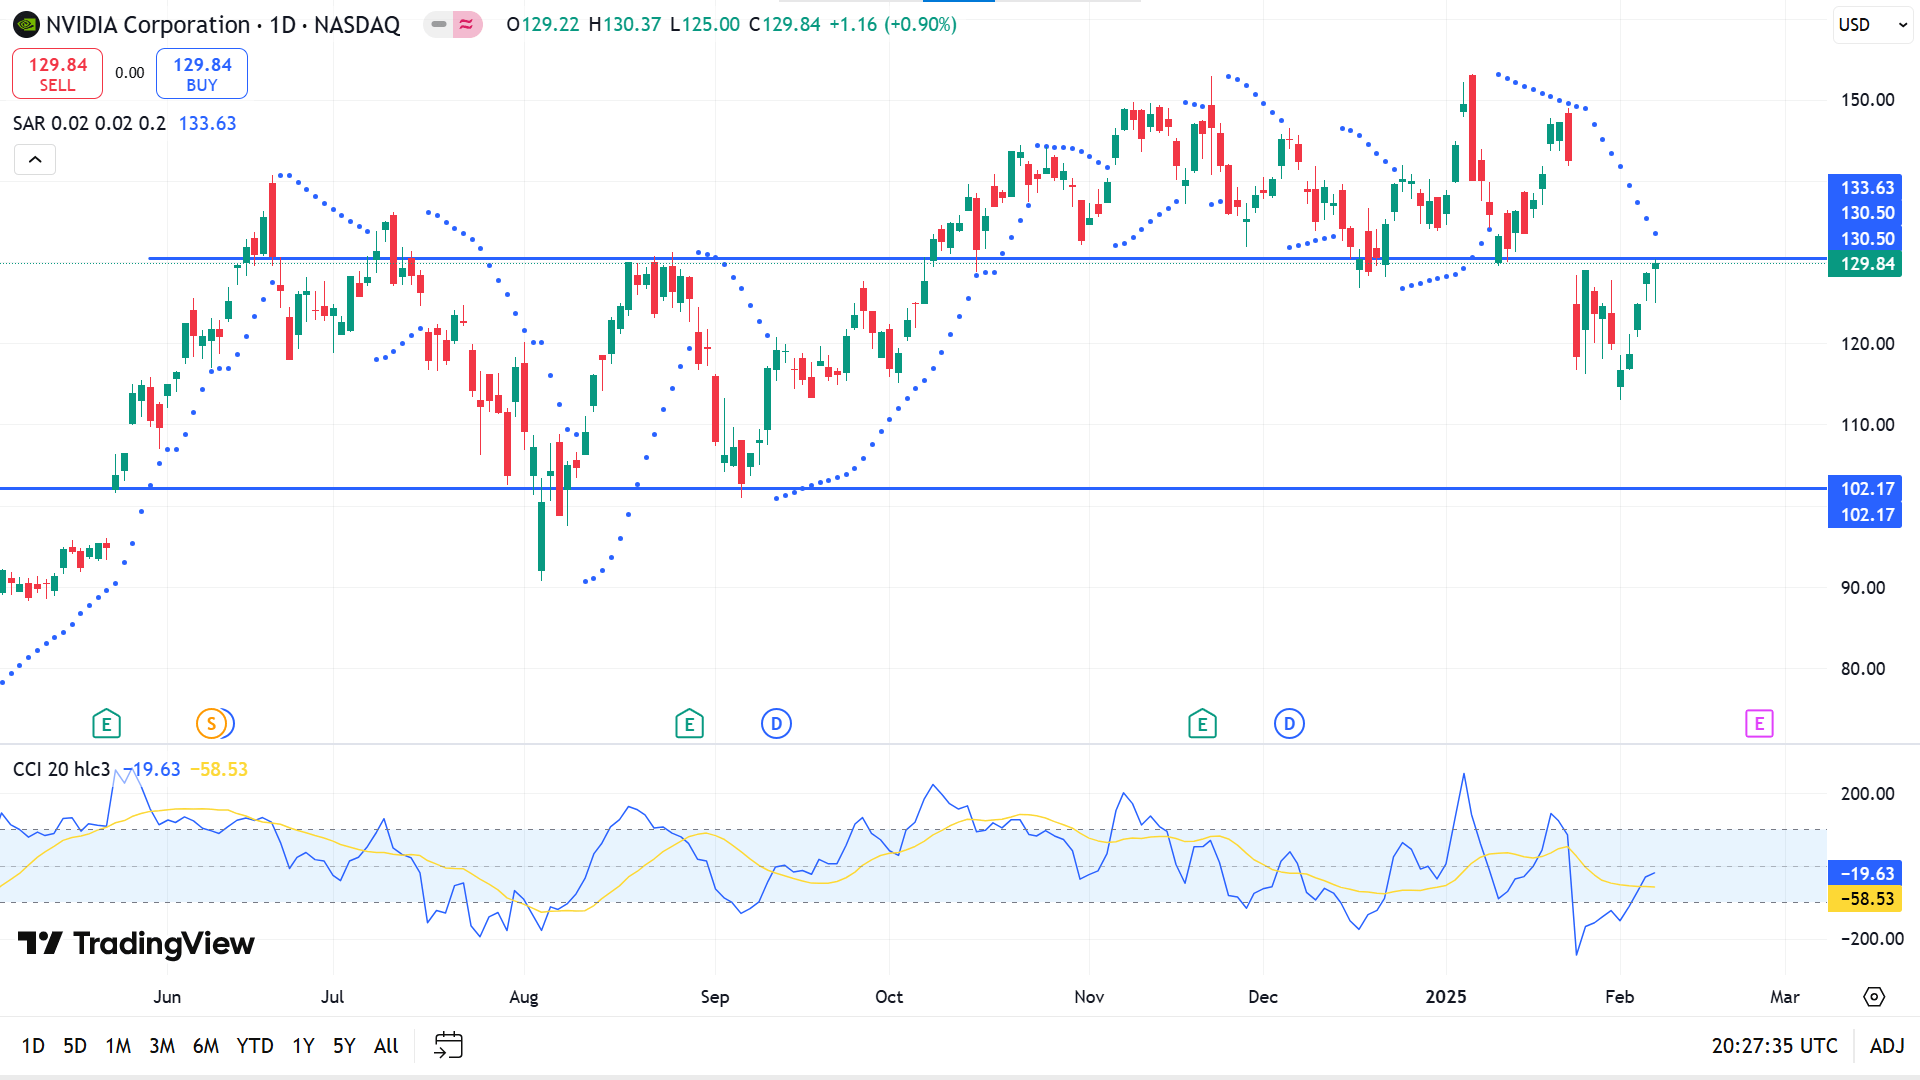
The price declined below the fine support of 130.50 but recovered and ended below the dynamic level on the daily chart. The parabolic SAR creates dots above the price candles, declaring a bearish trend, while the CCI indicator window declares fresh bullish pressure through the dynamic signal line sloping upward.
Based on the indicators' readings, if the dynamic support resistance of 130.50 works as before, the price can return to the previous support of 102.17. Meanwhile, sellers would be disappointed if the price surges above 130.50, which might enable buying opportunities toward the ATH of 153.13.
Tesla Stock (TSLA)
Fundamental Perspective
Tesla (TSLA) shares declined Friday as investors worried about a potential U.S.-China trade war. Concerns were further fueled by data from the China Passenger Car Association, which showed Tesla's China-made vehicle shipments fell 11.5% year-over-year in January and 32.5% from December. However, this decline was primarily anticipated due to the Model Y redesign, which temporarily disrupted production at the Shanghai factory.
In Australia, Tesla's deliveries dropped 33% year-over-year in January, with Model 3 shipments plummeting 63%. Investors are evaluating whether these declines stem primarily from production changes or if broader factors, such as shifting consumer sentiment toward Elon Musk's political activities, are also at play.
Despite sluggish delivery numbers, Tesla's full-year 2024 revenue reached $97.69 billion, a modest 1% increase from the previous year. While this growth is slower than in past years, Musk and some analysts emphasise Tesla's long-term value in autonomous driving, AI, robotaxis, and energy storage, arguing that these innovations could drive future profitability.
Technical Perspective
After hitting the ATH, the price entered the consolidating phase and retraced below an acceptable resistance on the weekly chart. The last red candle confirms sellers' domination on the asset price, keeping sellers optimistic.
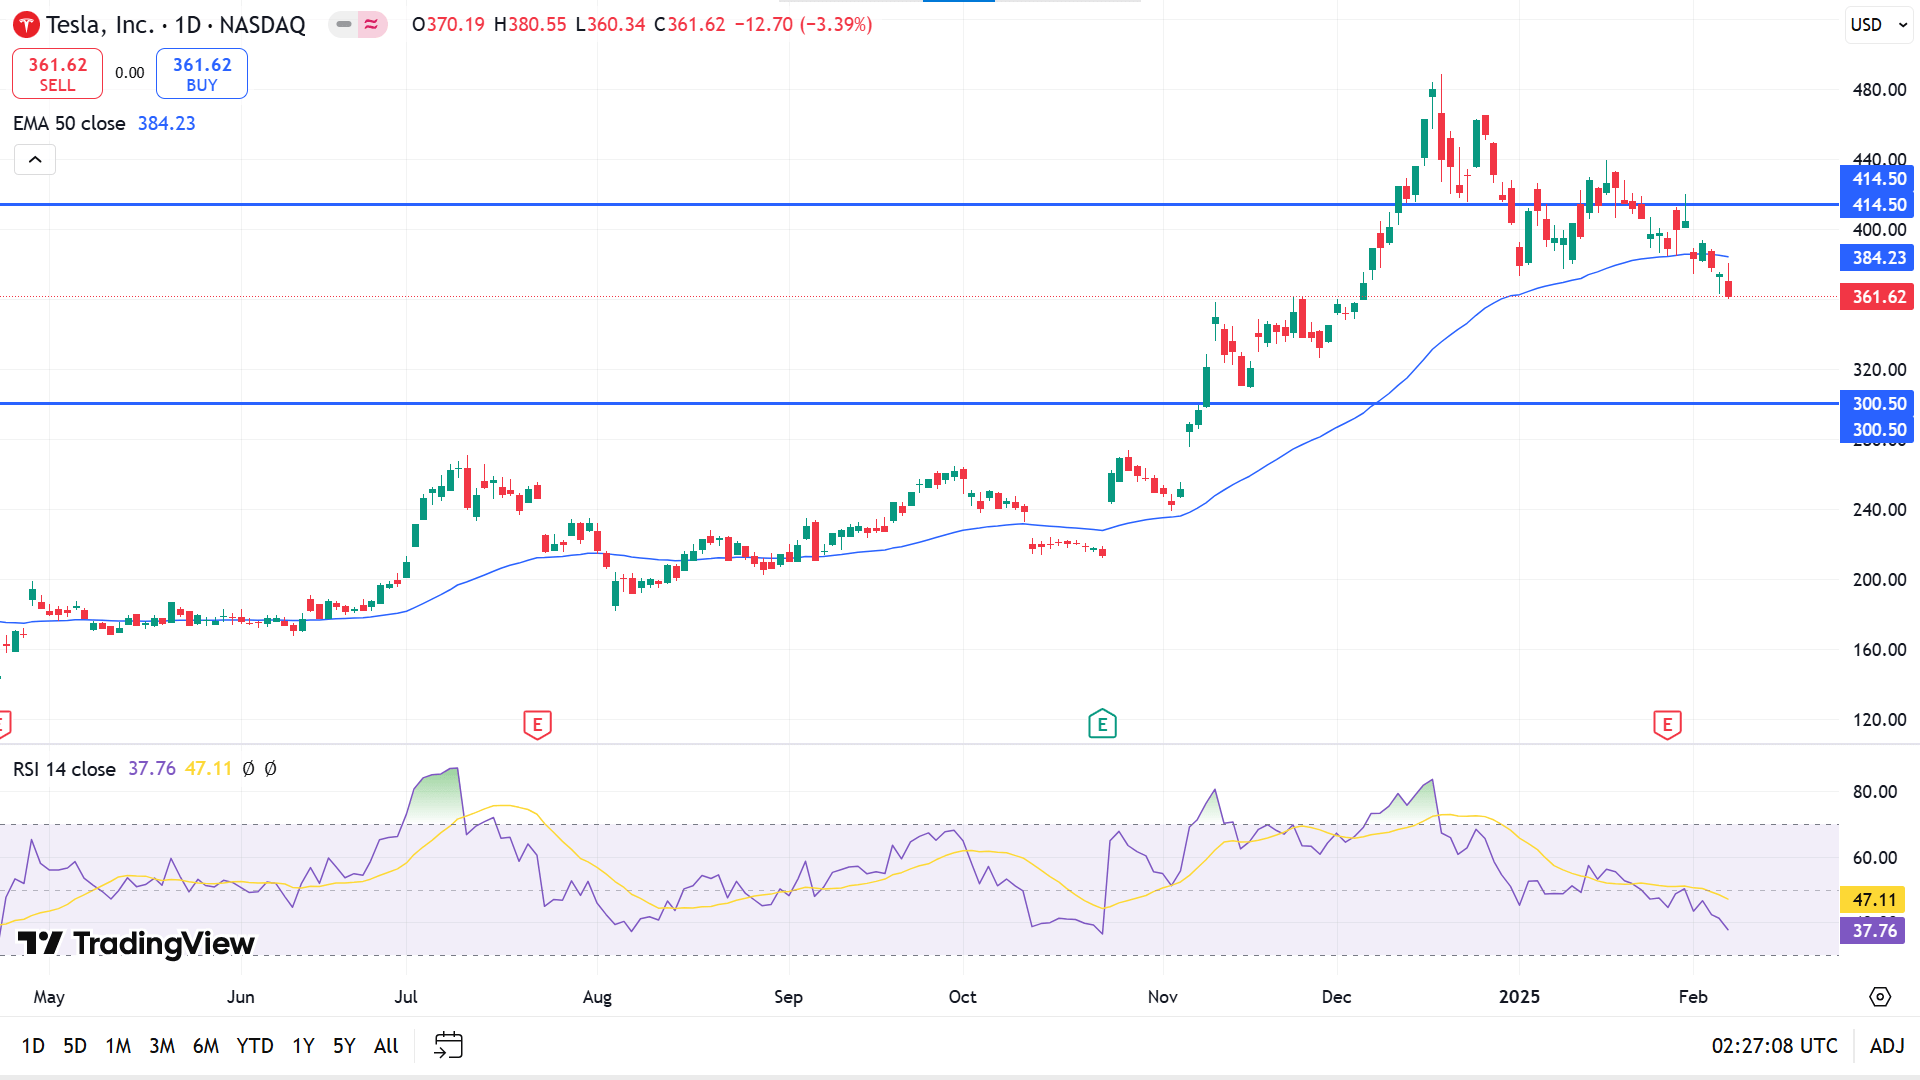
The price declines below the EMA 50 line on the daily chart, reflecting bearish pressure. The RSI indicator window supports the bearish pressure through the dynamic signal line edging downside.
According to the current scenario, sellers take charge below the dynamic level near 414.50, seeking liquidity support to beat the ATH of 488.54. Buyers may primarily seek to open long positions near the support 300.50. Meanwhile, the current bearish signal might be invalid if the price exceeds 414.50, enabling buying opportunities to beat the ATH.
WTI Crude Oil (USOUSD)
Fundamental Perspective
West Texas Intermediate (WTI) oil steadied at $70.80 per barrel on Friday, ending a four-day slide but remaining set for a third straight weekly decline. Prices faced pressure after U.S. President Donald Trump reaffirmed plans to expand domestic oil production, aiming to lower prices amid concerns over excess supply.
A surge in U.S. crude and gasoline inventories further weighed on the market, signalling weakening demand. Crude stockpiles jumped by 8.664 million barrels for the week ending January 31, significantly exceeding the forecasted 2.6 million-barrel increase and marking the most significant buildup in nearly a year.
Further weighing on sentiment, China imposed tariffs on U.S. oil, LNG, and coal in response to Trump's recent trade measures. However, the market impact is expected to be limited due to China's relatively low imports of U.S. energy. Hopes for a resolution persist as Trump and Chinese President Xi Jinping plan discussions on potential tariff rollbacks.
Providing some support, Saudi Aramco raised prices on strong demand from China and India, while U.S. sanctions on Russia tightened supply. Additionally, Trump's renewed push to curb Iran's oil exports could remove up to 1.5 million barrels daily from the market.
Technical Perspective
Three consecutive losing candles on the weekly chart declare ongoing bearish pressure on the asset, leaving sellers optimistic.
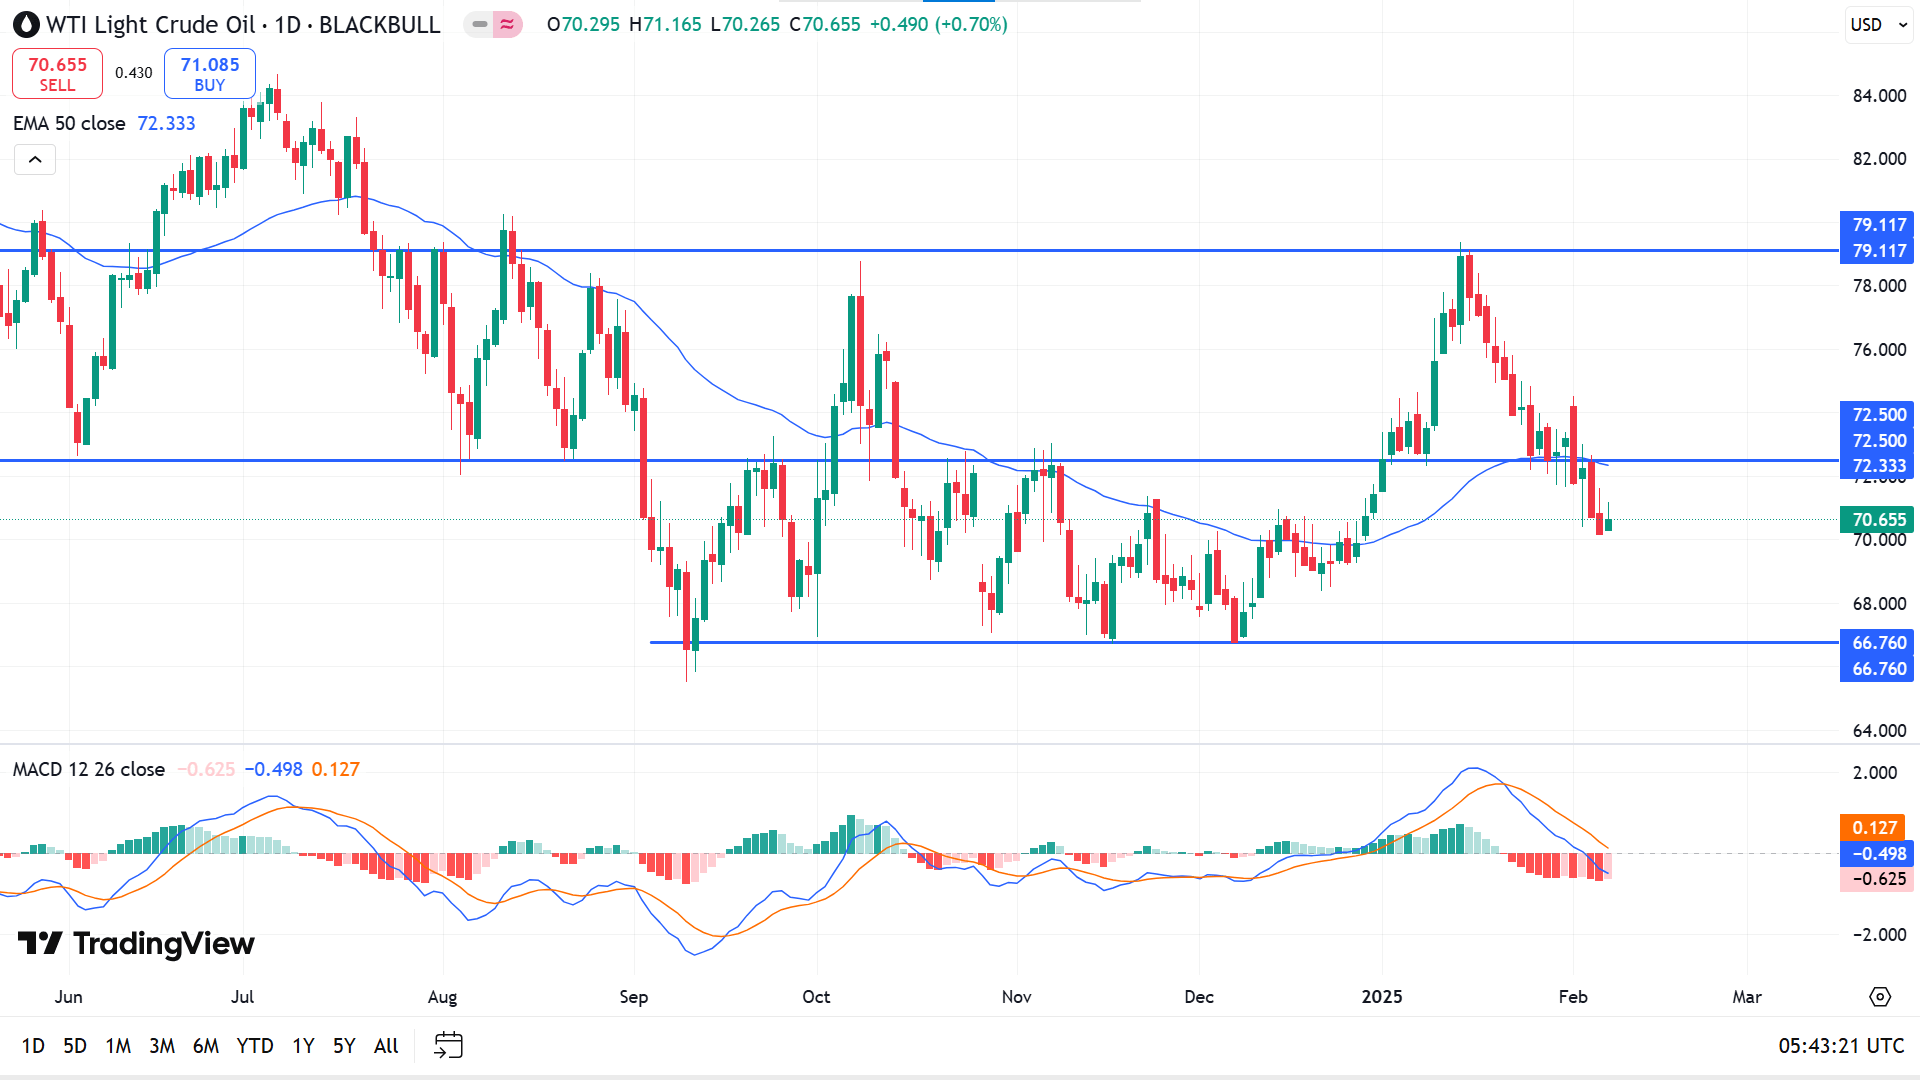
The daily chart shows the price is on a downtrend as it floats below the EMA 50 line. The MACD window supports downward pressure through dynamic lines, creating a bearish crossover, sloping downward, and red histogram bars.
Based on the broader market context, sellers are active from the dynamic level near 72.50 to beat the previous support of 66.76. On the other hand, if the price goes back above 72.50, it will disappoint sellers. It might enable buying opportunities toward the resistance near 79.11.