EURUSD
Fundamental Perspective
The EURUSD pair remained under selling pressure last week as the US Dollar (USD) maintained its strength amid heightened risk aversion fueled by President-elect Donald Trump's tariff plans. After briefly touching 1.0431 on early reports suggesting narrower, sector-specific tariffs, the pair reversed course when Trump dismissed these claims. By the weekend, it was trading near 1.0250, just above the multi-year low of 1.0212 reached on Friday.
Market anxiety deepened midweek after reports surfaced that Trump might invoke emergency powers to impose broad tariffs, stoking fears of escalating trade tensions. Meanwhile, the Federal Reserve's December meeting minutes highlighted rising inflation risks, with policymakers expressing concern over potential economic disruptions from Trump's policies. This further supported the USD, while equity markets faced renewed selling pressure.
US economic data largely supported the USD. The December Nonfarm Payrolls (NFP) report showed a robust 256,000 jobs added, surpassing expectations of 160,000, while unemployment fell to 4.1%. Though wage inflation eased to 3.9%, strong labour market data signalled the Federal Reserve might maintain higher rates, reinforcing the USD's strength.
Meanwhile, weak European data compounded the Euro's struggles. Germany's retail sales and factory orders declined, while Eurozone inflation showed mixed signals, with higher consumer prices but falling producer prices. With the European Central Bank likely to sustain a dovish stance, parity for EUR/USD seems increasingly probable. Upcoming US inflation and retail sales data will drive this week's focus.
Technical Perspective
The price continues to decline below the low of 2024 in the weekly chart. The last candle finished as an inverted hammer with a red body, supporting the bearish trend.
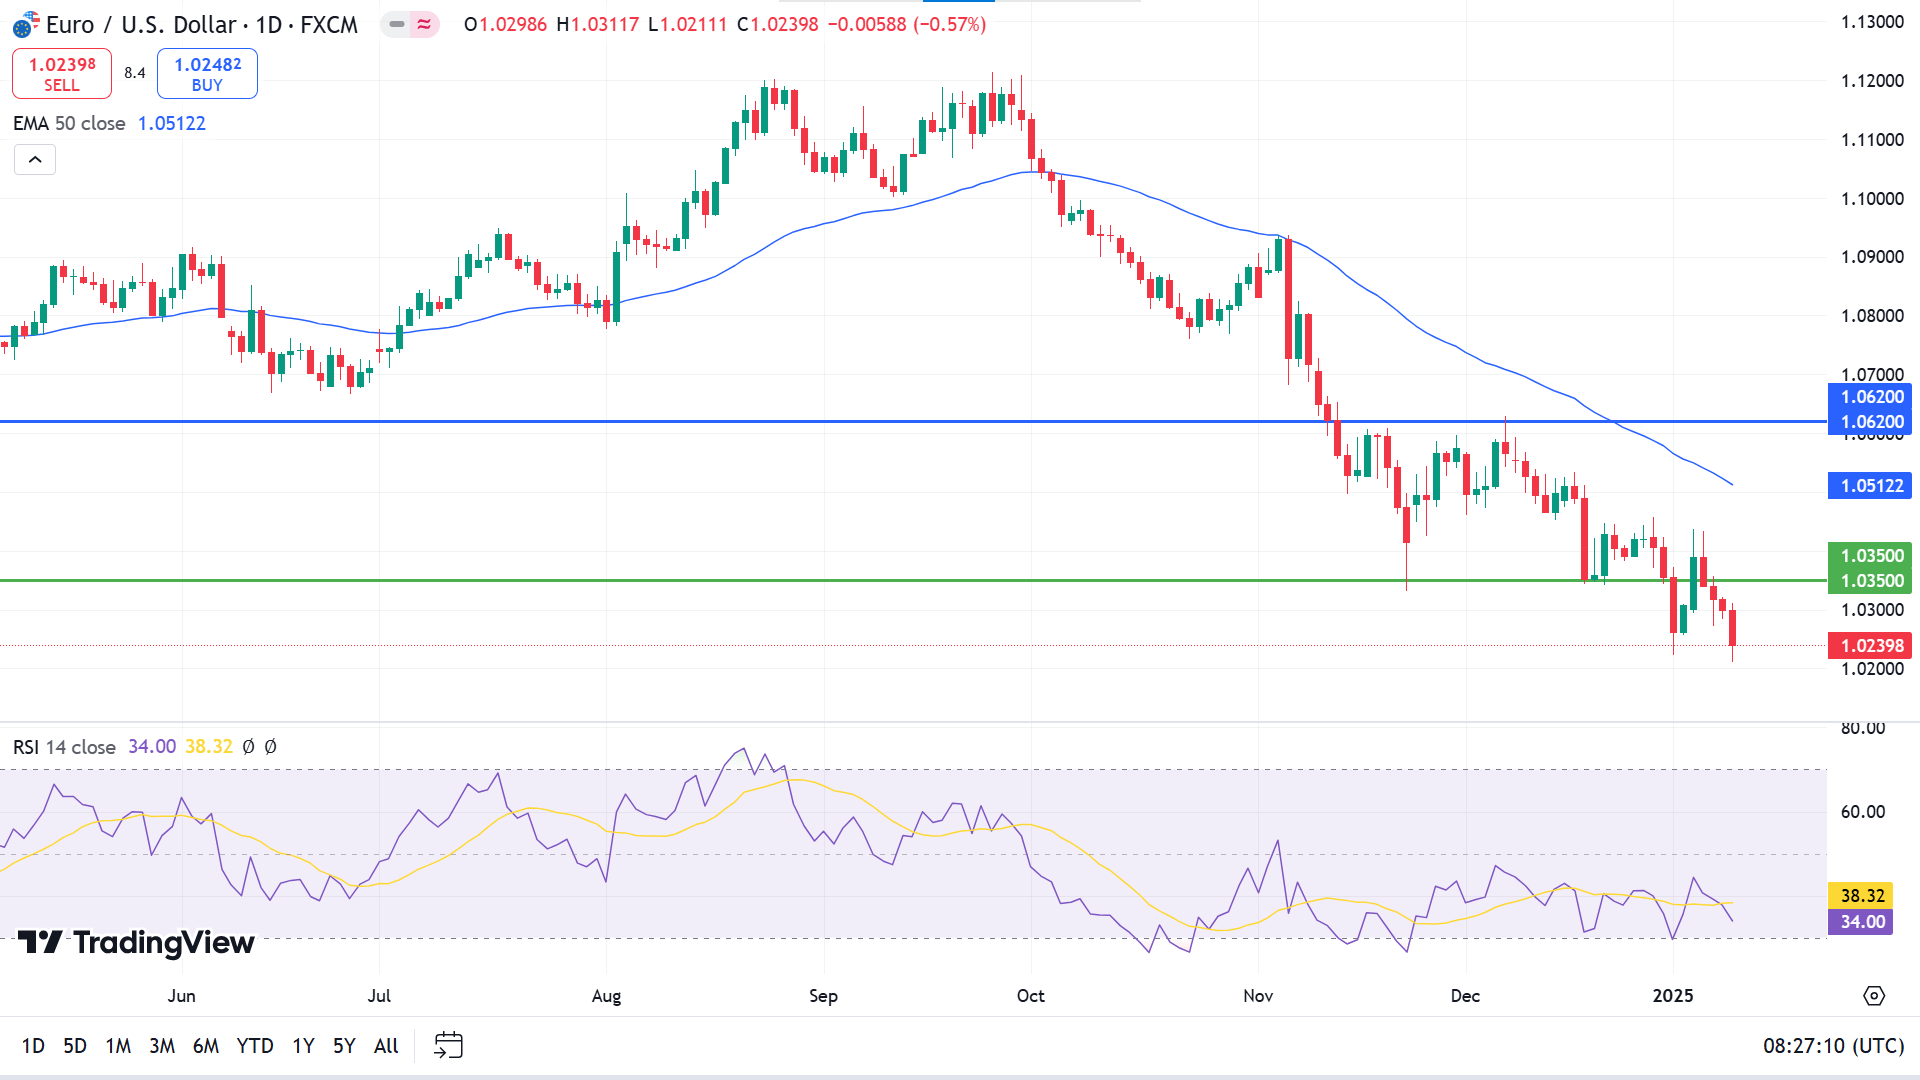
The price is on a downtrend on the daily chart as it floats below the EMA 50 line since November 2024 and breaks below the support of 1.0350. The RSI indicator reading remains neutral but supports a bearish trend, with the dynamic line hovering near the lower line of the indicator window and ending downside.
According to the current scenario, sellers remain optimistic below the 1.0350 level, which can drive the price toward historic support near 0.9955.
On the other hand, if the price surges above 1.0350, it would invalidate the bearish signal. Additionally, it might enable short-term buying opportunities toward the primary resistance near 1.0520.
GBPJPY
Fundamental Perspective
The GBPJPY pair stabilized near 194.00, driven by significant Pound Sterling (GBP) weakness. The British currency came under pressure as 30-year UK gilt yields surged past 5.4%, their highest level since 1992, reflecting heightened market concerns about the UK's economic prospects. Investor sentiment has soured due to growing fears of tight US trade policies under President-elect Donald Trump and the UK's rising debt levels.
The sharp increase in gilt yields has amplified government borrowing costs, raising concerns about potential fiscal tightening through higher taxes and reduced public spending. Chancellor of the Exchequer Jeremy Hunt has reiterated his commitment to avoiding additional borrowing for day-to-day expenses, a stance reaffirmed by Treasury Minister Darren Jones. In the House of Commons, Jones described gilt price fluctuations as typical and assured that financial markets remain stable and orderly.
Meanwhile, the Japanese Yen (JPY) strengthened on Friday amid speculation about the Bank of Japan's (BoJ) January monetary policy review. Reports from Bloomberg suggested the BoJ is considering upgrading its core-core inflation outlook for FY2024 and FY2025, citing the impact of Yen depreciation, which further supported the JPY against the GBP.
Technical Perspective
The last weekly candle ended up red, disappointing buyers, and two consecutive losing candles leave sellers optimistic for the upcoming weeks.
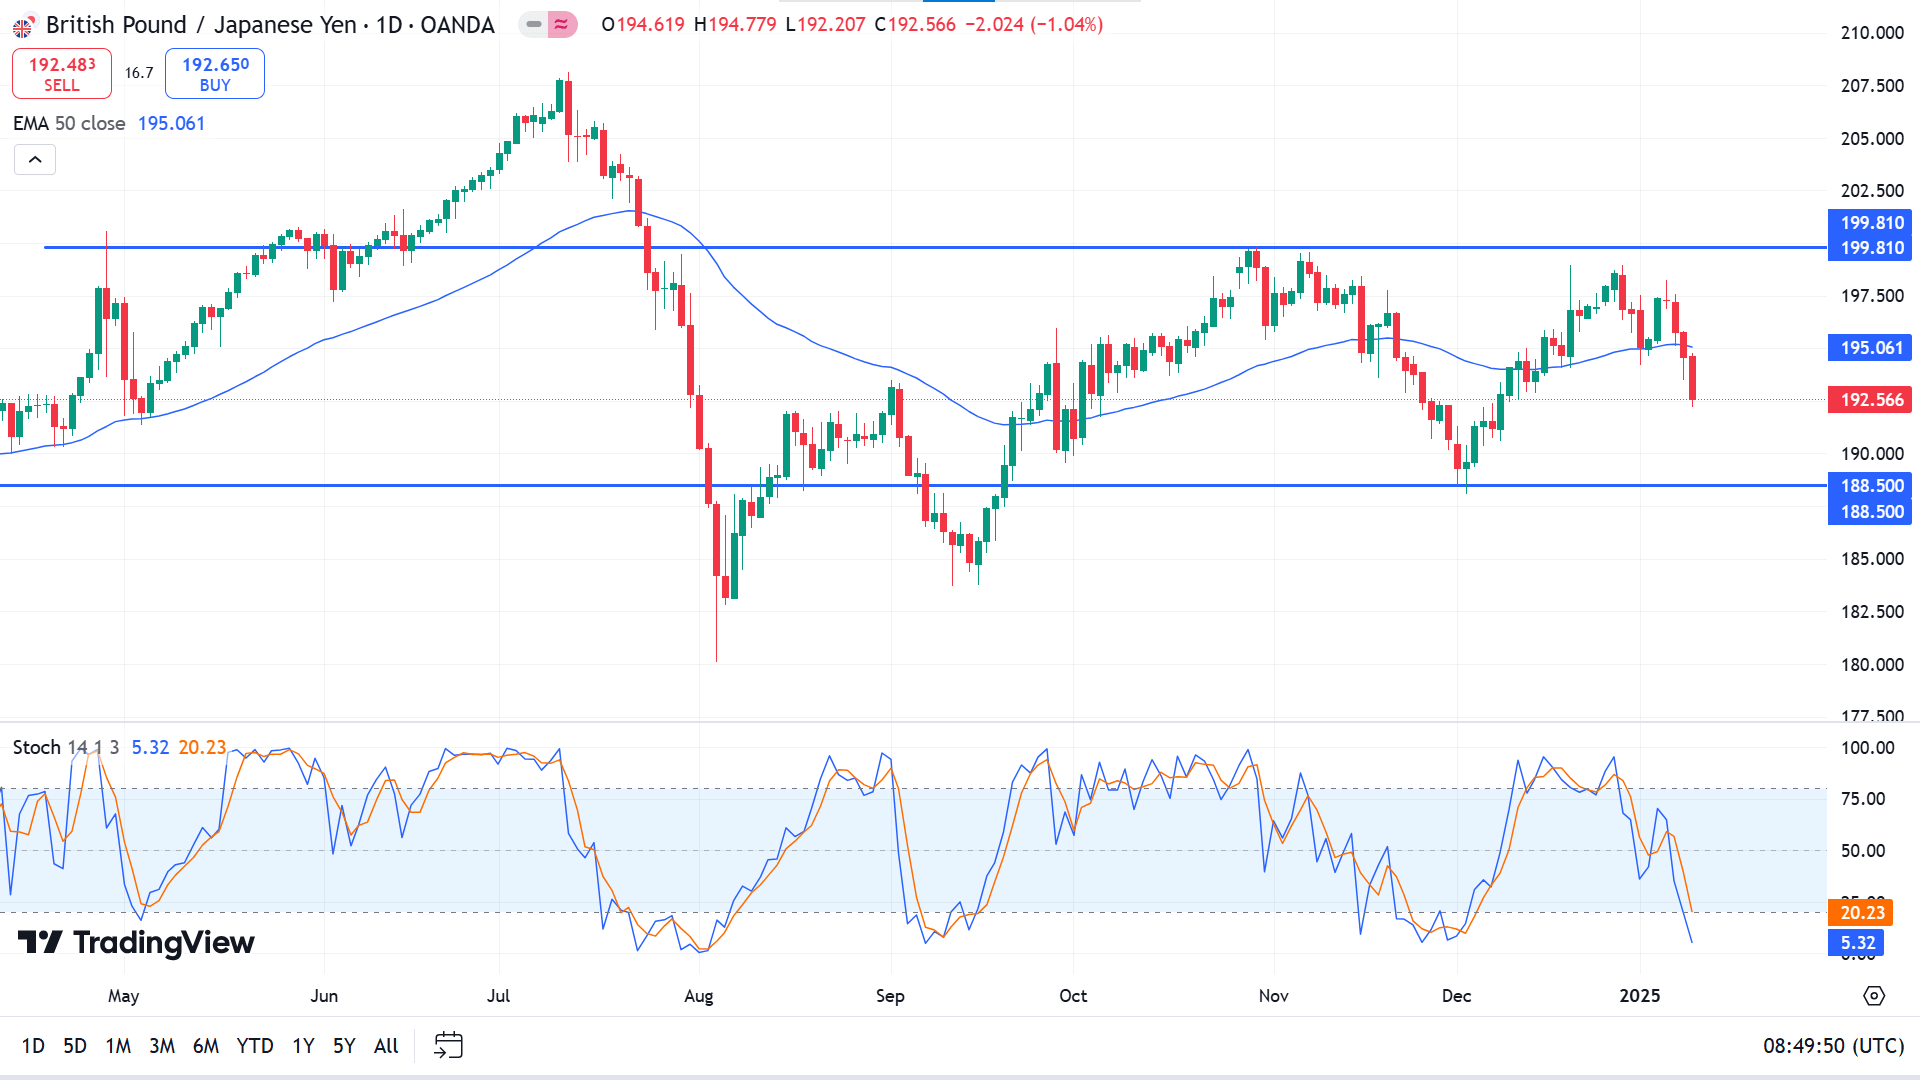
The price declines below the EMA 50 line on the daily chart, indicating recent bearish pressure. The Stochastic indicator window also supports the bearish pressure through the dynamic lines edging downside near the lower level of the indicator window.
Based on the market context, the price couldn't beat the resistance of 199.81 and declined below a key level of 196.00. So sellers are primarily observing at the neckline near 194.80 to win the primary support of 188.50.
Meanwhile, buyers are waiting for the price to hit in support of 188.50 or at least above 196.00 as it might disappoint short-term sellers and enable opening long positions toward the resistance of 199.81.
Nasdaq 100 (NAS100)
Fundamental Perspective
The Nasdaq declined 2.3% last week, while the Dow and S&P 500 lost 1.9% as investors weighed mixed economic data and corporate developments.
According to the Bureau of Labour Statistics, US nonfarm payrolls rose by a stronger-than-expected 256,000 in December, significantly exceeding the 165,000 consensus estimate. BMO highlighted the resilience of the US labour market, noting the report reinforces expectations that the Federal Reserve will keep interest rates unchanged at its January meeting while continuing efforts to curb inflation. The CME FedWatch tool indicates broad market anticipation of a monthly rate pause.
However, consumer sentiment softened in January, with the University of Michigan's Surveys of Consumers showing year-ahead inflation expectations rising to their highest level since May. The five-year inflation outlook also rose to 3.3% from 3%, marking one of the most considerable monthly changes in recent years. Meanwhile, bond yields surged, with the US two-year yield climbing 12.4 basis points to 4.39% and the 10-year yield up 8.4 basis points to 4.77%.
Bank stocks are the key focus for this week as several prominent banks like JPMorgan & Chase (JPM), Wells Fargo (WFC), and Bank Of America (BAC) are yet to release their earnings reports.
Technical Perspective
The last weekly candle ended in solid red and reached the support level, leaving investors cautious.
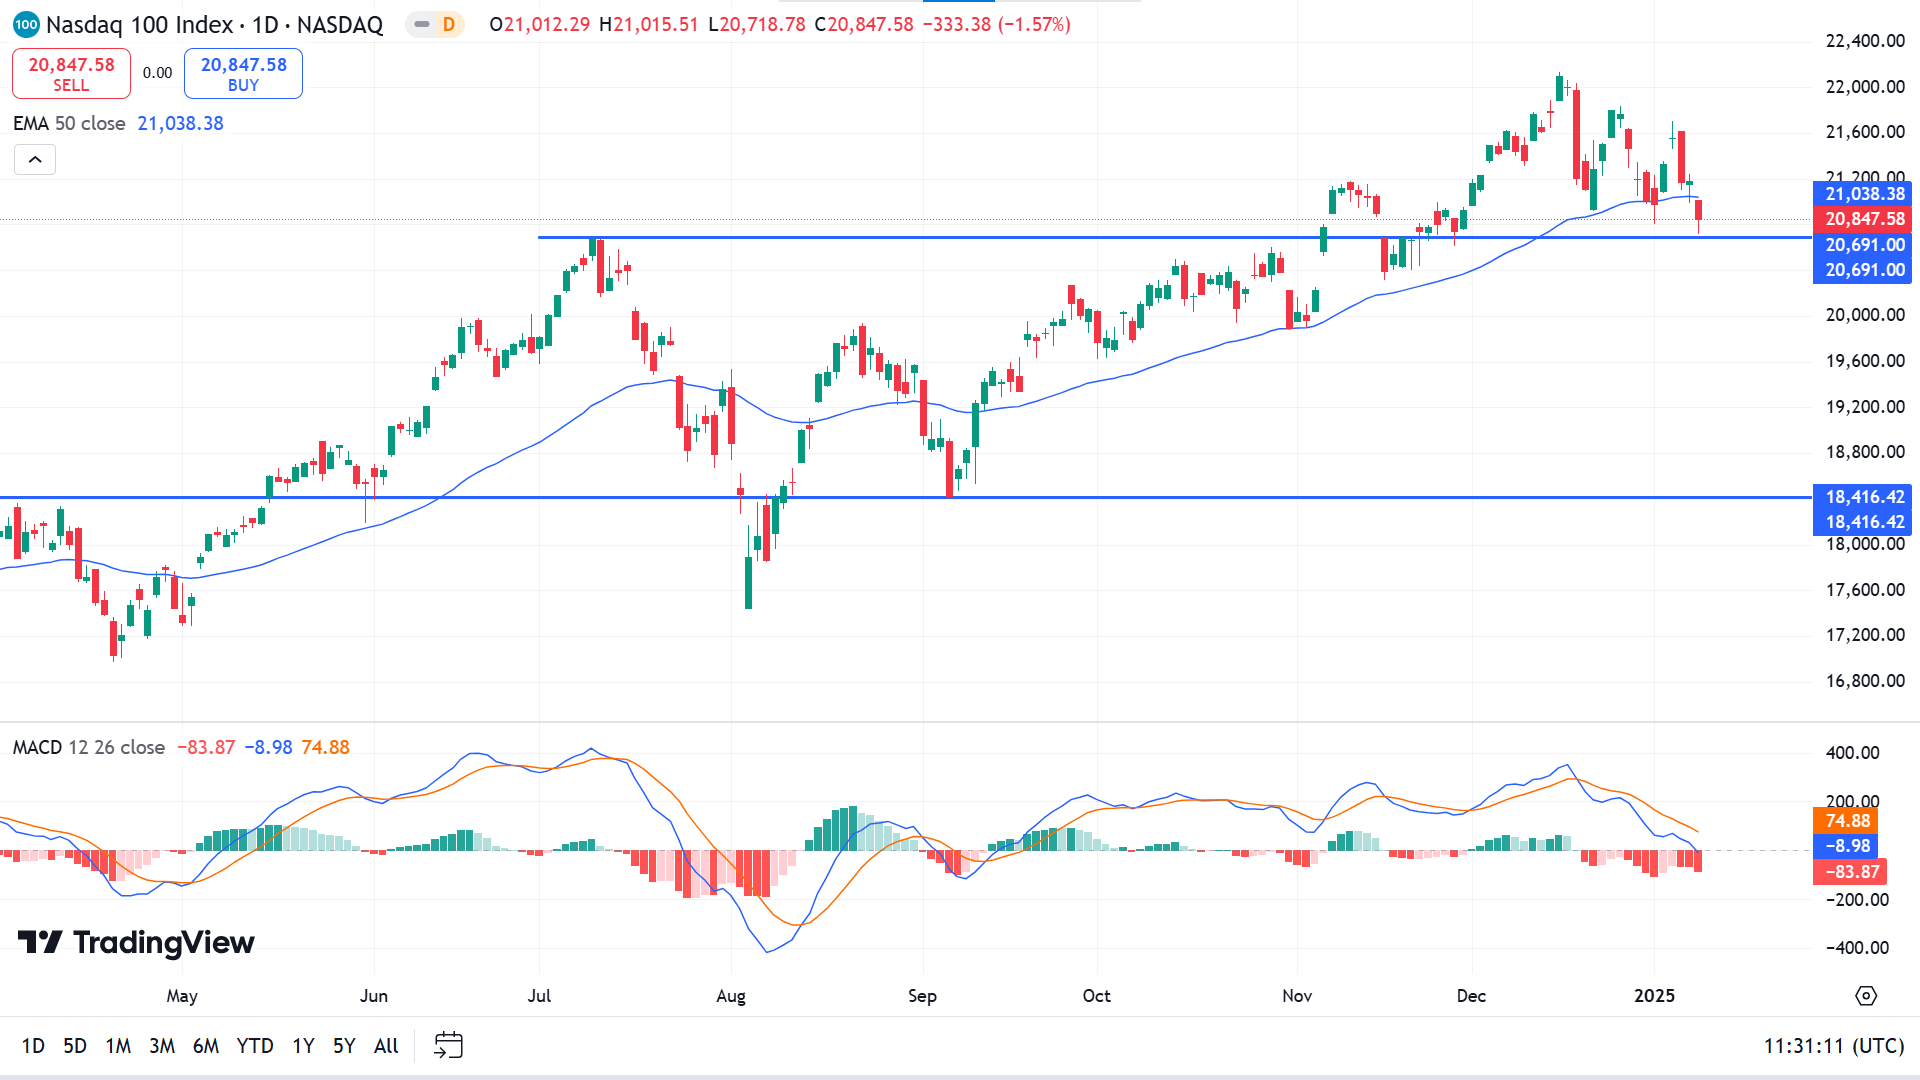
The price drops below the EMA 50 line on the daily chart, declaring recent bearish pressure, but it still holds the support of 20691.00. The MACD indicator window supports the recent bearish pressure through the dynamic lines sloping downward and red histogram bars below the midline of the indicator window.
According to this, buyers are still optimistic till the price remains above the 20691.00 support as it can beat the ATH of 22,133.22 or beyond.
On the other hand, the price drop below 20691.00 might disappoint buyers and trigger short-term selling opportunities toward 19,535.01, followed by the next support near 18,416.42.
S&P 500 (SPX500)
Fundamental Perspective
U.S. stocks fell sharply on Friday, with the S&P 500 erasing its 2025 gains after a stronger-than-expected jobs report fueled fresh inflation fears. The Labor Department revealed that job growth unexpectedly accelerated in December, while the unemployment rate dipped to 4.1%, underscoring continued resilience in the labour market.
The robust employment data heightened concerns that faster economic growth could exacerbate inflation, potentially forcing the Federal Reserve to adopt a more conservative approach to rate cuts. While traders still expect the Fed to begin lowering rates in June, further reductions this year appear less likely, according to the CME FedWatch Tool. BofA Global Research even raised the possibility of a rate hike. However, Chicago Fed President Austan Goolsbee downplayed these fears, noting no evidence of economic overheating and reaffirming expectations for eventual rate cuts.
Treasury yields added to market pressure, with the 30-year yield briefly touching 5%, its highest since November 2023, before easing slightly to 4.966%. Most S&P 500 sectors declined, except for energy, which gained 0.34%. Adding to the pessimism, the University of Michigan reported a drop in consumer sentiment to 73.2 in January.
Investors are bracing for the January 15 release of the Consumer Price Index, which could spark additional volatility if inflation surprises the upside.
Technical Perspective
The last weekly candle ended in solid red, disappointing buyers and leaving sellers optimistic as the weekly chart pattern signals a bearish continuation.
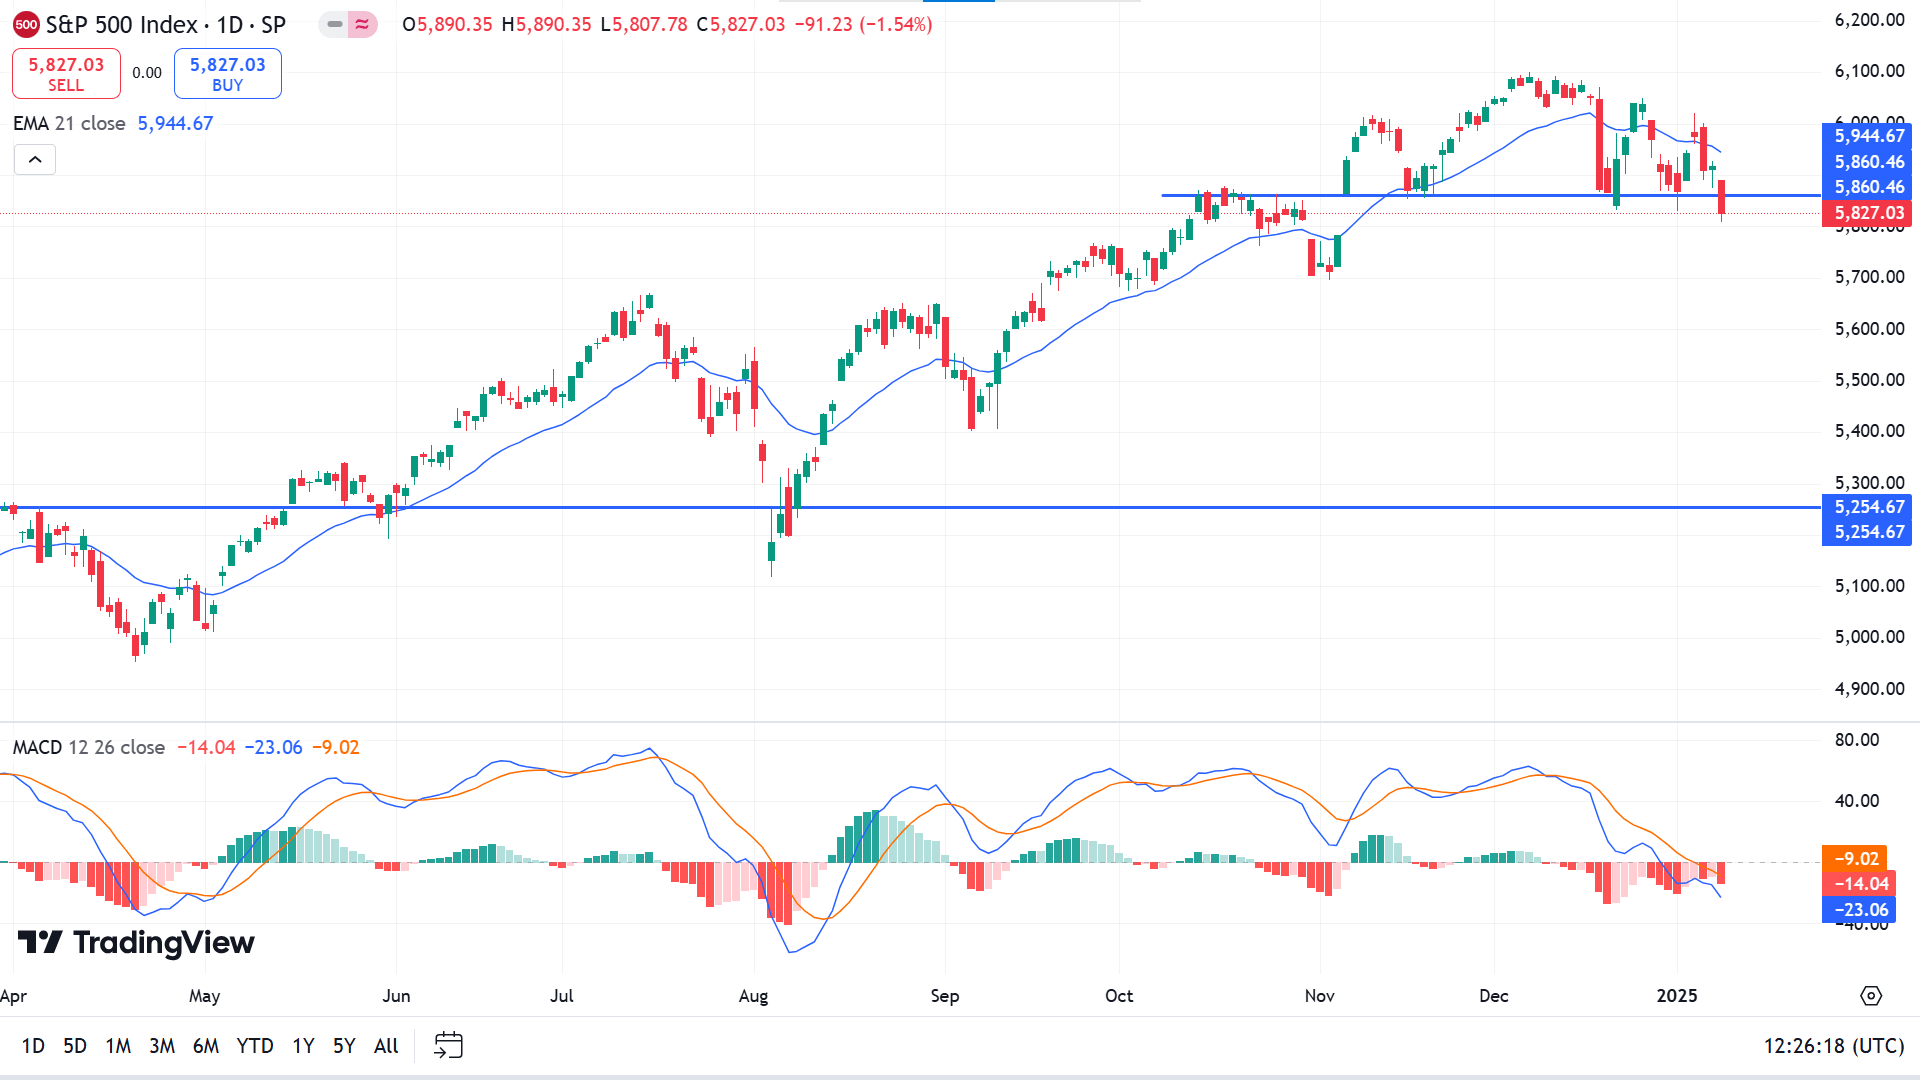
The price reaches below the temporary support of 5860.46, which defines seller domination on the asset price. The price floating below the EMA 21 line suggests sellers gained traction, while the MACD indicator window supports the downtrend.
Based on the indicator readings, the price below 5860.46 sparks short-term selling opportunities toward the nearest support near 5635.95. A break below can drive the price toward the following support near 5254.67.
On the other hand, a solid green daily candle closing above 5860.46 might invalidate the current bearish signal. Additionally, it might confirm buyer domination to beat the ATH of 6099.97.
Gold (XAUUSD)
Fundamental Perspective
Gold (XAU/USD) rebounded strongly last week, surpassing $2,680. The initial boost came from a weaker US Dollar as market sentiment improved after the holiday lull. However, Gold's gains moderated midweek amid mixed US data and speculation over President-elect Donald Trump's trade policies.
Early in the week, reports suggesting Trump's aides were considering limited tariffs eased inflation fears, driving Gold toward $2,650. Yet, Trump's dismissal of these claims reversed momentum. Strong ISM Services PMI and JOLTS Job Openings data further bolstered the USD, capping Gold's upside. On Wednesday, renewed risk aversion emerged following reports of a possible national economic emergency declaration for tariffs, strengthening the USD. Still, Gold benefited from capital outflows from the weakening British Pound.
By Thursday, limited market activity allowed Gold to climb above $2,670, while strong US Nonfarm Payrolls data on Friday briefly pressured the metal before it resumed its weekly uptrend.
Key data releases, including US inflation figures and Chinese GDP growth, will likely guide Gold's direction. Positive surprises in US or Chinese data could strengthen the USD and weigh on Gold, while weaker outcomes may extend its rally. Investors remain cautious as Trump's tariff strategy continues to unfold.
Technical Perspective
The two consecutive green candles after a doji on the weekly chart indicate a trend-changing environment, and buyers may be capturing the market traction.
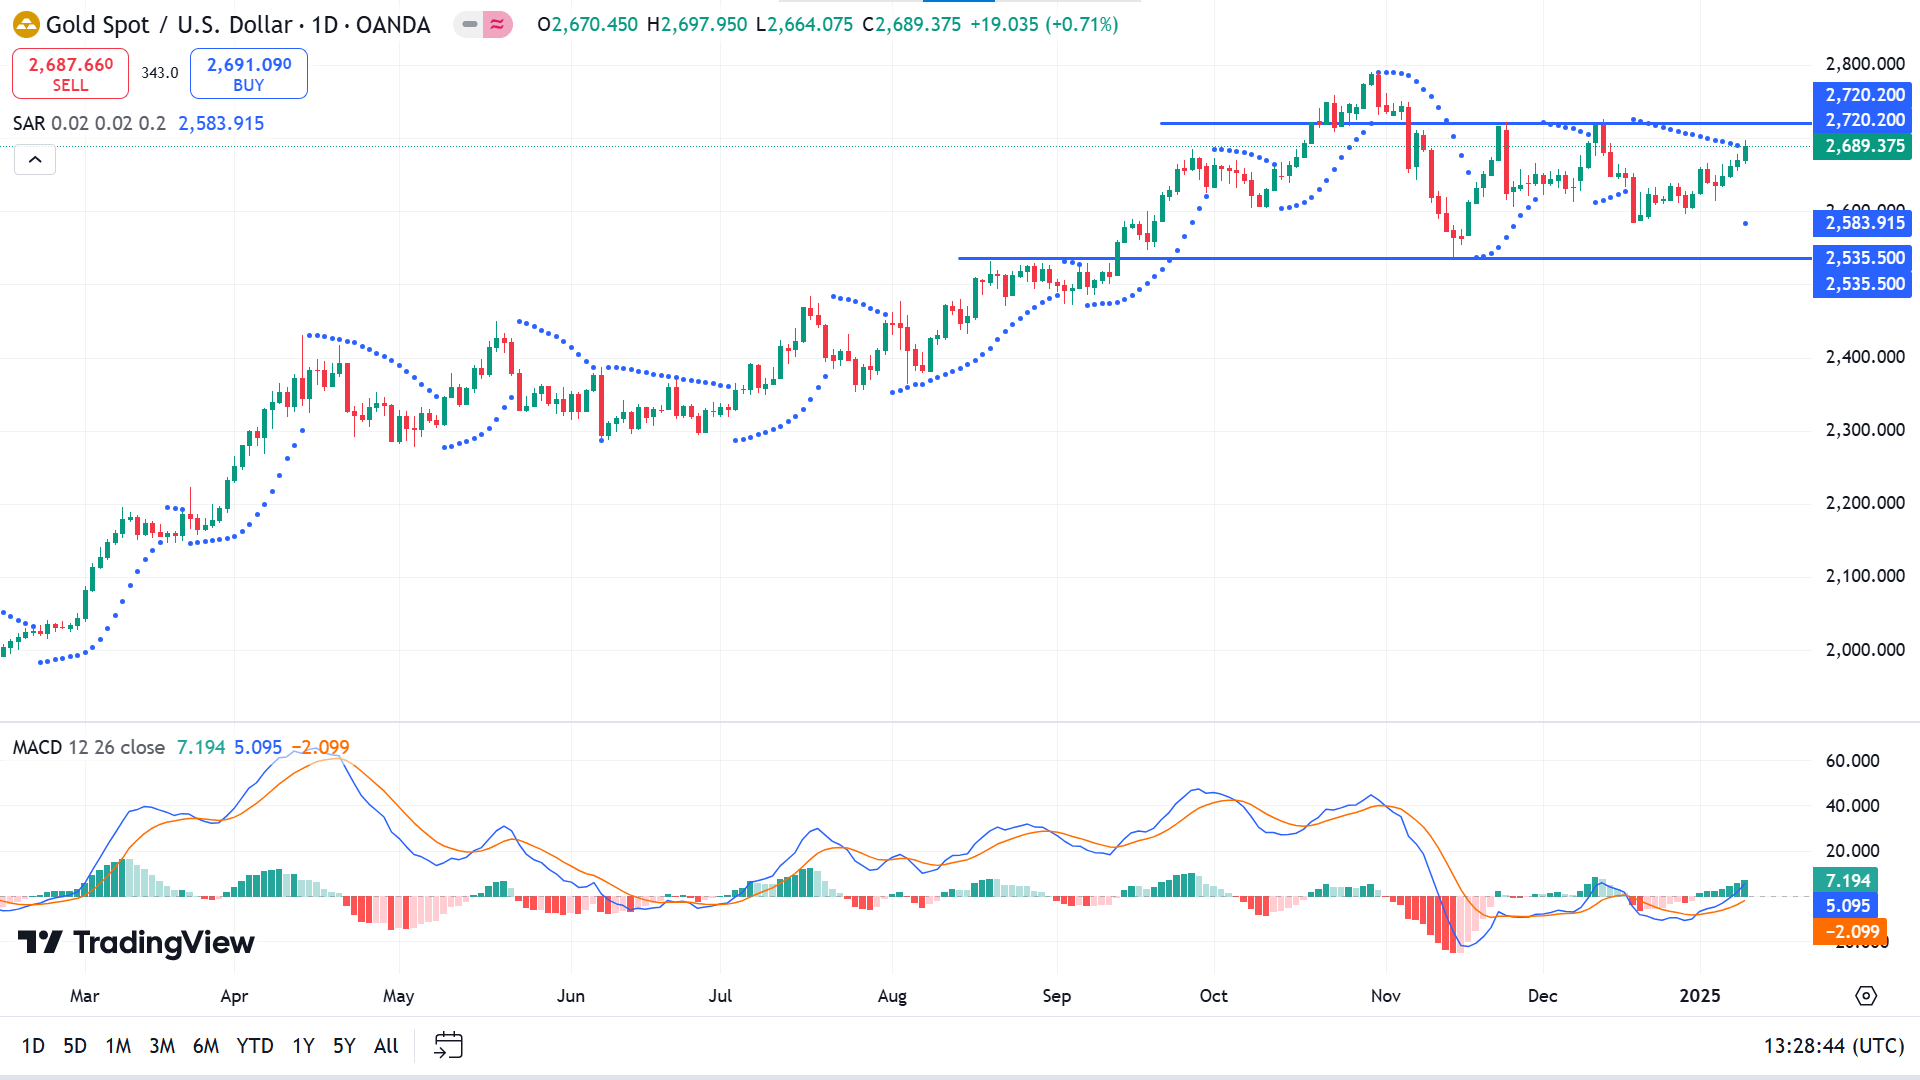
The price touches the parabolic SAR dots, reflecting the buoyant buy pressure on the asset price on the daily chart. The MACD indicator reading follows the bullish pressure through dynamic signal lines edging upside and green histogram bars above the midline.
The broader market context suggests sellers might be optimistic when the price hits the resistance of 2720.20, as it can form a triple-top pattern. If the resistance works as the bullish barrier, the price might retrace toward the support near 2628.26.
Meanwhile, A daily green candle close above 2720.20 might disappoint sellers besides enabling buying opportunities toward the ATH of 2790.17 or beyond.
Bitcoin (BTCUSD)
Fundamental Perspective
Bitcoin (BTC) recovered after a nearly 6% drop last week. US Bitcoin spot ETF data showed signs of stabilisation, recording net inflows of $462.2 million by Thursday. Bitcoin briefly reclaimed the $100K level on Monday, closing above $102K, following the announcement of Michael S. Barr's resignation as the Federal Reserve's Vice Chair for Supervision.
BTC faced a steep decline midweek, dropping to a low of $91,203 following disappointing ISM Services PMI and JOLTs data. This triggered $1.49 billion in market-wide liquidations, including $340.08 million in Bitcoin. ETF flows showed mixed signals, with $462.2 million weekly inflows but a single-day outflow of $568.8 million on Wednesday. Meanwhile, Binance's stablecoin reserves fell sharply, mirroring patterns seen before Bitcoin's May 2024 crash.
Bitcoin could see renewed optimism if January's CPI release on the 15th shows favorable inflation data, potentially fueling a rally ahead of Donald Trump's inauguration on January 20. However, traders should remain vigilant as volatility may intensify before the January 29 FOMC meeting.
Technical Perspective
The last weekly candle closes red and moves within the previous green candle's body, reflecting a consolidation.
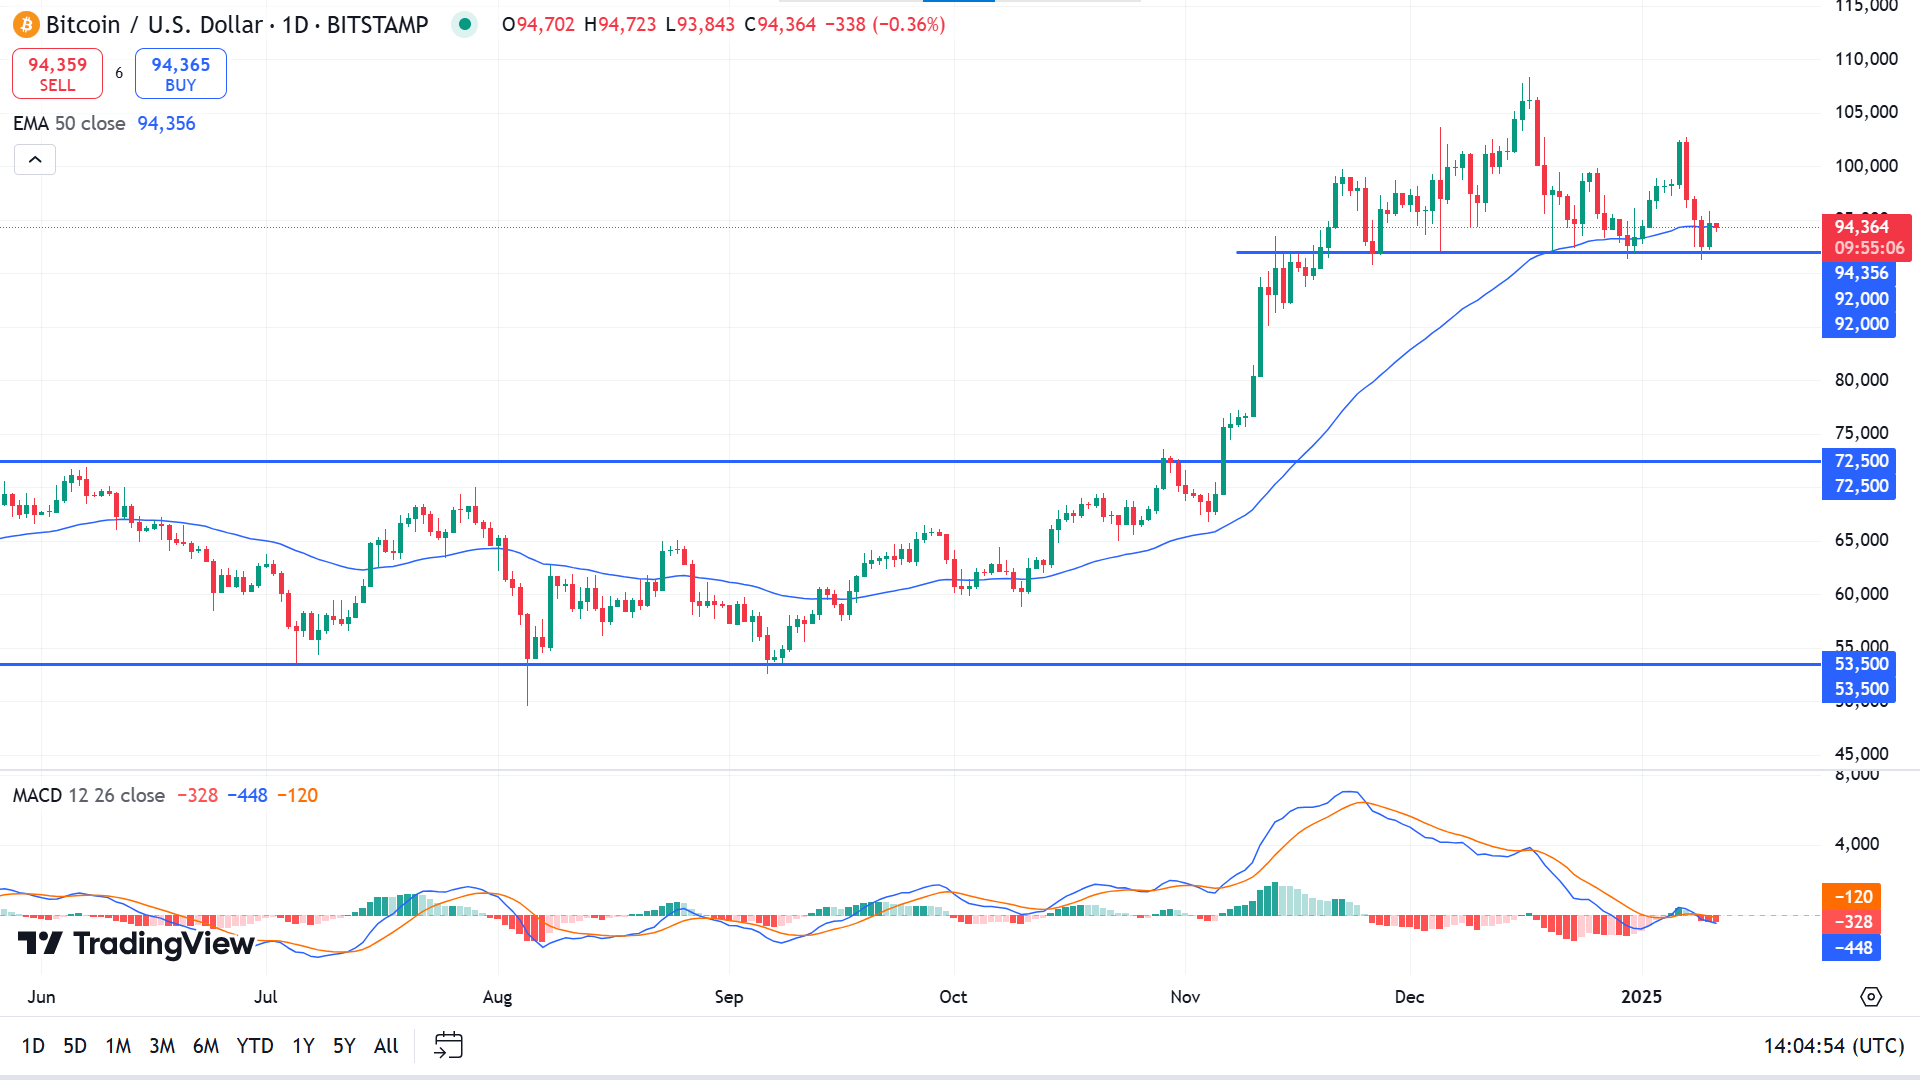
The price declined below the EMA 100 line on the daily chart but recovered, suggesting the possibility of bouncing upside. The MACD reading turned bearish, keeping buyers optimistic with the support of 92,000.00 holds.
According to the current scenario, traders might observe the 92,000.00 level as the support level has been working as a sell barrier since November. The price remains above the support and holds the possibility of regaining the ATH of 108,364.00.
Meanwhile, a daily red candle closing below 92,000.00 might invalidate the bullish signal besides sparking short-term selling opportunities toward the support near 80,399.
Ethereum (ETHUSD)
Fundamental Perspective
Ethereum (ETH) extended its downward trajectory on Thursday as long-term holders (LTHs) and large whales increased selling pressure. The bearish trend could intensify if ETH fails to reclaim the critical $3,216 support level and its momentum indicators dip below neutral.
The broader crypto market remains under pressure for the third straight day. Ethereum's Dormant Circulation, which tracks previously inactive coins, is now in motion, showing a modest uptick in its 2-year and 3-year metrics. This increase suggests heightened distribution among LTHs. Should this trend persist alongside selling by short-term holders, ETH's decline could accelerate further.
While Ethereum's LTH base remains resilient, with over 74% of total supply held long-term compared to Bitcoin's 60%, selling activity has created a divergence in supply distribution. Entities holding 10K to 100K ETH initially accumulated during the decline but shed over 190K ETH in the past 24 hours. Meanwhile, holders of 1K to 10K ETH accumulated 80K ETH, though their impact is insufficient to offset the larger cohort's selloff, keeping recovery prospects dim.
Adding to bearish sentiment, Ethereum-focused exchange-traded funds (ETFs) saw net outflows of $159.4 million, reinforcing concerns of continued downward momentum. ETH remains under pressure without renewed demand or a break above key support.
Technical Perspective
The last weekly candle closed solid red, erasing the previous two weeks' gains leaves short-term sellers optimistic.
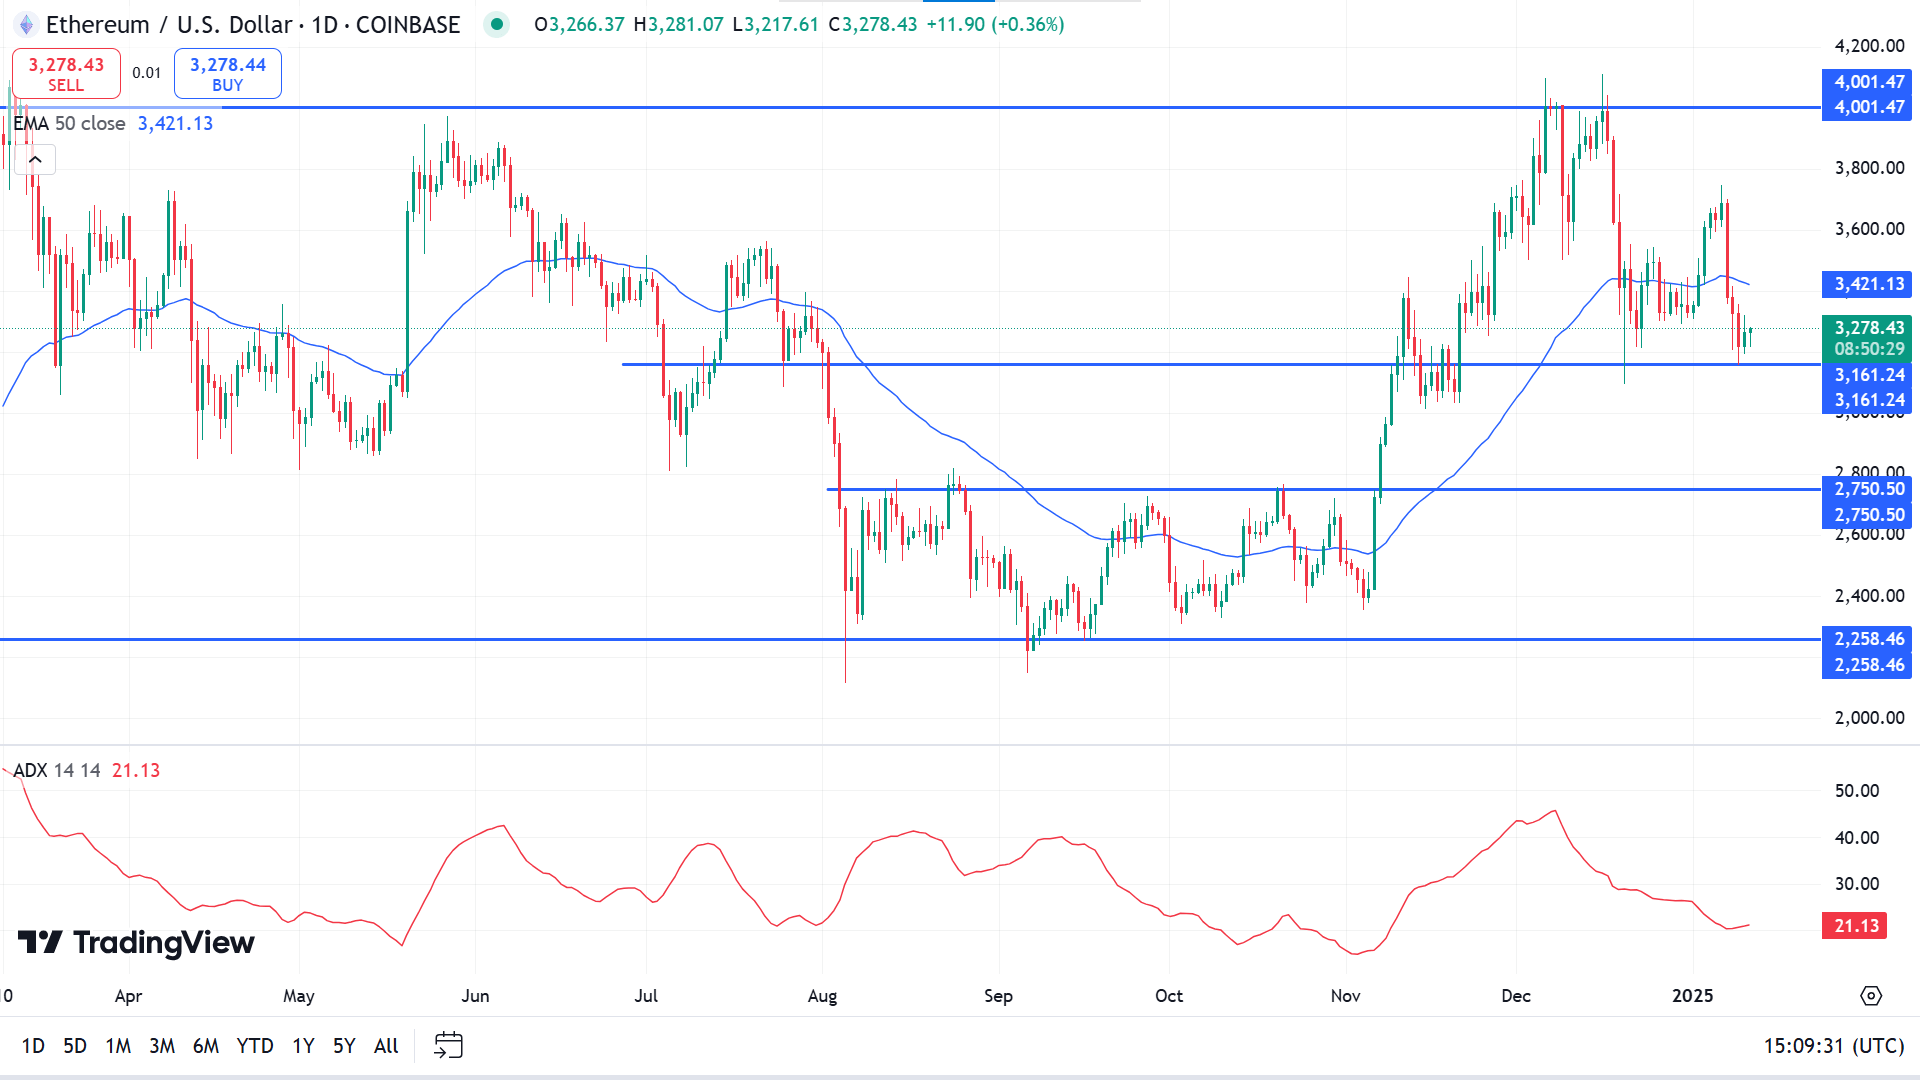
The price declines below the EMA 50 line on the daily chart, still holding the support of 3161.24. The ADX reading turns neutral while the dynamic signal line edges upwards on the indicator window, signaling current trend may be gaining traction.
According to the broader market scenario, buyers are optimistic near 3161.24, which might drive the price toward the resistance near 4001.47.
On the other hand, the current bullish signal would be invalidated if the price drops below 3161.24 and might spark short-term sellers toward the support of 2750.50.
Nvidia Stock (NVDA)
Fundamental Perspective
Nvidia (NASDAQ: NVDA) continues to dominate the AI hardware market, with its advanced GPUs serving as the backbone of high-performance computing and generative AI. The company's H200 Tensor Core GPUs, now powered by Micron's HBM3e memory, underline Nvidia's pivotal role in the AI ecosystem. Demand for Nvidia's cutting-edge chips remains insatiable, cementing its market leadership and driving a 168% surge in its stock over the past year.
While competitors like AMD are gaining traction with their Instinct GPUs and MI300X accelerators, Nvidia's well-established ecosystem and partnerships keep it ahead of the curve. Its ability to deliver innovative solutions and meet the rising demand for AI-centric products positions it as a cornerstone of the AI-driven transformation sweeping industries.
Nvidia's growth trajectory is supported by its relentless innovation and expanding applications in AI and high-performance computing. Analysts continue to view Nvidia as a cornerstone of AI advancement, with potential for sustained growth as the sector evolves. While competitors are closing the gap, Nvidia's unparalleled ecosystem ensures it remains at the forefront of AI-driven market expansion.
Technical Perspective
After reaching a new ATH on the weekly chart, the price ended near previous support. The last candle is solid red, which signals decreasing buy pressure near the peak.
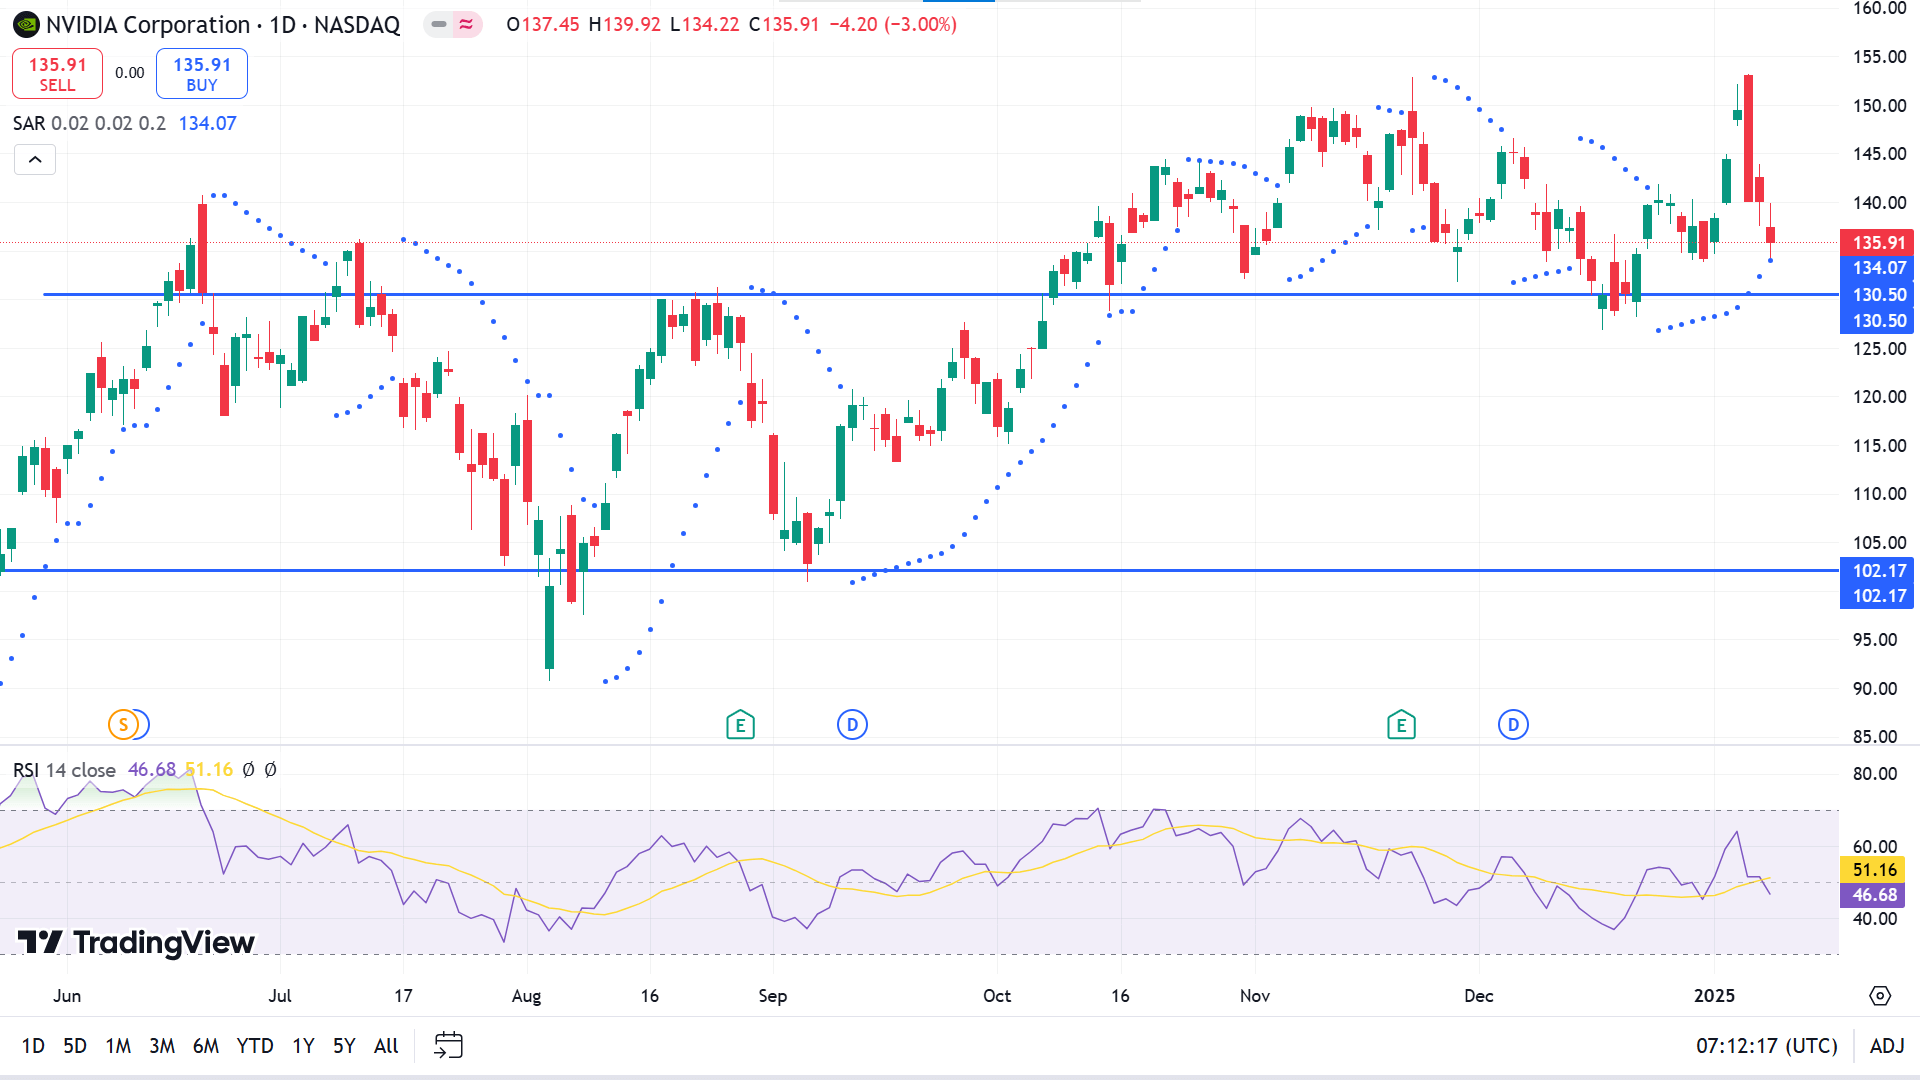
The price is floating sideways above the support of 130.50 on the daily chart. The price reaches the parabolic dot on the downside signals, reducing bullish pressure. The RSI indicator window suggests bearish pressure through the dynamic signal line sloping downside, but the reading remains neutral.
Based on the reading of the indicators, buyers are seeking adequate long positions near 130.50, which can beat the ATH of 153.13 or beyond.
On the other hand, if the price declines below 130.50, it might disappoint buyers and spark short-term selling opportunities toward the support of 115.50.
Tesla Stock (TSLA)
Fundamental Perspective
Tesla (TSLA) introduced the revamped Model Y, "Juniper," in China. This refreshed version showcases significant updates to the front and rear designs alongside a slightly extended driving range. Prices for the new Model Y have increased by up to 5% compared to the earlier version. Deliveries are expected to start in March, subject to regulatory approval in China, with launches in Europe and the U.S. likely to follow soon. Customers placing orders before February 28 will benefit from an extended warranty of two years or 25,000 miles.
In the U.S., the National Highway Traffic Safety Administration (NHTSA) has opened an investigation into Tesla's "Actually Smart Summon" feature after multiple reports of crashes during its operation. The system failed to detect obstacles such as posts or parked vehicles, resulting in four documented incidents. Federal regulators review these cases to assess the feature's safety and reliability.
On Tuesday, Bank of America analyst John Murphy downgraded Tesla to neutral from buy, raising the price target to $490 from $400. Murphy noted improved investor sentiment and recognition of growth drivers but highlighted significant execution risks. With Tesla's stock already reflecting much of its potential across core vehicles, energy storage, and future technologies like robotaxis and Optimus, the analyst suggested the current valuation limits upside potential. TSLA shares declined Friday.
Technical Perspective
Two consecutive red candles after a doji near the peak on the weekly chart suggest seller domination remains intact on the asset, leaving sellers optimistic.
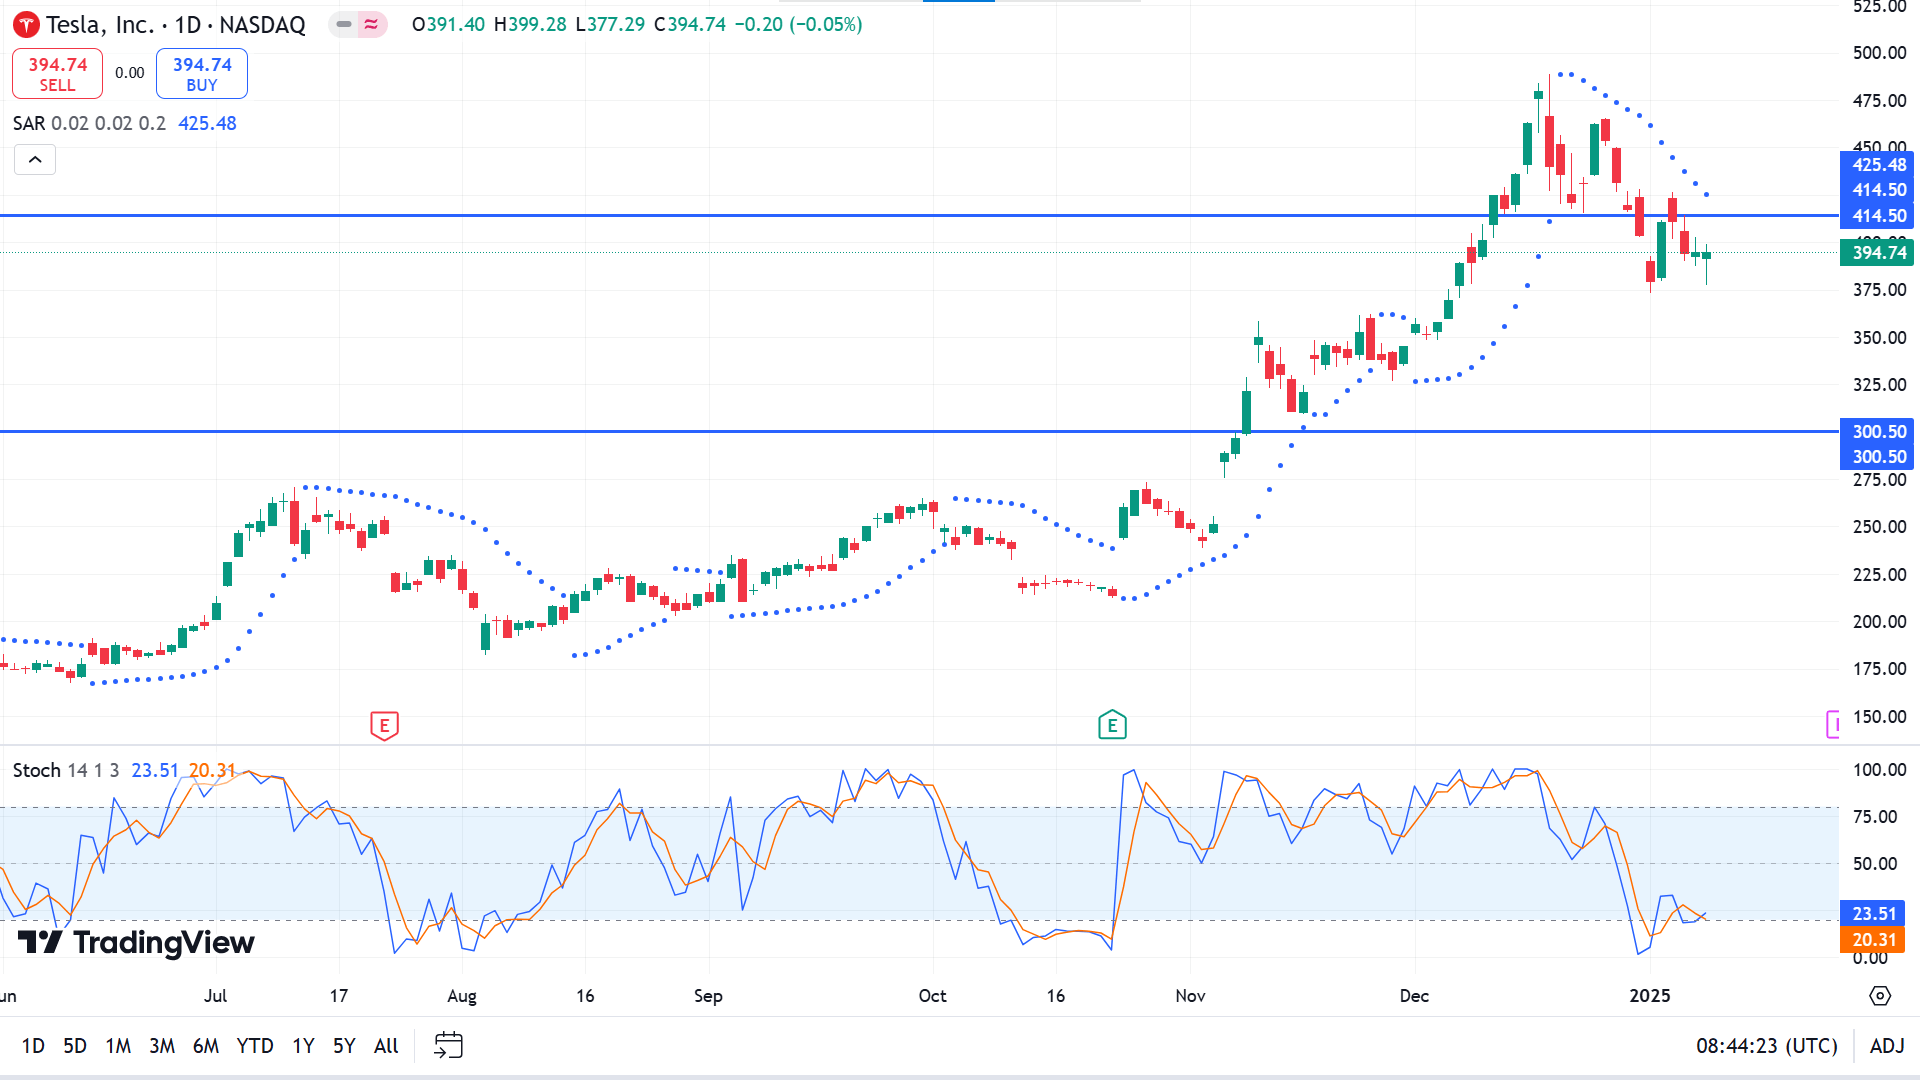
The parabolic SAR creates dots above the price candle, indicating a short-term bearish trend on the daily chart. The Stochastic indicator reading remains neutral but supports the beamish trend through the dynamic lines floating near the lower line of the indicator window.
According to the current market context, the price remains below 414.50, leaving sellers optimistic toward the previous support near 300.50.
Meanwhile, a daily green candle closing above 414.50 might invalidate the current bearish signal and spark optimism that the price might beat the ATH of 488.54.
WTI Crude Oil (USOUSD)
Fundamental Perspective
West Texas Intermediate (WTI) crude oil extended its upward momentum for a second consecutive session, trading near $73.90 per barrel on Friday during European hours. Expectations of rising heating fuel demand primarily drive the price increase as extended cold weather grips much of the Northern Hemisphere.
The U.S. Weather Bureau forecasts below-average temperatures for central and eastern regions of the country, while Europe faces an unusually harsh winter. As reported by Reuters, JP Morgan analysts link the price surge to concerns over supply disruptions caused by stricter sanctions, low oil inventories, and freezing conditions in key markets.
Geopolitical tensions further support crude prices. President Joe Biden is set to introduce new sanctions targeting Russia's oil revenue to bolster Ukraine's resistance before President-elect Donald Trump assumes office on January 20. Meanwhile, uncertainty over Trump's potential hardline stance on Iran adds to the upward pressure, ING analysts noted.
Additionally, Asian buyers are shifting toward alternative Middle Eastern grades as broader sanctions on Russia and Iran disrupt oil trade flows. These factors collectively contribute to heightened market volatility and bolster crude oil prices.
Technical Perspective
Three consecutive gaining candles on the weekly chart declare active bullish pressure on the asset and leave buyers optimistic.
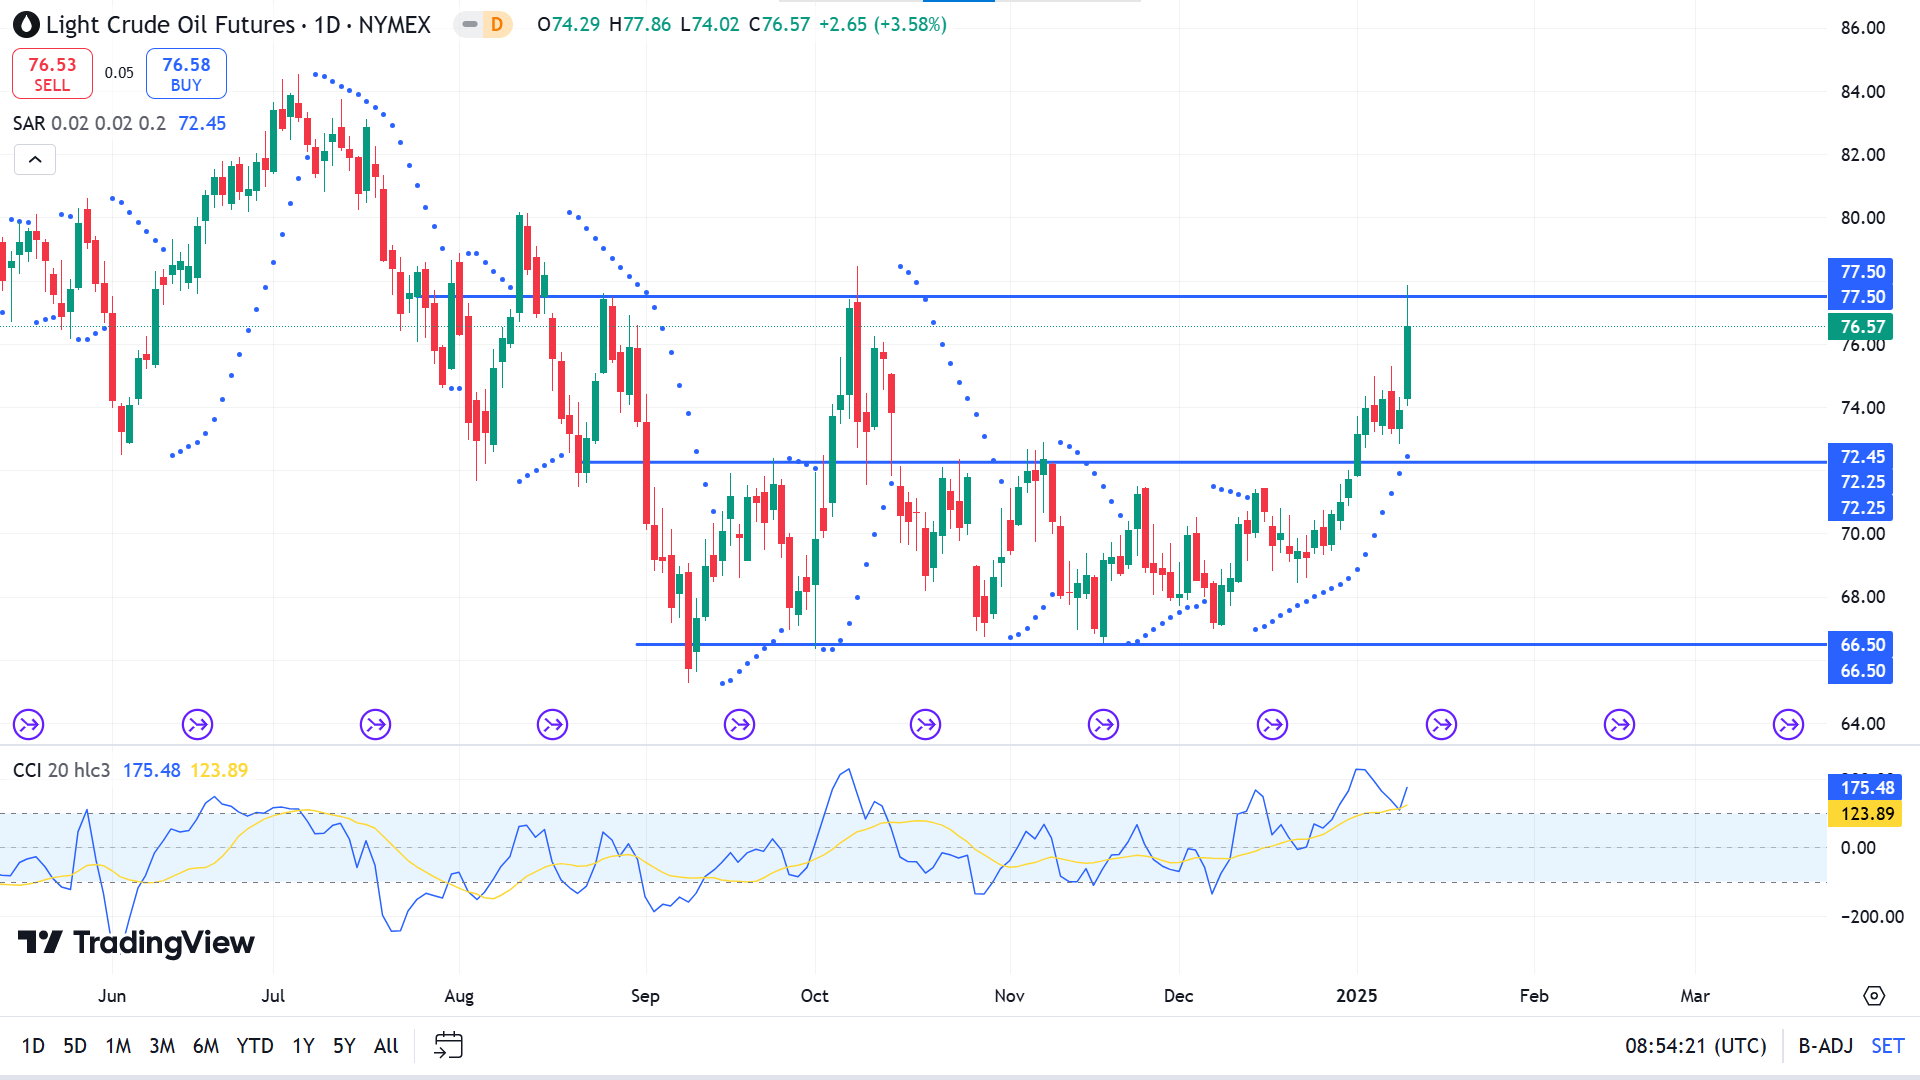
The price reached an acceptable resistance on the daily chart, but the Parabolic SAR continues creating dots below price candles, suggesting a bullish trend. The CCI reading remains neutral, with the dynamic line floating above the upper line of the indicator window edging upside, supporting a bullish trend.
The broader market context suggests that price action traders may seek to open elegant short positions near the 77.50 resistance, as it previously worked as a buy barrier. If the resistance is sustained, the price can decline toward the primary support at around 72.25.
On the other hand, the bearish signal would be invalidated if the price continued to surge above the resistance of 77.50. Additionally, it might enable buying opportunities toward the next resistance near 84.32.


