


EURUSD
Fundamental Perspective
The EURUSD pair fluctuated considerably last week, initially falling to a three-week low of 1.0776 on Thursday but rebounding to close above 1.0900. The week was marked by significant developments, with speculation mounting that the Federal Reserve (Fed) might aggressively trim interest rates amidst tepid U.S. data and rising recession fears.
In the Eurozone, mid-week optimism was dampened by disappointing local data. The Hamburg Commercial Bank (HCOB) Manufacturing PMI for July remained at a weak 45.8, mirroring June's reading and indicating ongoing sectoral struggles. Germany reported a 0.1% contraction in GDP for Q2, though the broader EU economy grew by 0.3%, slightly exceeding expectations. Additionally, preliminary estimates showed Germany's annual Harmonized Index of Consumer Prices (HICP) at 2.6%, which is above forecasts, while the EU's core annual HICP rose to 2.9%.
The Fed's latest statement acknowledged moderating job gains and described inflation as "somewhat elevated." Fed Chair Jerome Powell suggested a potential rate cut in September if current economic trends persist, leading markets to price in at least two rate cuts by year-end and possibly three in 2024. Despite these signals, Powell emphasized that future monetary policy decisions would remain data-dependent. This nuanced stance contributed to the U.S. Dollar's selling pressure, allowing the Euro to regain some strength by the week's end.
Technical Perspective
The last weekly candle finished with a green body and long upper wick, recovering losses from the previous week. It reflects an increased bullish pressure and suggests that the next candle might be another green one.
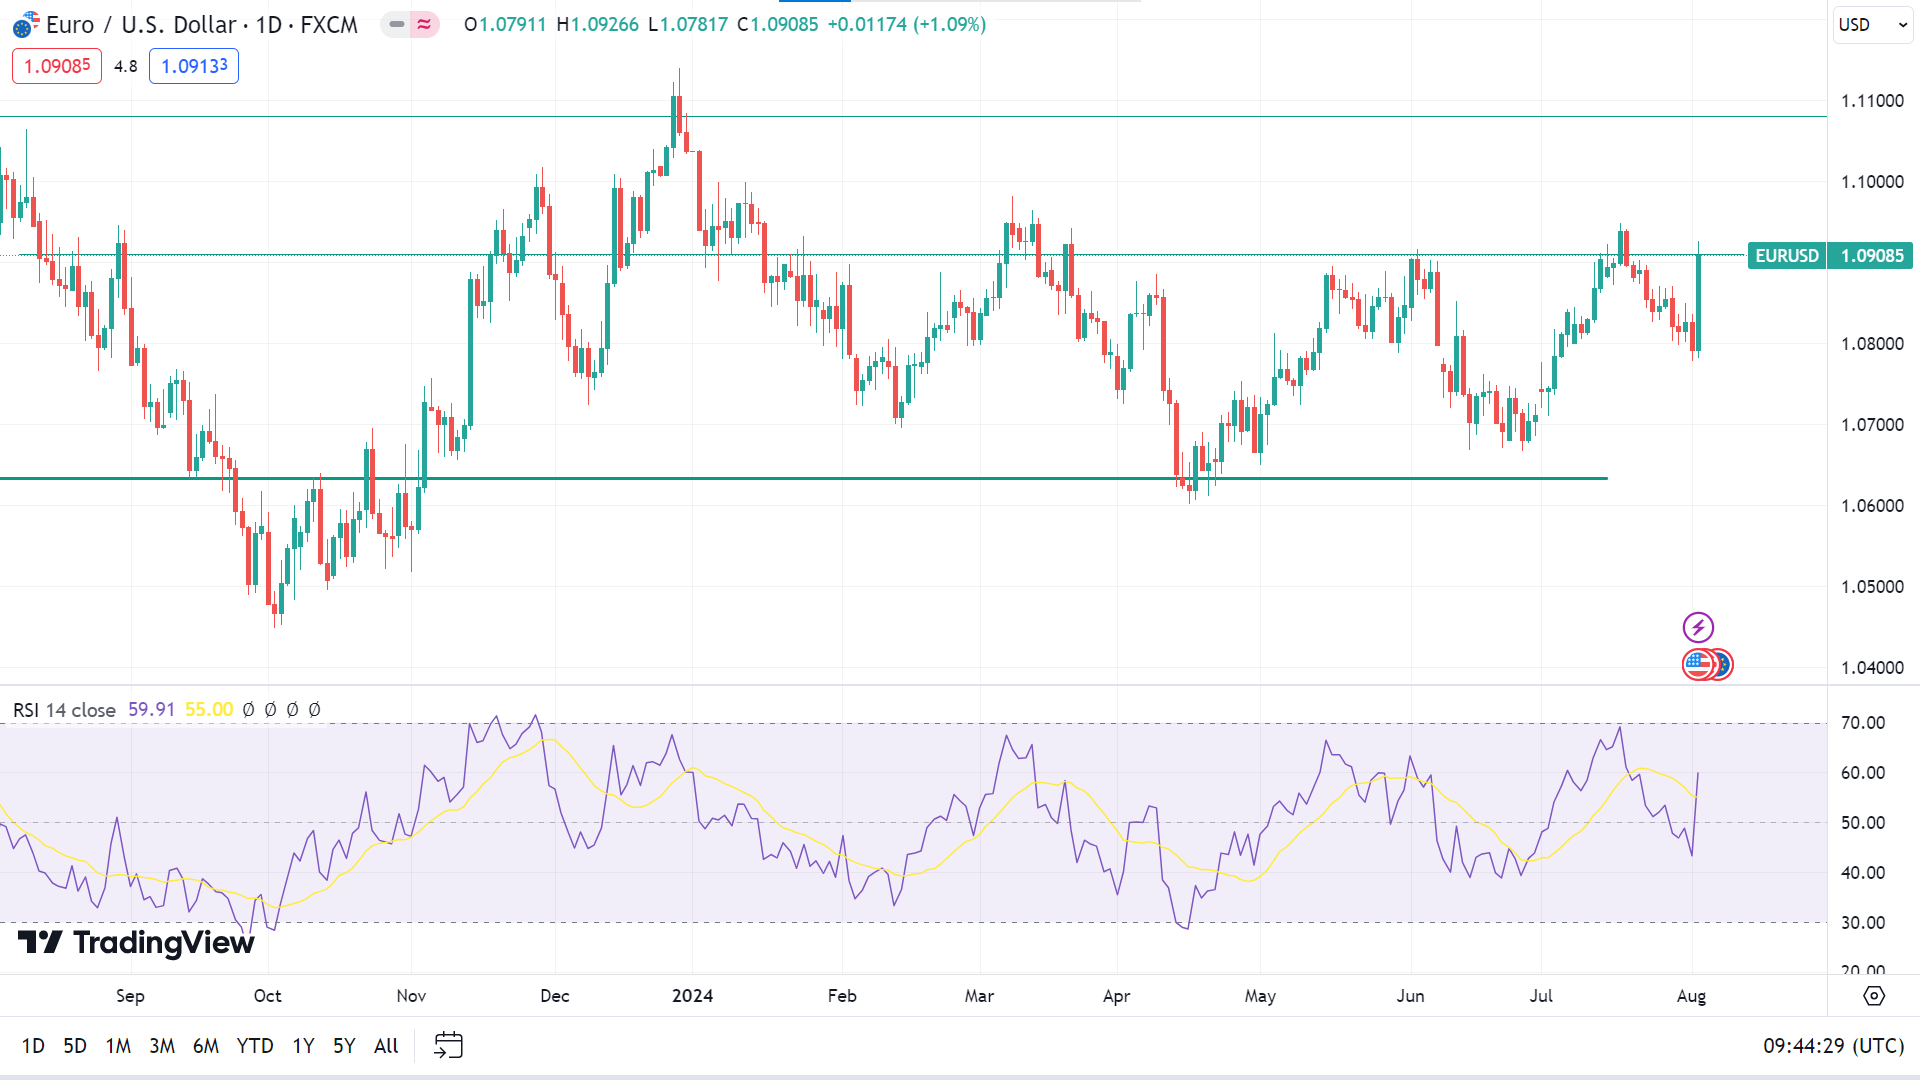
The RSI indicator reading remains neutral in the daily chart as the indicator line slopes upside above the midline, declaring a positive force on the asset price. So, the price may head toward the nearest resistance of 1.0980, and any breakout can trigger the price toward the next resistance, which is near 1.1100.
Meanwhile, the price is floating just below a previous resistance, so a retracement is possible. On the downside, primary support is near the 1.0790 level, followed by the next support near 1.0666.
GBPJPY
Fundamental Perspective
The Bank of England (BoE) reduced its key policy rate by 25 basis points to 5.0% with a narrow 5-4 vote. Governor Andrew Bailey emphasized that the Monetary Policy Committee (MPC) would proceed cautiously.
Meanwhile, the Japanese Yen (JPY) strengthened after the Bank of Japan (BoJ) raised its policy rate to a 16-year high of 0.25%. This decision, alongside signals that further rate hikes may follow if the economy requires, has supported the JPY. Market expectations now include two additional rate increases before the fiscal year ends in March 2025, with the next hike anticipated in December. This outlook may constrain the GBPJPY pair's upside potential.
Technical Perspective
The last weekly candle closed solid red, posting four consecutive losing weeks, leaving optimism for sellers for the next week.
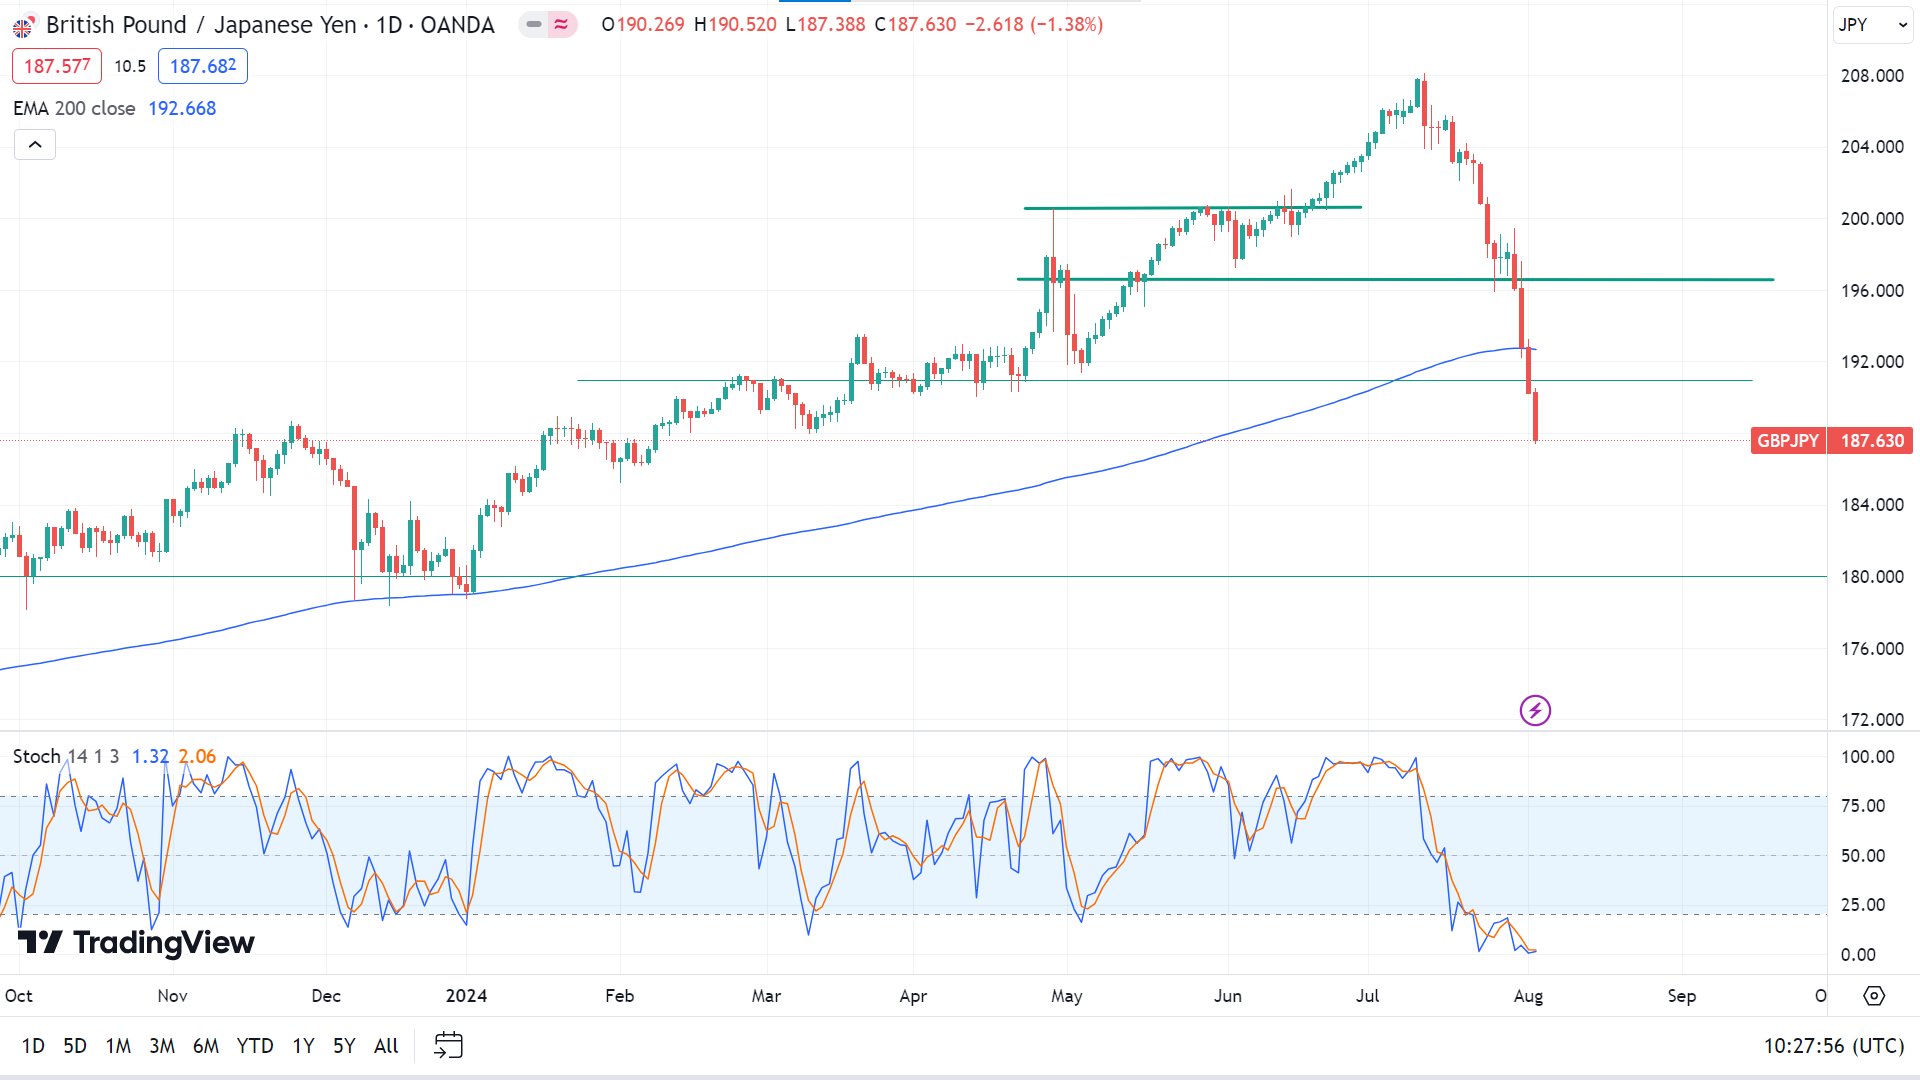
On the daily chart, the price reaches below the EMA 200 line, while stochastic signal lines are below the lower line on the indicator window, reflecting the bearish pressure on the asset price. So, the price may head toward the nearest support, 184.03, followed by the next support near 180.00.
Meanwhile, a retracement upside is anticipated as the Stochastic signal lines float below the lower line. So, the price can hit the primary resistance of 190.98 before declining further. At the same time, any breakout can trigger the price toward the next resistance, which is near 196.50.
Nasdaq 100 (NAS100)
Fundamental Perspective
Concerns over tech earnings and a slowing U.S. economy weighed heavily on the Nasdaq Composite index on Friday, pushing it 10% below its record high and confirming its entry into correction territory. The tech-heavy index fell 2.4% after a softer-than-expected jobs report heightened fears that the Federal Reserve might need to implement significant interest rate cuts to stave off a recession—disappointing earnings reports from Amazon and Intel further unsettled investors.
The Nasdaq has dropped 10% from its July 10 peak of 18,647.45 points. An index is typically considered in correction when it declines 10% or more from its previous record high.
This decline highlights increasing investor wariness towards highly valued tech stocks, which have fueled much of the market's gains this year, driven by enthusiasm for artificial intelligence. Additionally, stocks are entering a traditionally volatile period. September and October are known for market instability, with the Cboe Volatility Index—Wall Street's primary gauge of investor anxiety—averaging 21.8 in October, the highest for any month since 1992, according to LSEG data. This seasonal volatility further exacerbates investor concerns, contributing to the Nasdaq's recent downturn.
From the economic calendar, some crucial releases for this week are Walt Disney Company (DIS), Caterpillar Inc (CAT), Uber Technologies (UBER) and AMGEN Inc (AMGN).
Technical Perspective
The last weekly candle closed as a solid red candle, posting four consecutive weeks of loss, leaving optimism for buyers for the upcoming week.
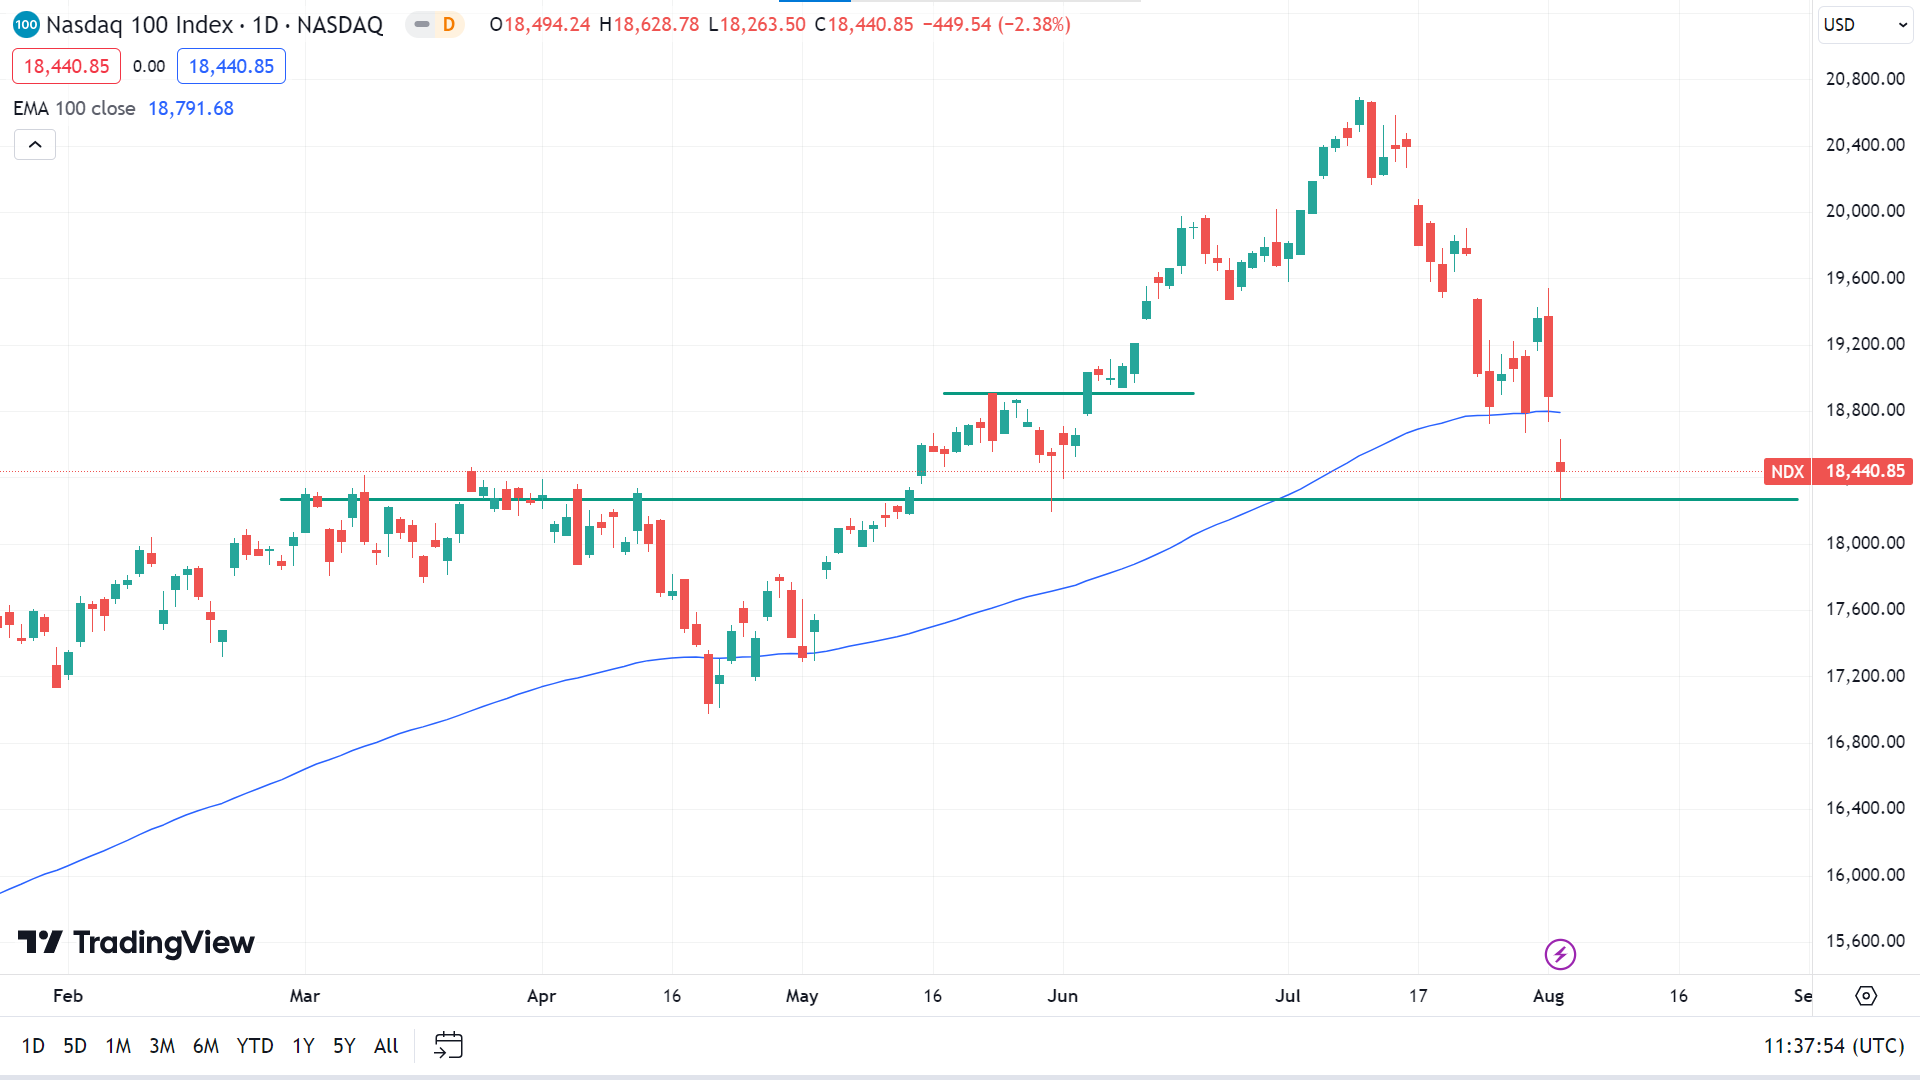
On the daily chart, the price drops below the EMA 100 line at an adequate previous support level near 18,270.00. The recent bearish pressure can send the price toward the nearest support of 17,804.32, followed by the next support near 17,083.48.
Meanwhile, as the price is currently floating at a previous support level, buyers may see it as an adequate level for buying, which can trigger the price to reach above the current resistance near 18,800, and any breakout may force the price toward the next resistance near 19,494.45.
S&P 500 (SPX500)
Fundamental Perspective
The Standard and Poor's 500 declined for a third consecutive week, impacted by disappointing jobs data and weak financial results in the technology sector. The benchmark index closed Friday's session at 5,346.56, down from last week's close of 5,459.10. Both consumer discretionary and tech sectors fell over 4%, with energy, financials, industrials, and materials also posting losses. In contrast, utilities led the gainers with a 4.3% increase, while real estate, communication services, consumer staples, and healthcare sectors also saw gains.
The U.S. economy added 114,000 jobs last month, significantly below Bloomberg's forecast of 175,000. June payrolls were revised to 179,000 and May's to 216,000, resulting in a net downward revision of 29,000 jobs. Additionally, the unemployment rate rose to 4.3% in July from 4.1%, defying analysts' expectations of stability.
Earlier in the week, data revealed continued contraction in the U.S. manufacturing sector amid weak demand, with weekly unemployment insurance applications hitting their highest level in nearly a year. On Wednesday, the Federal Reserve's monetary policy committee maintained interest rates at 5.25% to 5.50% for the eighth consecutive meeting. Fed Chair Jerome Powell suggested a possible rate cut in September, contingent on future economic data.
The tech sector was particularly affected, with Intel's shares plunging nearly 32% following a disappointing Q2 financial report and a $10 billion cost-cutting plan. Qualcomm fell 12% after the U.S. revoked its export license to Huawei, and Microsoft's cloud revenue missed estimates. Amazon also reported lower-than-expected Q2 revenue.
Technical Perspective
The last candle finished solid red due to recent selling pressure, posting three consecutive losing weeks, leaving room for sellers for the next week.
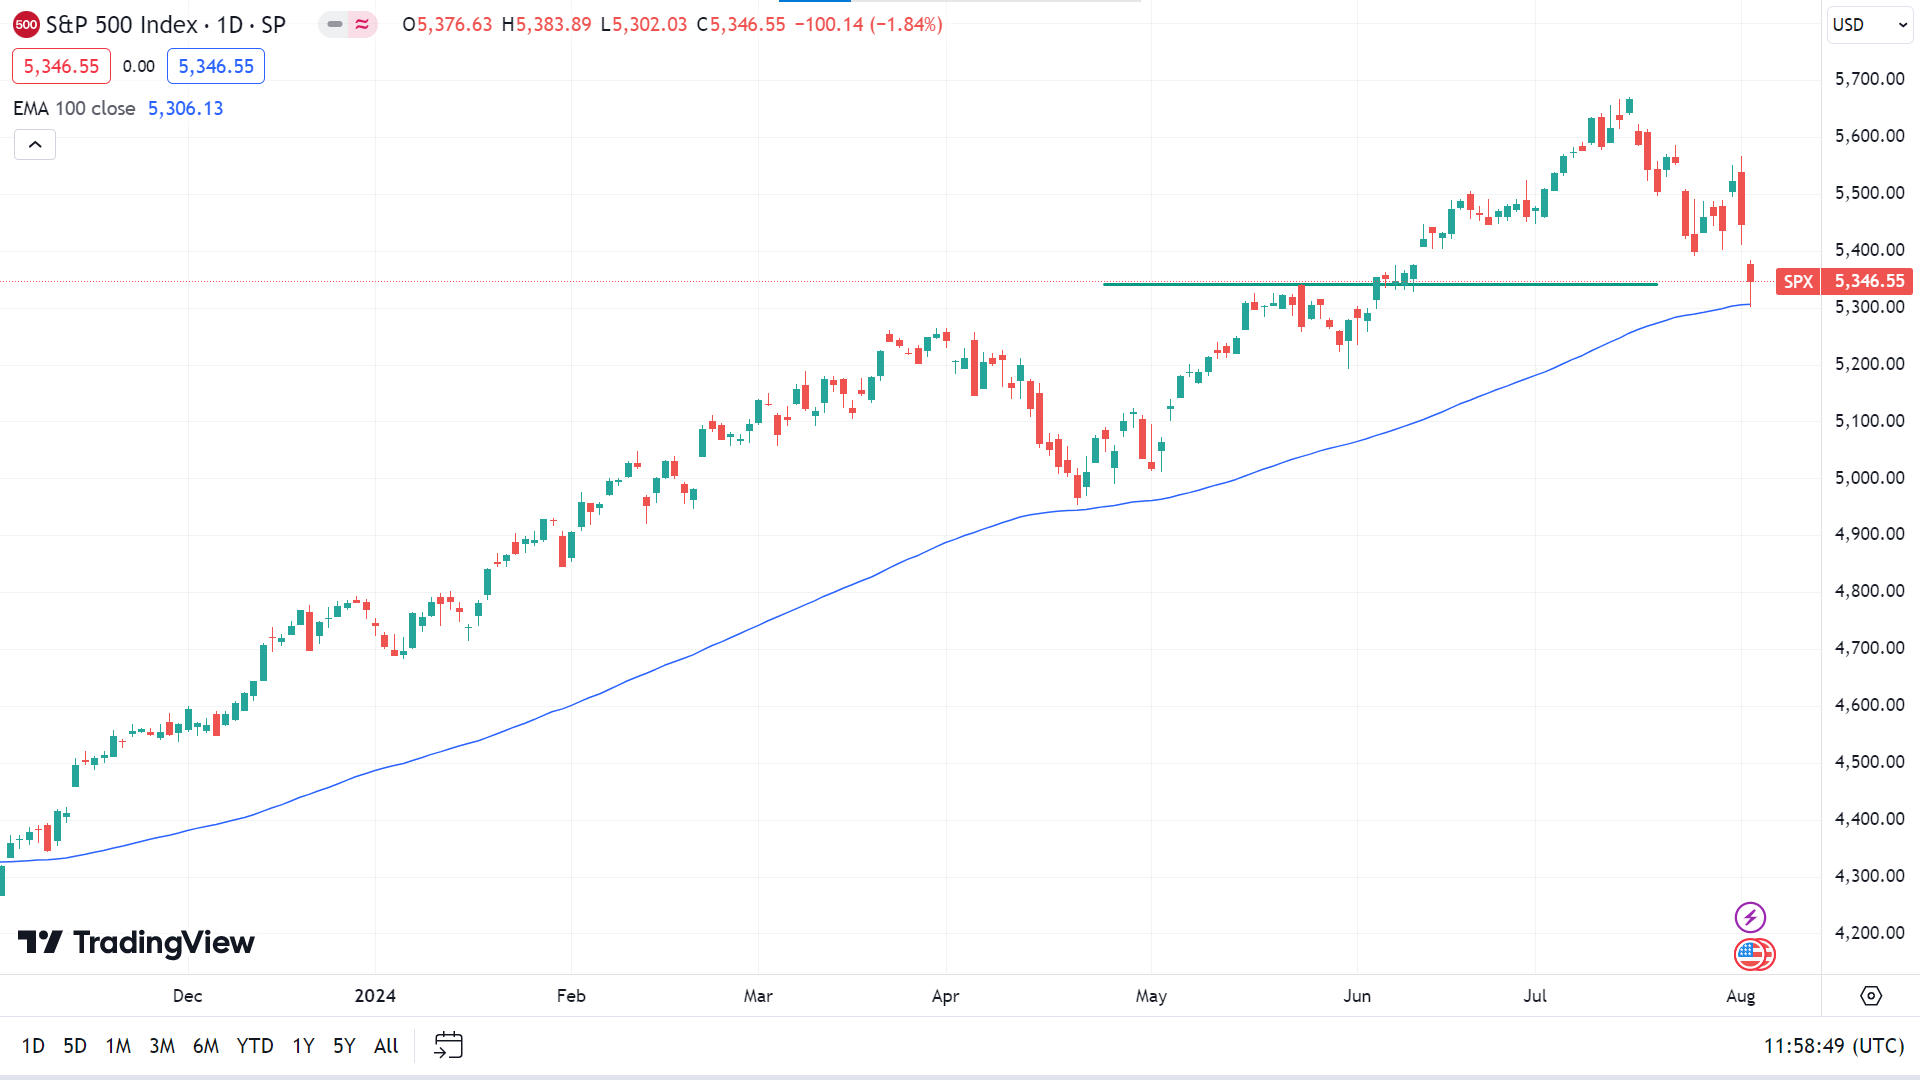
The price drops at the EMA 100 line on the daily chart but still floats above it, reflecting hope for buyers, which can trigger the price toward the primary resistance of 5,474, followed by the next resistance near 5,634.11.
However, if the price declines below the EMA 100 line, it can reach the nearest support of 5,250.95, followed by the next support near 5,070.38.
Gold (XAUUSD)
Fundamental Perspective
Gold started the week with subdued trading as investors awaited significant macroeconomic developments. After a flat close on Monday, XAUUSD gained bullish momentum on Tuesday, rising above $2,400. Geopolitical tensions flared when reports emerged that Hamas' political leader, Ismail Haniyeh, was killed in Iran while attending President Masoud Pezeshkian's inauguration. Iran's Supreme Leader Ayatollah Ali Khamenei promised severe retaliation against Israel, escalating fears of a worsening Middle Eastern crisis and driving gold prices higher.
On Wednesday, the US Federal Reserve announced it would keep monetary policy unchanged, as anticipated. Fed Chairman Jerome Powell mentioned that a rate cut could be considered in September, although a 25 basis point cut was already factored into market expectations. The announcement led to a 10-year US Treasury bond yield decline, which dropped over 2.5% on the day, further supporting gold.
Further weakening US economic data, including a rise in initial jobless claims and a decline in the ISM Manufacturing PMI, pushed the 10-year yield below 4% for the first time since February. It, coupled with disappointing Nonfarm Payrolls and a higher unemployment rate, saw gold surge above $2,470.
Gold investors will closely watch geopolitical developments and US economic indicators. Key upcoming data, including the ISM Services PMI and China's Trade Balance, could influence gold's trajectory. Persistent Middle Eastern tensions may continue to bolster gold's safe-haven appeal.
Technical Perspective
The last weekly candle closed in solid green, recovering losses from the previous two weeks, which indicates that the next candle might be another green one.
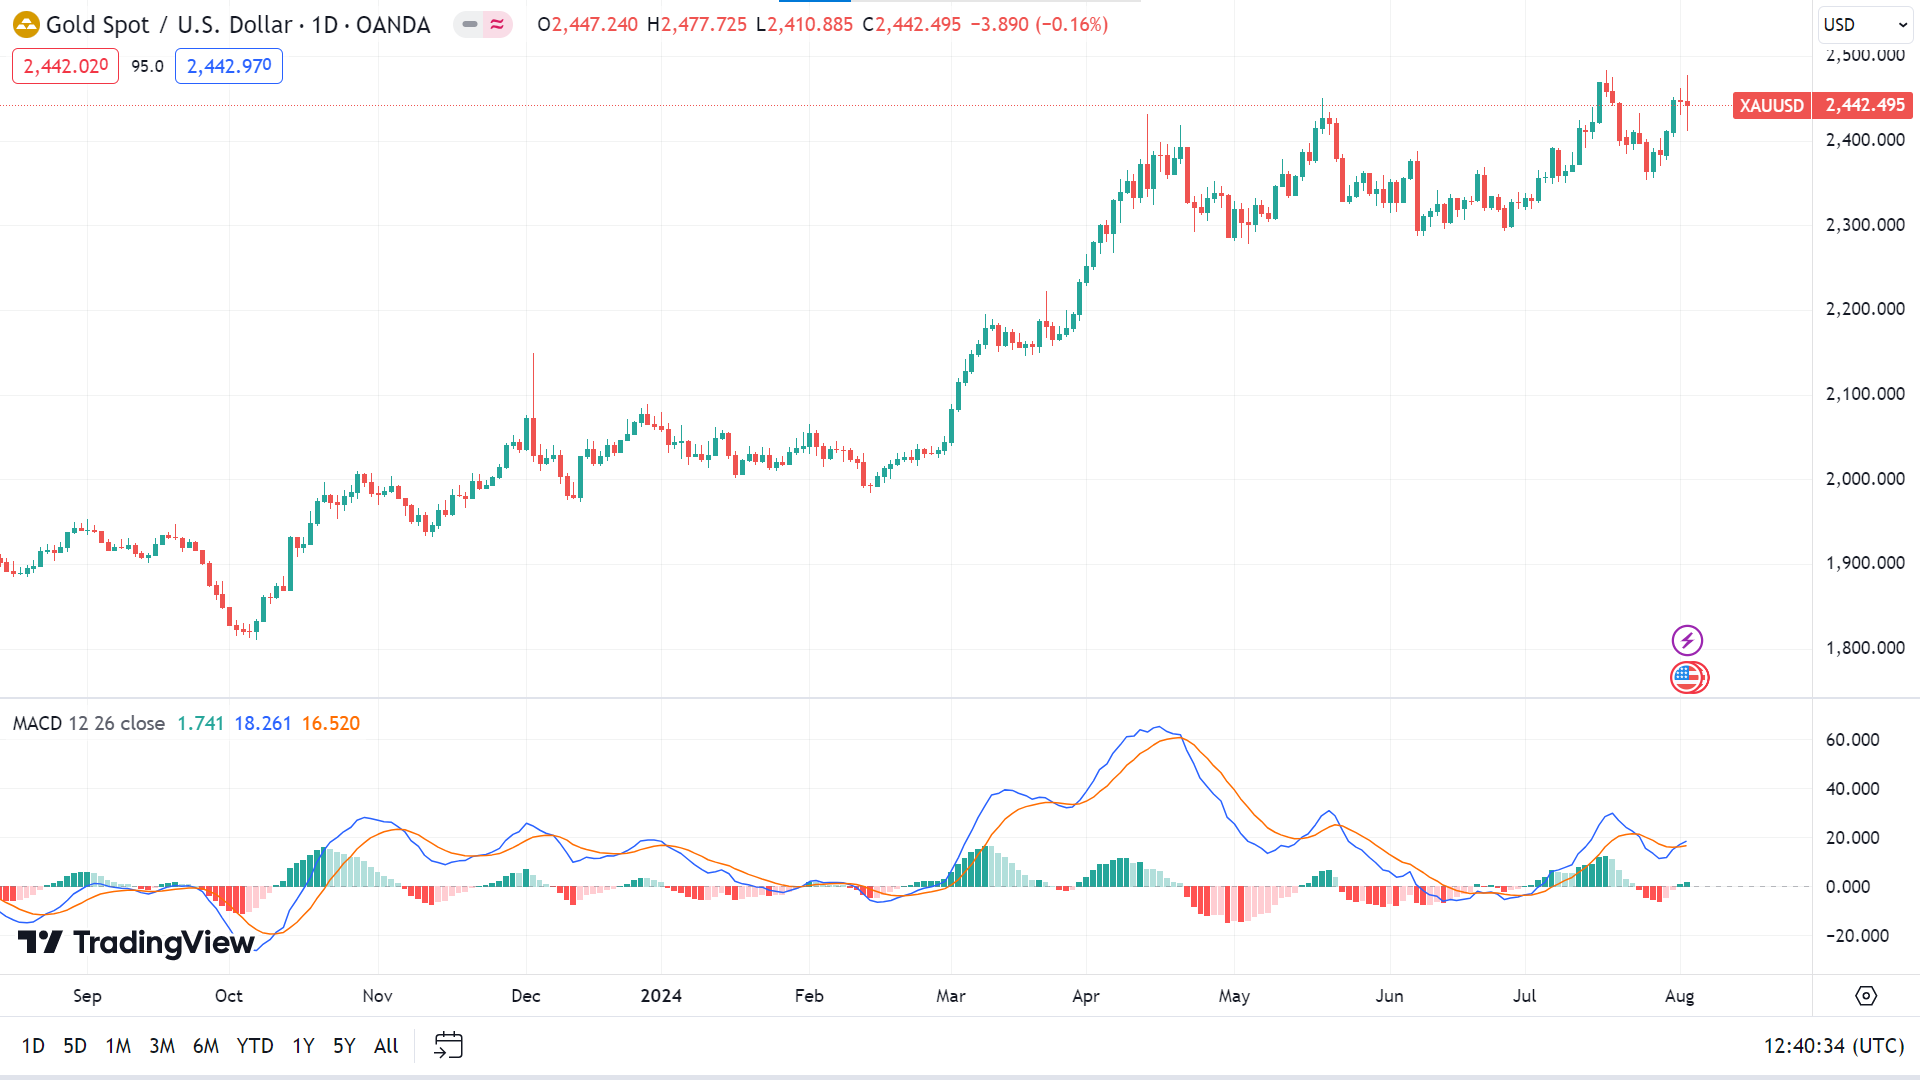
The price remains on an uptrend on the daily chart as the MACD indicator window shows fresh bullish pressure. So, the price may regain the nearest resistance of 2,479.72, followed by the next resistance near 2,518.69.
Meanwhile, the price can create a double top pattern at this level and head on the downside; the price can retouch primary support, near 2,391.64, with increasing selling pressure, followed by the next support, near 2,299.27.
Bitcoin (BTCUSD)
Fundamental Perspective
Bitcoin (BTC) experienced a downturn this week, failing to maintain a price above $70,000 and closing at $64,000 by Friday. This decline was influenced by several factors, including ongoing Bitcoin transfers by Mt. Gox for creditor repayments and the Federal Open Market Committee's (FOMC) decision to keep US interest rates unchanged.
Mt. Gox has been steadily reducing its Bitcoin holdings, which has impacted market sentiment. According to Akram Intelligence, Mt. Gox's Bitcoin balance fell from 80,000 to 33,000 BTC this week, decreasing the value from $5.3 billion to $2.1 billion. This large-scale movement of Bitcoin to exchanges for repayment may have triggered uncertainty among traders, contributing to the price drop.
Additionally, the FOMC's decision on Wednesday to hold interest rates steady at 5.25%-5.50% defied market expectations for a rate cut, initially leading to a decline in crypto prices. The sentiment was further influenced by US Senator Cynthia Lummis's introduction of the Bitcoin Act, which seeks to establish a strategic Bitcoin reserve and proposes that the US purchase 1 million BTC over five years. This bill aims to enhance Bitcoin's legitimacy and appeal, signaling increased institutional and potential government interest.
Technical Perspective
The last weekly candle closed with a solid red body after a dragonfly doji candle, indicating the next candle might be another red one.
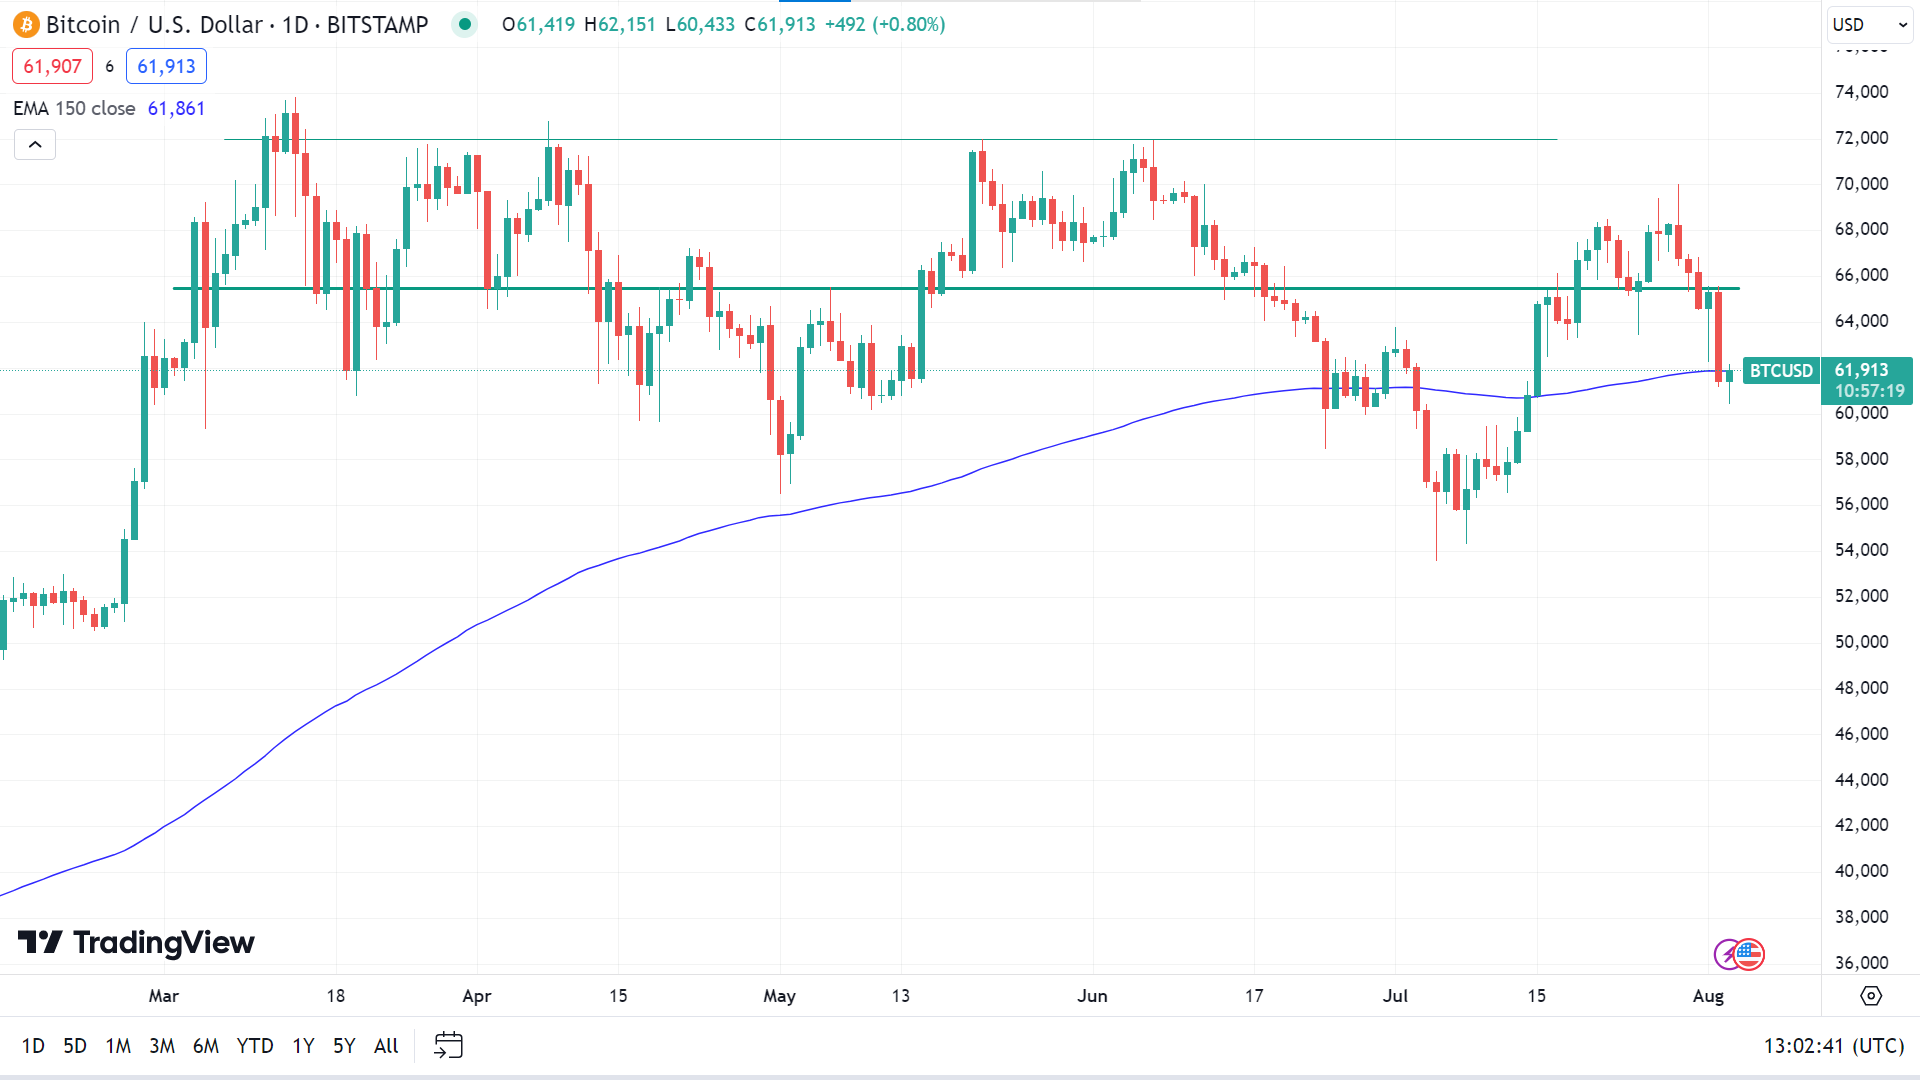
The price is currently at the EMA 150 line while writing on the daily chart, which can be considered a dynamic support-resistance level. If the price exceeds the EMA 150 line, it can hit the primary resistance at 64,332, followed by the next resistance near 68,849.
Meanwhile, if the price remains below the EMA 150 line, it can reach the nearest support near 58,762, followed by the next support near 54,460.
Ethereum (ETHUSD)
Fundamental Perspective
Ethereum's (ETH) price has been affected by a notable shift in sentiment among key investors- the whales. This shift is now influencing long-term holders, typically known for their stability but may be prompted to sell.
Over the last 24 hours, Ethereum lost a crucial psychological and technical support level due to uncertainty among whales, who chose to sell and secure their gains. Following an 11% decline from July 22 to July 25, whale addresses holding between 10,000 and 100,000 ETH began selling, moving approximately 630,000 ETH worth over $1.87 billion out of their wallets within three days.
This bearish activity has led to a 10% drop in Ethereum's price. The concern now is further selling, as long-term holders also feel the pressure. The Long-Term Holder (LTH) Net Unrealized Profit/Loss (NUPL) indicator shows LTH profits have decreased by 4%, from 49% to 45%.
This decline might prompt long-term holders to sell their holdings to protect their gains, potentially leading to broader losses for all ETH holders. Their actions should be monitored closely. Despite these bearish indicators, spot ETFs could drive recovery, potentially pulling Ethereum back above $3,118, the 23.6% Fibonacci Retracement level.
Technical Perspective
The last weekly candle closed solid red, posting two consecutive weeks of loss, leaving optimism for sellers for the next week.
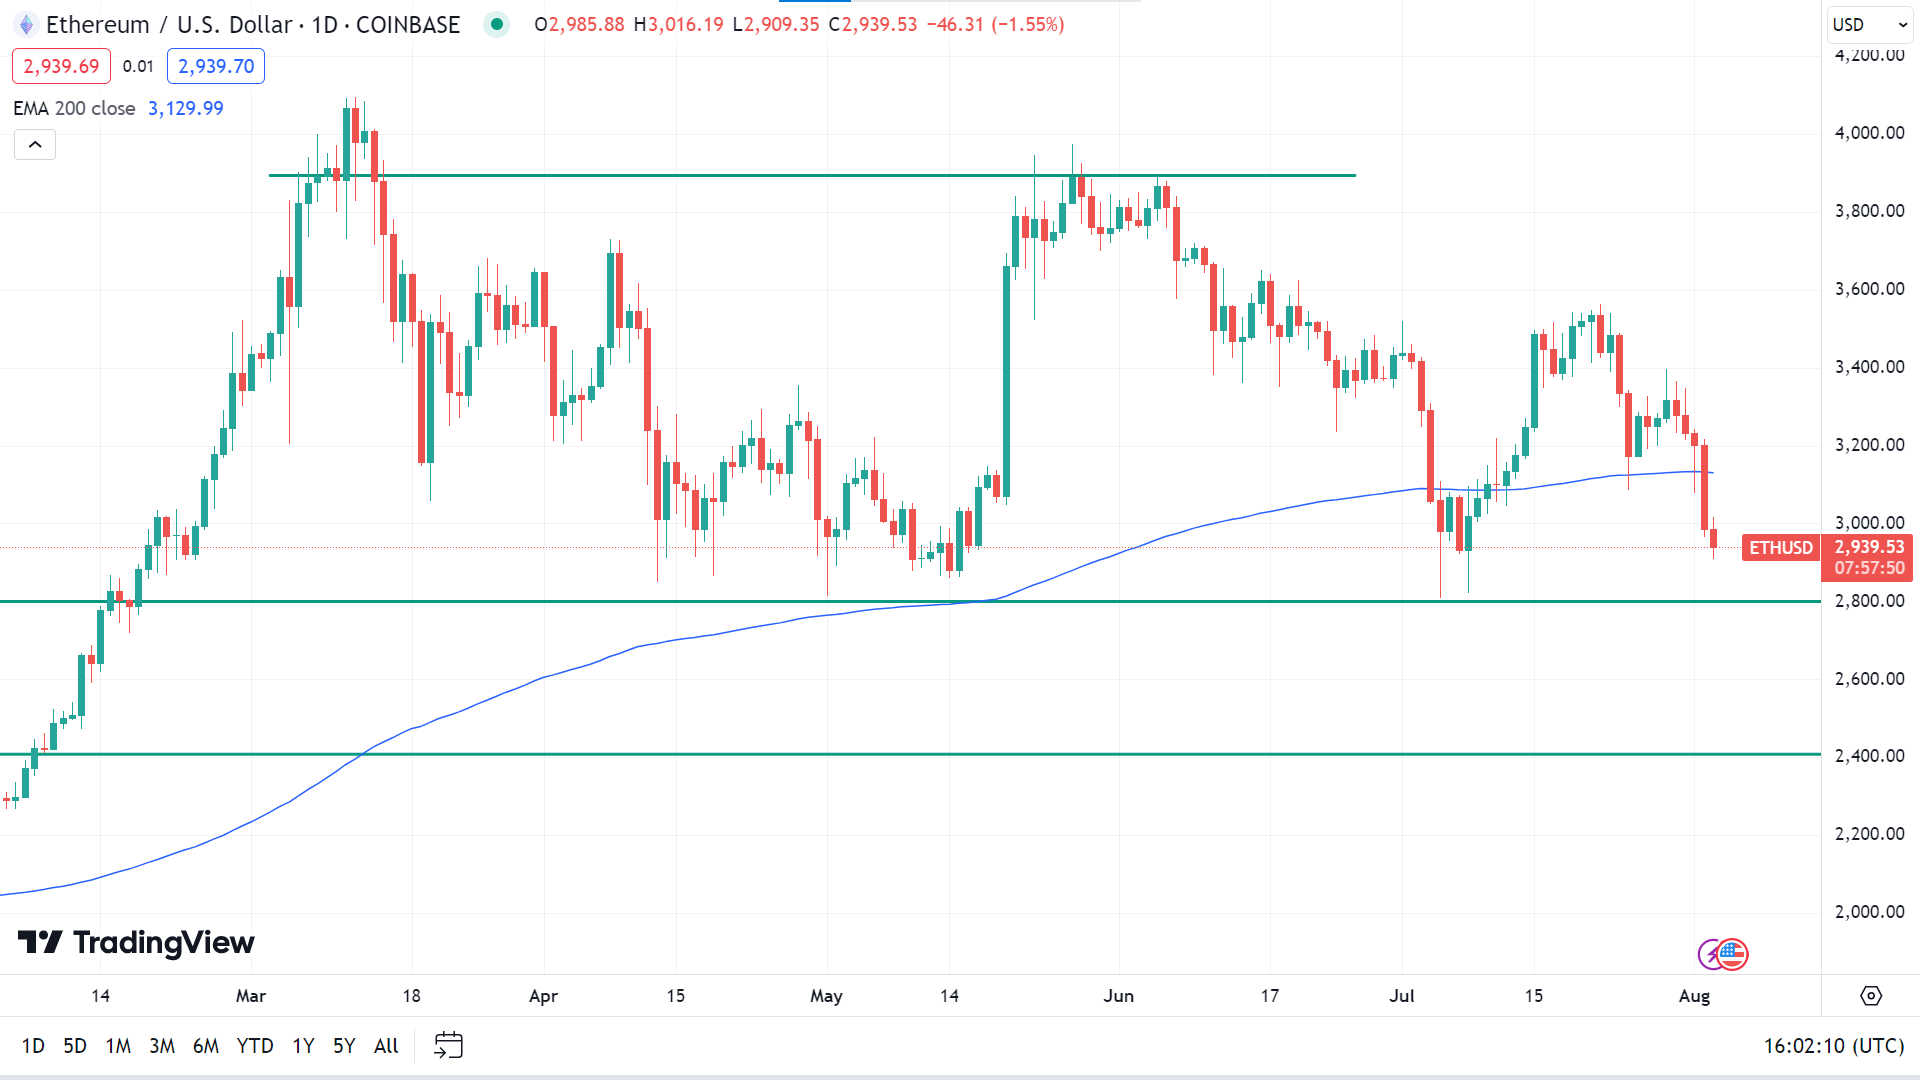
Due to selling pressure, the price reached below the EMA 200 line on the daily chart. The price may head toward the primary support of 2,800.00, followed by the next support near 2,407.00.
Meanwhile, if the price exceeds the EMA 200 line, it can hit the primary resistance of 3,310.55, followed by the next resistance near 3,531.86.
Tesla Stock (TSLA)
Fundamental Perspective
Despite a strong beginning to the fiscal year with well-received Q1 results, Tesla's Q2 earnings missed expectations. The company posted adjusted earnings of $0.52 per share, falling short of the anticipated $0.61 and below the prior year's $0.91. Revenue increased by 2% year-over-year to $25.5 billion, driven by growth in its Energy Generation and Storage segment and higher regulatory credit revenue. However, this was offset by lower average selling prices and reduced vehicle deliveries.
Tesla's adjusted EBITDA margin declined to 14.4% in Q2 from 18.7% a year ago, with a sequential drop of about 150 basis points, raising concerns about its profitability. Despite these challenges, there were positive highlights. The Energy Storage division set a record with 9.4 GWh of deployments, leading to strong segment revenues and gross profits. Increased production and a robust backlog are expected to support future revenue growth.
Additionally, improved consumer sentiment and financing options helped boost vehicle deliveries, and Tesla made strides in its AI initiatives. However, pressures on the auto business, narrowing margin gaps compared to competitors, and focusing on long-term projects like Robotaxis and the Optimus project raise questions about Tesla's immediate growth prospects and overall valuation.
Technical Perspective
On the weekly chart, the last candle ended solid red, posting three consecutive losing weeks, which indicates that the next candle might be another red one.
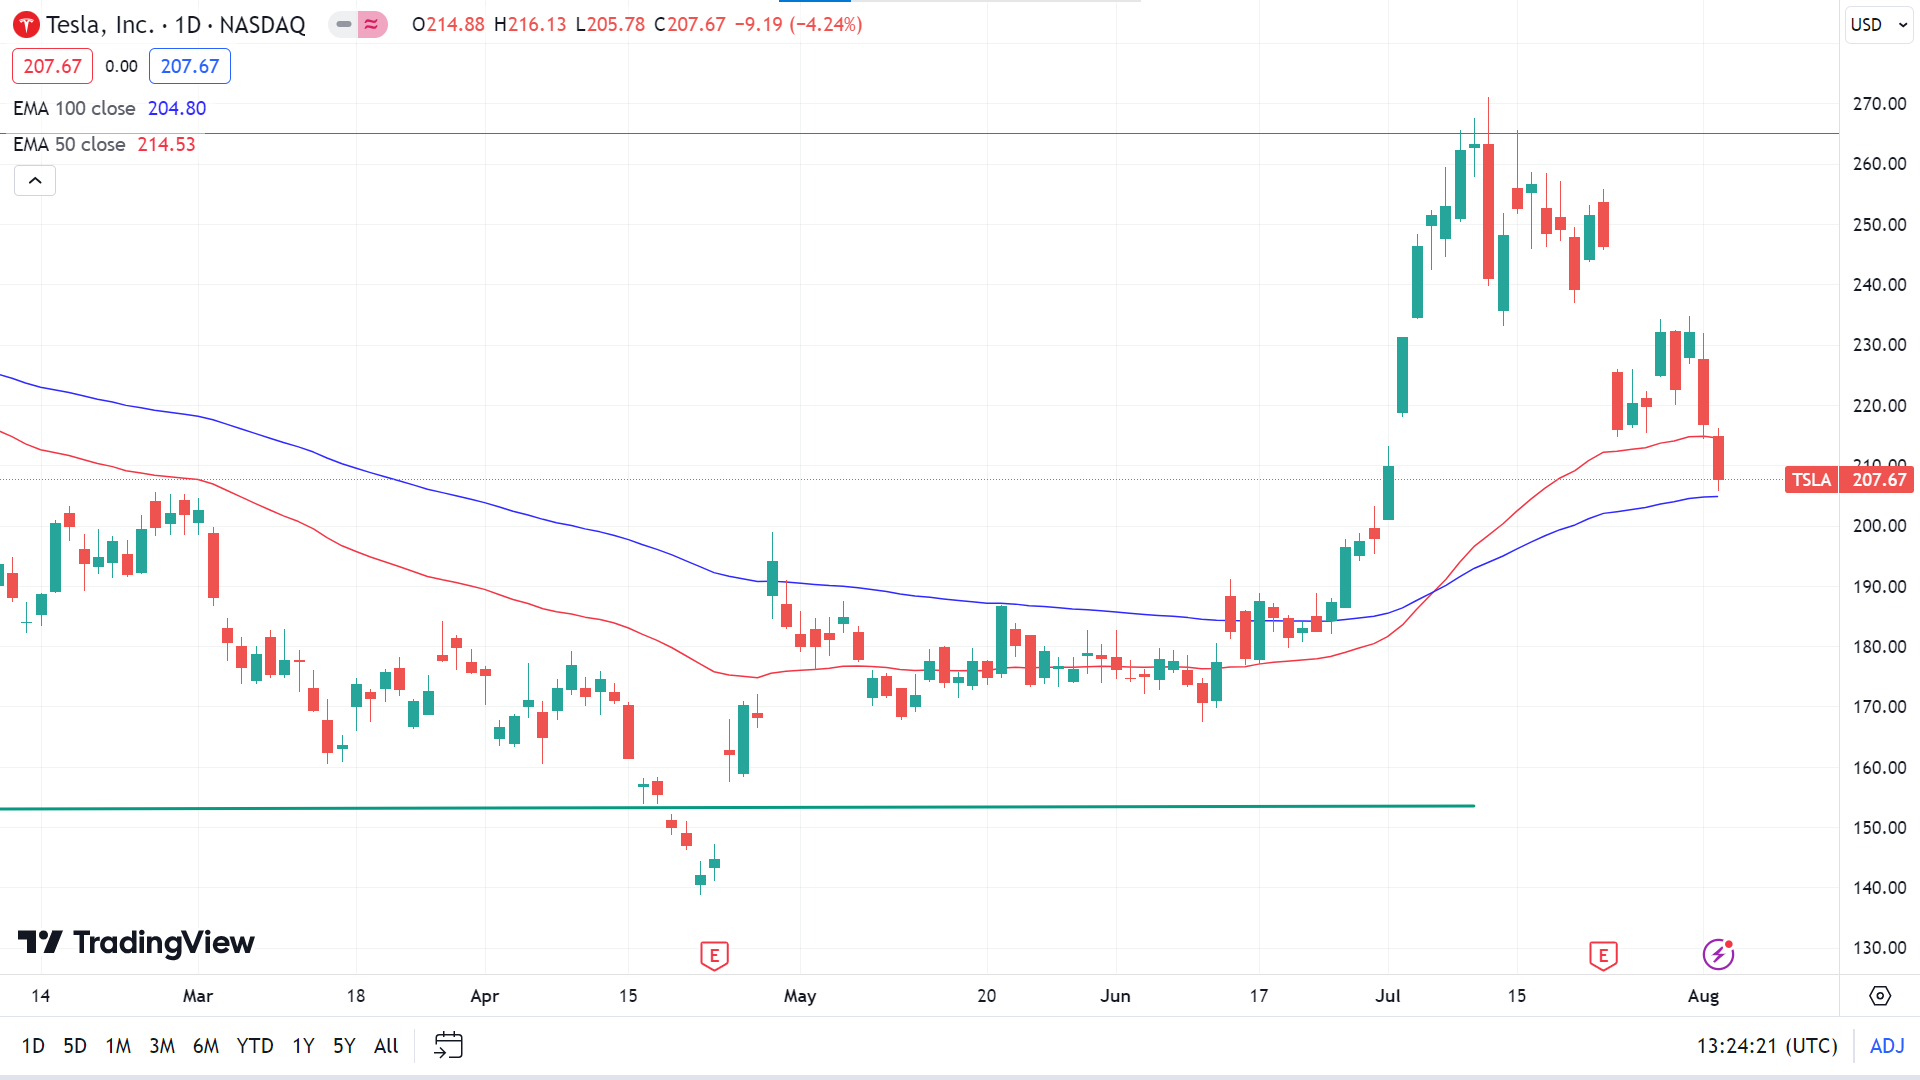
The price is floating between the EMA 100 and EMA 50 lines on the daily chart. The EMA 50 line acts as a dynamic resistance level, and the EMA 100 line acts as a dynamic support level. If the TSLA stock price exceeds the EMA 50 line, it can hit the primary resistance of 231.20, followed by the next resistance near 251.05.
Meanwhile, if the price declines below the EMA 100 line, it can reach the primary support of 193.09, followed by the next support near 175.62.
Nvidia Stock (NVDA)
Fundamental Perspective
Nvidia has been at the forefront of the market rally over the past year and a half, championing the AI boom with its essential hardware for data centers powering AI models like ChatGPT. The company's business has expanded rapidly, contributing to a remarkable increase of over $3 trillion in market value within a year—a gain unparalleled in scale.
However, as Nvidia's valuation soars, investors are growing concerned about its sustainability. Doubts are emerging not only about the high valuations of AI stocks but also about broader economic strength, with rising unemployment potentially signaling an impending recession. Given its cyclical nature and Nvidia's premium pricing, an economic downturn could severely impact the AI sector.
Recent stock movements highlight this volatility. Nvidia's shares dropped 7% on Tuesday but surged 13% on Wednesday, buoyed by strong results from competitor AMD, demonstrating how quickly sentiment can shift. While Nvidia's leadership in AI hardware is expected to drive continued growth, the possibility of a recession could disrupt its upward trajectory. Investors should prepare for ongoing volatility and consider holding some cash to take advantage of potential dips, even as Nvidia's dominance in AI remains strong.
Technical Perspective
The last weekly candle closed with a red body, wicks on both sides, still leaving room for sellers for the upcoming week.
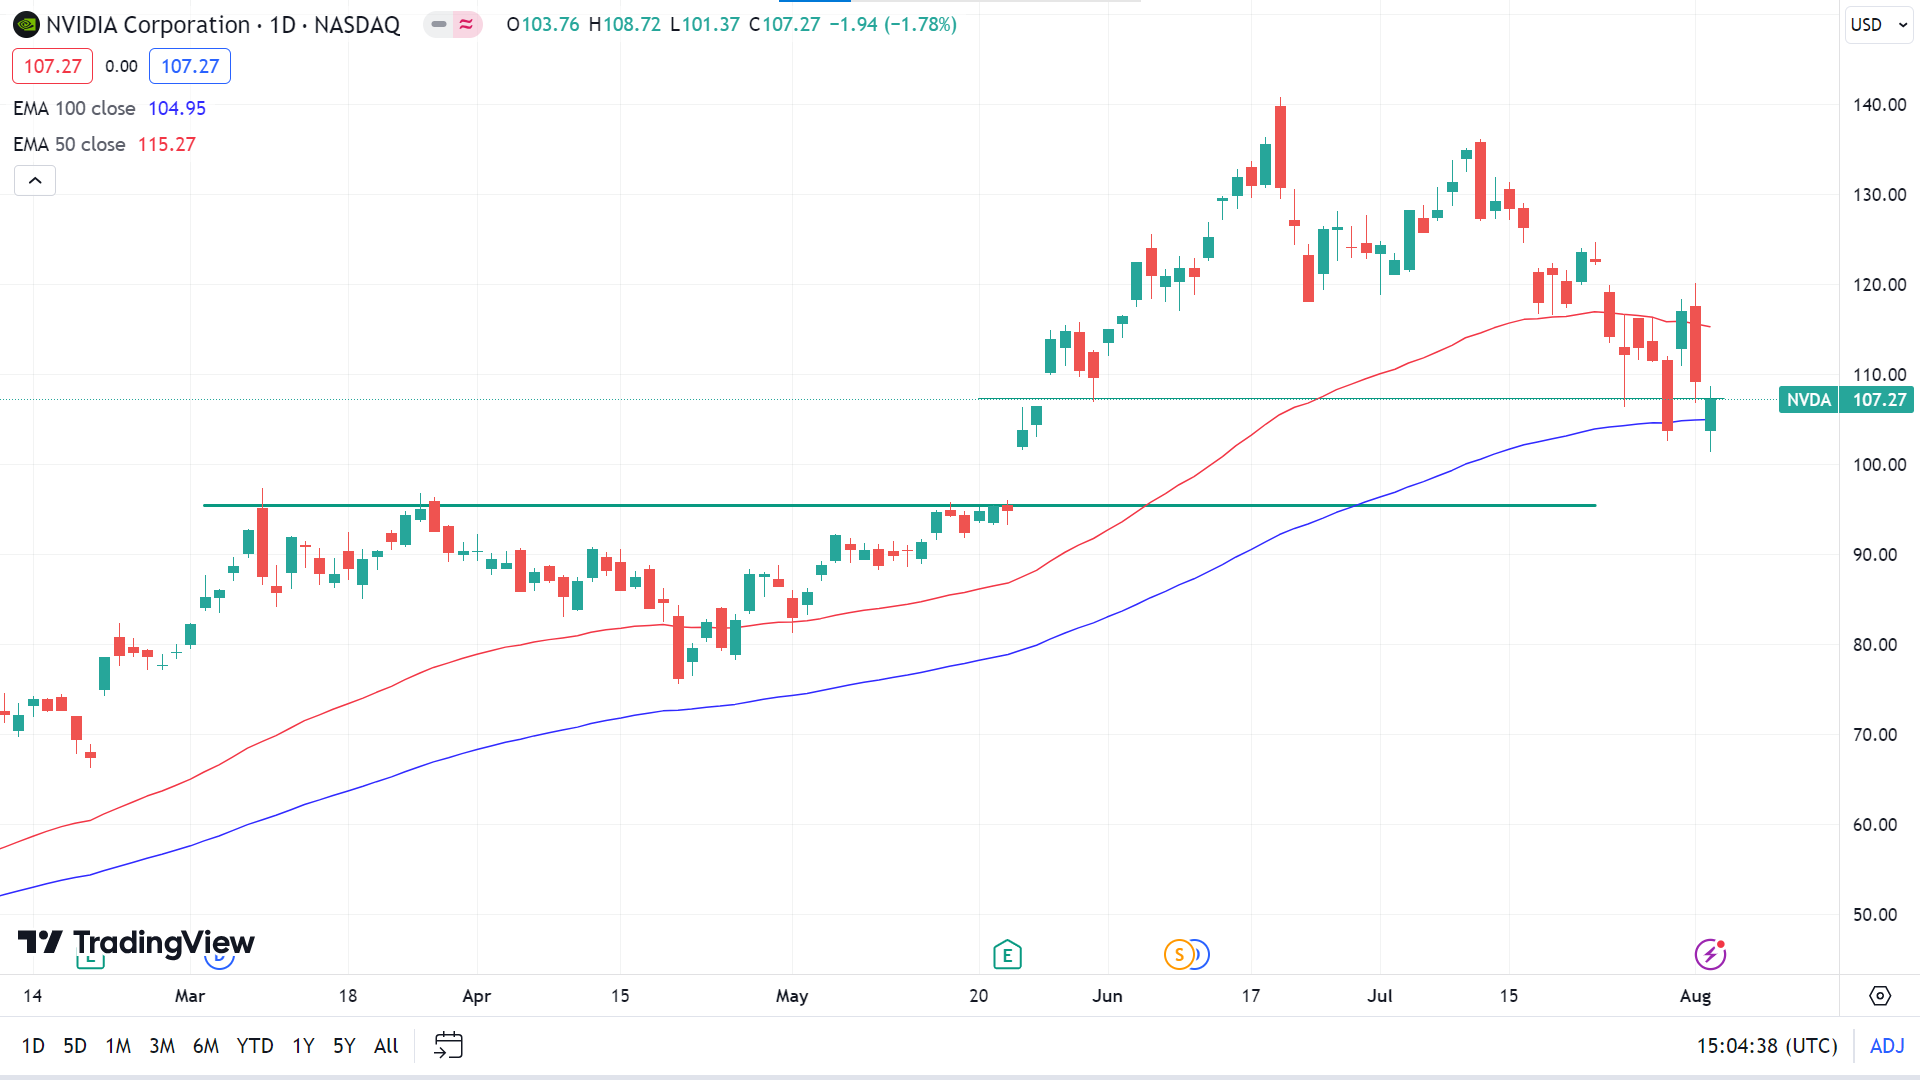
On the daily chart, the NVDA stock price ends up floating between the EMA 100 and EMA 50 lines. Meanwhile, the EMA 50 line acts as a dynamic resistance, and the EMA 100 line acts at a dynamic support level. So, if the price exceeds the EMA 50 line, it can hit the primary resistance of 119.36, followed by the next resistance near 125.96.
On the negative side, if the price reaches below the EMA 100 line, it may decline toward the primary support of 100.31, followed by the next support near 95.74.
WTI Crude Oil (USOUSD)
Fundamental Perspective
Crude oil and gasoline prices tumbled to two-month lows on Friday, closing sharply lower amid concerns about US energy demand. Weaker-than-expected US economic reports on July nonfarm payrolls and June factory orders indicated a slowing economy, dampening confidence in economic growth and energy demand. Additionally, a selloff in the S&P 500 to an eight-week low further undermined market sentiment, weighing on crude prices.
Geopolitical tensions in the Middle East provided some support for crude prices. Iran's Supreme Leader Ayatollah Ali Khamenei announced plans to retaliate against Israel for the killing of a Hamas leader in Tehran, raising fears of potential disruptions to the region's crude supplies. The ongoing Hamas-Israel conflict, with Israel's military operations in Gaza and the risk of escalation to Hezbollah in Lebanon or direct conflict with Iran, also adds to supply concerns. Furthermore, attacks on commercial shipping in the Red Sea by Iran-backed Houthi rebels have forced shippers to reroute around Africa, disrupting global oil supplies.
Despite these support factors, bearish elements include an increase in crude oil stored on tankers, as reported by Vortexa, and OPEC+'s plan to restore some crude production in Q4, raising worries about a potential oversupply. The EIA report for the week ending July 26 also highlighted US crude, gasoline, and distillate inventories being below their five-year seasonal averages, adding to the complexity of the market outlook.
Technical Perspective
The last weekly candle closed solid red, posting four consecutive weeks of loss, leaving optimism for sellers for the upcoming week.
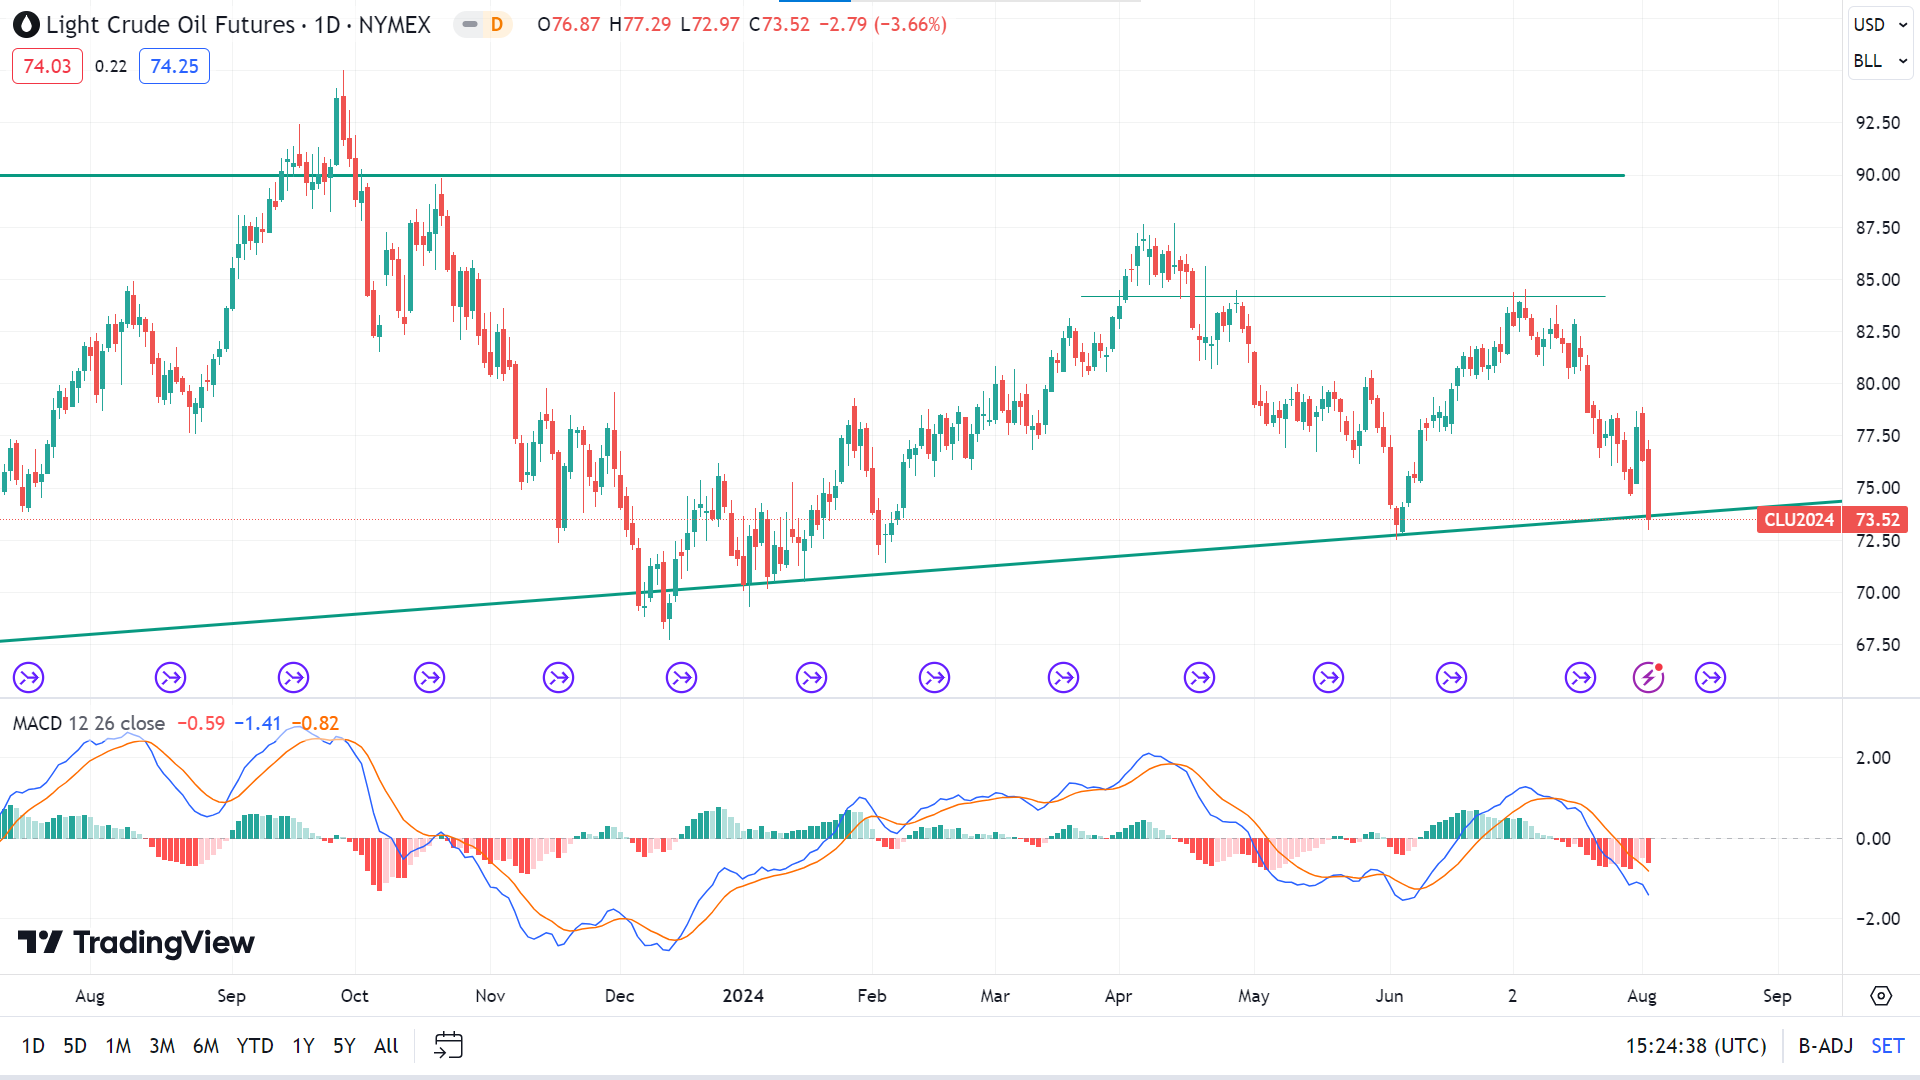
As the MACD indicator window reveals, the price is on a downtrend on the daily chart. So, downward pressure can cause the price to move toward the nearest support of 71.40, followed by the next support near 68.89.
Meanwhile, the faded red bars below the midline on the MACD indicator window show that selling pressure can turn pale at this level, and the price gets back to a long-term bullish uptrend trendline. So, a bounceback can occur at this level, which may trigger the price toward the nearest resistance of 78.03, followed by the next resistance near 81.47.