- Verizon's Q2 2024 performance showed modest revenue growth, driven by increased wireless service revenue but a slight decline in EPS.
- The stock experienced a drop during Q2, underperforming the S&P 500's gain and Technicals hold a positive outlook.
- Strategic investments in 5G and fixed wireless are ongoing, but competitive and operational pressures persist.
I. Verizon Q2 2024 Performance Analysis
A. Key Segments Performance
Financial Highlights
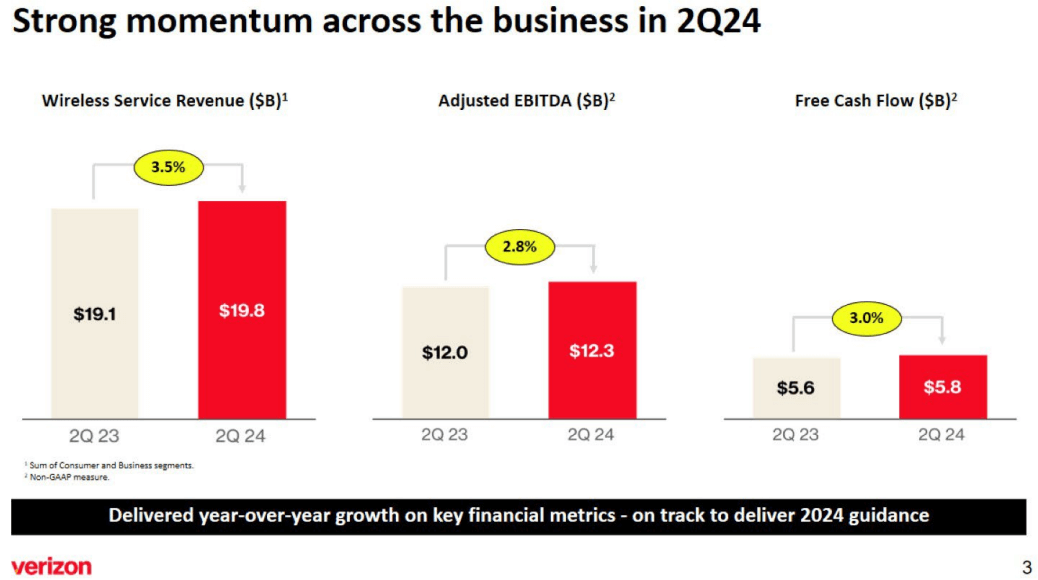
Verizon's total operating revenue for Q2 2024 was $32.8 billion, reflecting a 0.6% increase from the previous year. This growth was driven by a 3.5% year-over-year increase in wireless service revenue, which totaled $19.8 billion. This segment's growth was primarily attributed to an increase in consumer wireless service revenue, boosted by pricing actions and fixed wireless adoption. Consolidated net income stood at $4.7 billion, slightly down from $4.8 billion in Q2 2023. Adjusted EPS was $1.15, down 5% year-over-year from $1.21, primarily due to higher interest expenses and increased cash taxes. The earnings per share without special items were $1.09, a slight decrease from $1.10 in Q2 2023.
Source: 2Q24 VZ Presentation
The net unsecured debt decreased by $3.2 billion to $122.8 billion, and the net unsecured debt to adjusted EBITDA ratio improved to 2.5 times from 2.6 times in the previous quarter. Cash flow from operations for the first half of 2024 was $16.6 billion, down from $18 billion in the prior year, influenced by higher taxes and interest expenses. Capital expenditures were reduced to $8.1 billion, significantly lower than the $10.1 billion spent in the first half of 2023. This resulted in a free cash flow of $8.5 billion, an increase of 7% year-over-year.
Operational Performance
Consumer wireless postpaid phone gross additions increased by 12% year-over-year to approximately 1.8 million. Retail postpaid phone net-adds were 148,000, marking significant improvements. Prepaid services experienced a loss of 624,000 subscribers, largely due to the shutdown of the Affordable Connectivity Program (ACP), with SafeLink accounting for 410,000 losses. Excluding SafeLink, prepaid net losses were 12,000. Verizon continues to expand its broadband base, adding 391,000 net subscribers in Q2, driven mainly by fixed wireless access (FWA) with 378,000 net adds. The FWA base now exceeds 3.8 million subscribers, up nearly 69% year-over-year. Fios Internet additions were 24,000, maintaining steady growth despite the ACP shutdown.

Source: 2Q24 VZ Presentation
Technological Advancements and Innovations
Verizon launched the myHome plan for Home Internet, following the success of myPlan. These initiatives aim to enhance customer experience and expand its broadband service footprint. The company continues to advance its 5G network, with nearly 50% of its traffic now running on ultra-wideband C-Band spectrum, which supports ultra-low latency and high bandwidth applications. Verizon's AI-driven solutions have optimized customer support operations, analyzing over 800 data points per call to enhance service efficiency. The deployment of C-Band spectrum is progressing, covering nearly 60% of planned sites, enhancing network performance and customer service reliability.
B. VZ Stock Price Performance
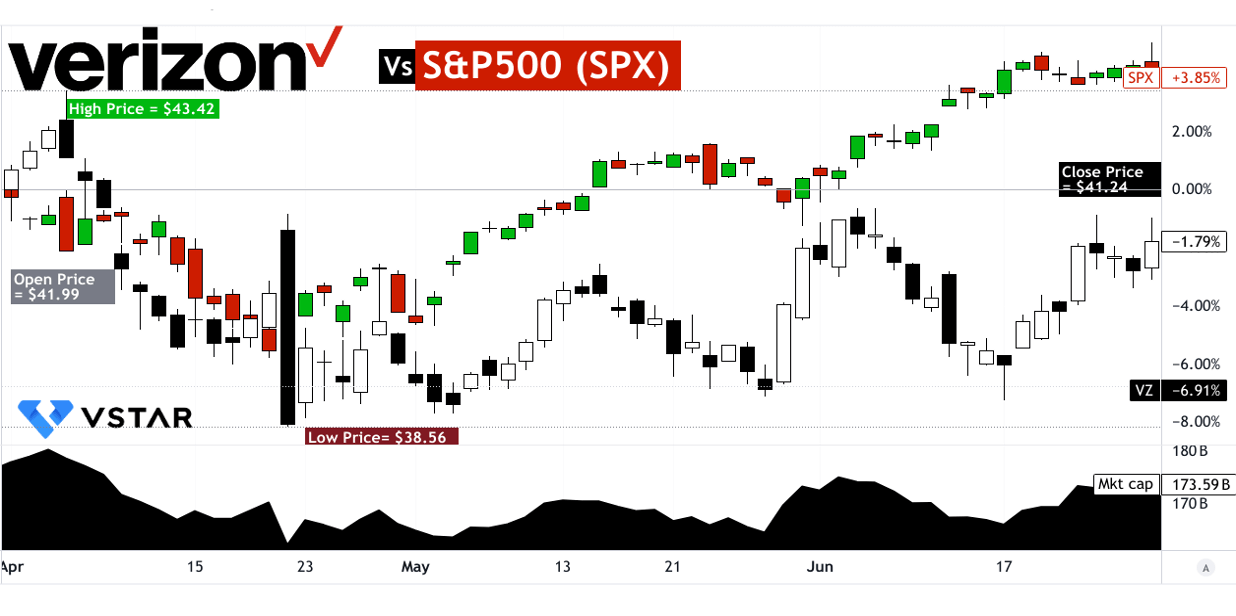
Verizon Communications (NYSE: VZ) holds a significant market capitalization of $173.59 billion. This large market cap underscores Verizon's stock which opened the quarter at $41.99 and closed at $41.24. This minor decline highlights the relative stability of Verizon stock price, although it also points to a slight bearish sentiment over the period. During the quarter, Verizon's stock experienced fluctuations with a high of $43.42 and a low of $38.56. The VZ stock price decreased by 1.79% over the quarter. When comparing Verizon's performance to the broader market, the S&P 500 index (SPX) saw a positive price return of 3.85% over the same period. This stark contrast highlights that Verizon underperformed relative to the general market.
Source: tradingview.com
II. VZ Stock Forecast: Outlook & Growth Opportunities
A. Segments with Growth Potential
Verizon Communications (NYSE: VZ) is strategically positioned to capitalize on significant growth opportunities in the communication services market, particularly within mobile data and broadband segments. As the U.S. continues its leadership in 5G technology, Verizon's investments in this area are set to drive substantial revenue growth. The company's focus on mobile data, which is expected to reach $142.4 billion in 2024, aligns with broader industry trends. The rollout of 5G technology enhances download speeds, reduces latency, and supports high-bandwidth applications, positioning Verizon to leverage AI and IoT advancements effectively. This infrastructure enables seamless AI integration and IoT deployment, catering to businesses' evolving needs for real-time data processing and connectivity.
Verizon's broadband segment is also a key growth area. With over 11.5 million broadband subscribers and a significant boost from fixed wireless access (FWA), the company is expanding its market share. The fixed wireless segment, with 3.8 million subscribers, is experiencing accelerated growth, driven by increasing demand for reliable, high-speed internet services. Verizon's strategy to enhance FWA, supported by its C-Band expansion, aims to reach 4-5 million subscribers, reinforcing its broadband leadership.

[5G share of total mobile connections in 2023 and 2030]
Source: statista.com
B. Expansions and Strategic Initiatives
Verizon's growth strategy is underpinned by robust expansions and strategic initiatives:
Research and Development Investments: Significant investments in R&D are central to Verizon's strategy. The company is advancing its 5G infrastructure and exploring next-gen technologies, such as mobile edge computing (MEC) and AI-driven solutions. These innovations aim to enhance network performance, reduce latency, and support advanced applications across various sectors.
Partnerships and Collaborations: Verizon's partnerships are pivotal in expanding its service portfolio. Collaborations with technology firms, such as its alliance with AST SpaceMobile for satellite-to-device connectivity, aim to extend Verizon's network reach to underserved areas, enhancing its 5G footprint. Additionally, partnerships with content providers like YouTube Premium and Peacock offer bundled services, enhancing customer value and retention.
Capital Expenditure and Network Expansion: Verizon's capital expenditure remains robust, with a forecasted $17.0-$17.5 billion for 2024. This investment supports the deployment of C-Band spectrum, enhancing network capacity and coverage.
These factors may benefit the company's top-line as observed in the Analysts' 2024 estimates.

Source:seekingalpha.com
III. Verizon Stock Forecast 2024
A. VZ Stock Forecast: Technical Analysis
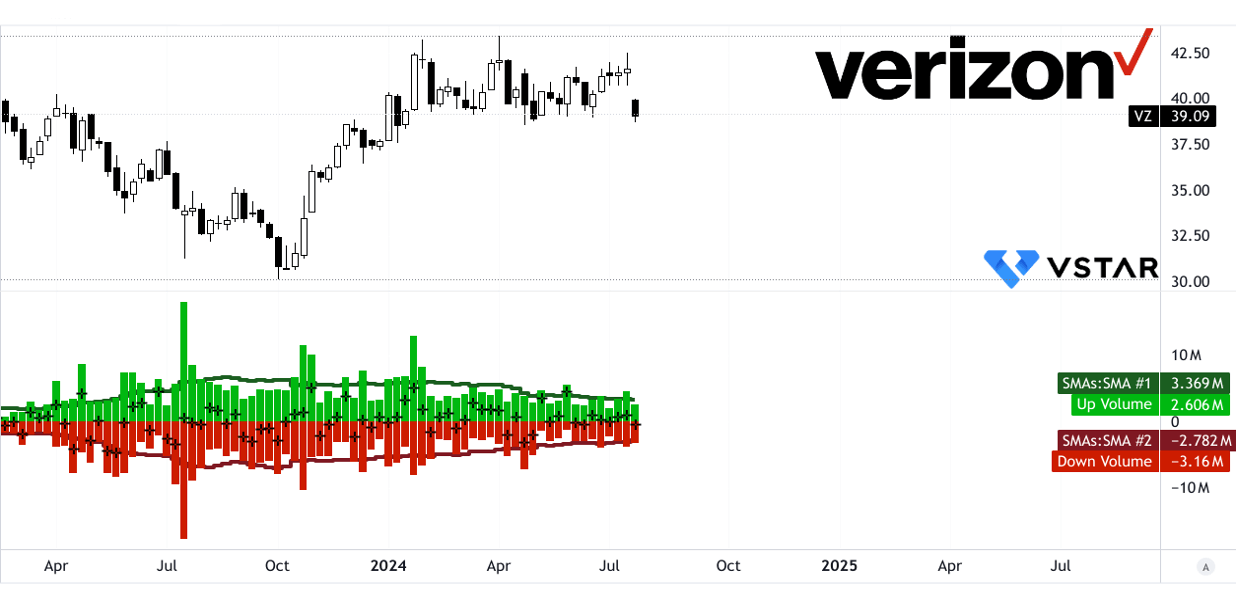
As of now, Verizon Communications (NYSE: VZ) is priced at $39.09. Utilizing a modified exponential moving average, the trendline is situated at $40.32, and the baseline is closely aligned at $40.24. Presently, the stock is experiencing a downward trend, suggesting bearish sentiment in the market.
Price Targets for 2024: The forecast for Verizon's stock by the end of 2024 varies based on different technical indicators and market projections. The average VZ price target stands at $48.00. This estimate is derived from analyzing the momentum of changes in polarity over the mid- to short-term, projected onto Fibonacci retracement and extension levels. The optimistic VZ stock price target is $53.00, which is based on an assumption of upward price momentum within the current swing period. On the contrary, the pessimistic Verizon price target is $38.00, reflecting the possibility of continued downward price momentum under the same technical framework.

Source: tradingview.com
Support and Resistance Levels: Identifying key support and resistance levels is crucial for understanding potential price movements. The primary resistance level is at $39.48, slightly above the current price, indicating an immediate hurdle for upward movement. The pivot of the current horizontal price channel is at $40.12, with resistance levels scaling up to $44.48 in cases of heightened volatility. Core resistance levels are noted at $42.42 and $40.85, while support levels range from $32.42 to $37.82, with an additional support level at $35.76 under volatile conditions.
Relative Strength Index (RSI): The RSI for Verizon stands at 42.09, which falls below the regular bullish level of 48.35 and the bearish level of 57.57. This RSI value signals that the stock is neither overbought nor oversold, but the downward trend in the RSI line indicates weakening momentum and a potential for further price declines. There are no bullish or bearish divergences present, confirming the current trend.
Moving Average Convergence/Divergence (MACD) Indicator: The MACD analysis reveals a bearish trend for Verizon's stock. The MACD line is at 0.4854, below the signal line at 0.6684, with a negative histogram value of -0.183. This configuration points to increasing bearish momentum, suggesting that the stock could continue its downward trajectory.

Source: tradingview.com
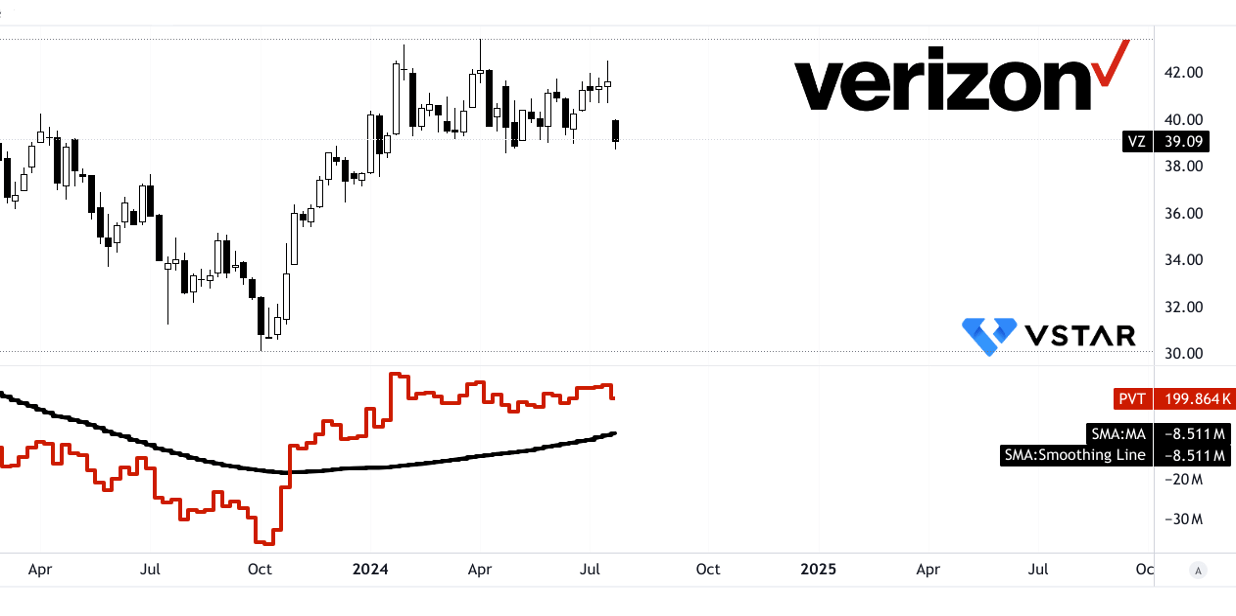
Price Volume Trend (PVT): The PVT line is at 199.864 (in thousands), with a moving average of -8.511 (in millions). Despite the bearish price trend, the prevailing stock price volume momentum is bullish, indicating strong buying interest that could counteract the downward price trend over time.
Source: tradingview.com
Weekly Volume Delta: The weekly volume delta shows a negative value of -553.918 (in thousands), with an average up volume of 3.369 million and a down volume of -2.782 million. The moving average of the volume delta is 0.587 million, indicating a bullish volume momentum. This suggests that despite the recent price decline, there is significant buying activity that could potentially support a reversal or stabilization in the near term.
Source: tradingview.com
B. Verizon Stock Prediction: Fundamental Analysis
Verizon Communications (NYSE: VZ) demonstrates a nuanced valuation through its financial ratios. The company's forward P/E ratio stands at 9.11, significantly lower than the sector median of 13.23, indicating a -31.16% difference. This lower P/E ratio suggests that VZ is potentially undervalued compared to its peers, which may present a buying opportunity if the market recognizes its intrinsic value.
However, the PEG ratio tells a different story. VZ's forward PEG ratio is 5.35, markedly higher than the sector median of 1.49, showing a 259.57% increase. This high PEG ratio implies that VZ's earnings growth does not justify its price, potentially signaling overvaluation when growth is considered.

Source: Analyst's compilation
C. VZ Forecast: Market Sentiment
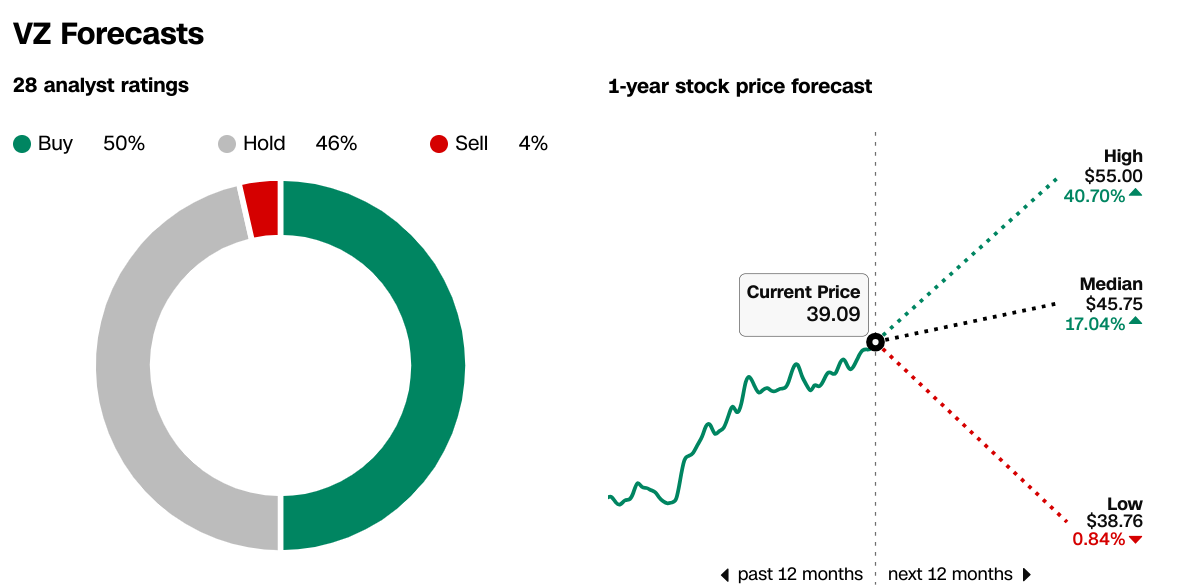
Analyst sentiment towards Verizon is cautiously optimistic. Out of 28 analyst ratings, 50% recommend a "Buy," 46% suggest a "Hold," and only 4% advise a "Sell." The 1-year price targets for VZ reflect a varied outlook: the high target is $55.00, implying a 40.70% upside, the median target is $45.75, a 17.04% increase, and the low target is $38.76, just 0.84% above the current price of $39.09. This range indicates a general expectation of modest to significant upside potential.
Source:CNN.com
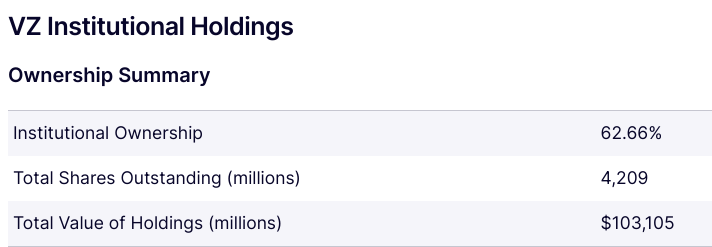
Institutional investors hold 62.66% of VZ's shares, with a total value of $103,105 million, suggesting strong confidence from major investors.
Source:Nasdaq.com
Short interest in VZ stands at 46.46 million shares, representing 1.10% of the float with a days-to-cover ratio of 2.2. This relatively low short interest suggests that bearish sentiment is minimal.

Source:benzinga.com
IV. VZ Stock Forecast: Challenges & Risk Factors
Verizon Communications (NYSE: VZ) faces several significant challenges and risks impacting its stock forecast. It competes primarily with AT&T and T-Mobile US in the U.S. telecom market. AT&T, having reported $122 billion in revenue for 2023, is a formidable rival. T-Mobile US also poses a challenge, particularly in the wireless space where it has been aggressive in pricing and customer acquisition. The competition from these players can pressure Verizon's pricing strategies and market share.

[Revenue of selected major telecommunication service companies in the United States from 2008 to 2023 (in billion U.S. dollars)]
Source: statista.com
Moreover, The Affordable Connectivity Program (ACP) has caused some disconnections in Verizon's prepaid and Fios segments. While this impact is expected to be modest, it could still affect short-term revenue from these sectors. The rollout of new AI-driven phones could disrupt the upgrade cycle, potentially affecting Verizon's device sales and customer retention.
In conclusion, Verizon's Q2 2024 results show modest growth in revenue and a slight dip in EPS. The stock saw a minor decline over the quarter, underperforming against the S&P 500's gain. Despite Verizon's strategic investments in 5G and fixed wireless access, its stock faces volatility and competitive pressures from AT&T and T-Mobile. The technical outlook suggests an upward close for 2024. VZ stock is a buy with systematic averaging. CFDs are a better option to capture the volatility in VZ stock. For CFD trading on Verizon (VZ) stock, VSTAR offers a regulated platform with low fees and tight spreads. VSTAR, regulated by ASIC and offering CFDs on major stocks, provides a user-friendly app for both new and experienced traders.
