- AT&T's Q2 2024 performance showed a slight decline in revenue and net income, while operating income fell due to increased expenses.
- Mobility services and fiber broadband grew, with significant gains in subscriber numbers and broadband revenue.
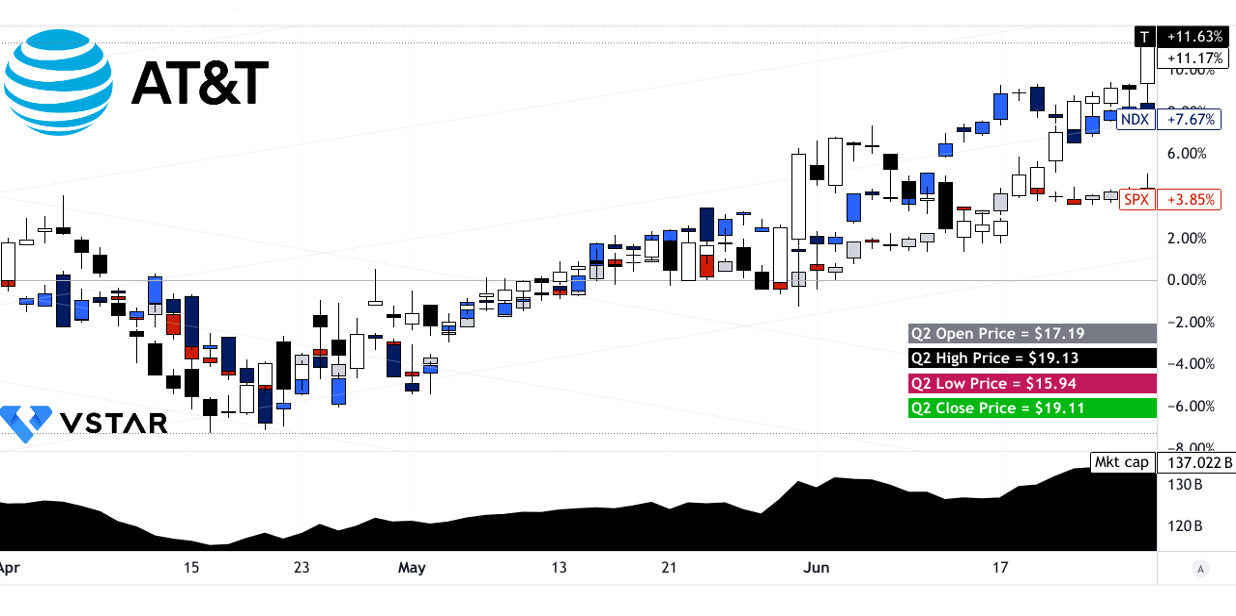
- The T stock price saw an over 11% price increase, outperforming major indices.
- Growth opportunities lie in 5G and fiber expansion, though challenges include high debt and intense competition.
I. AT&T Q2 2024 Performance Analysis
A. Key Segments Performance
Financial Highlights
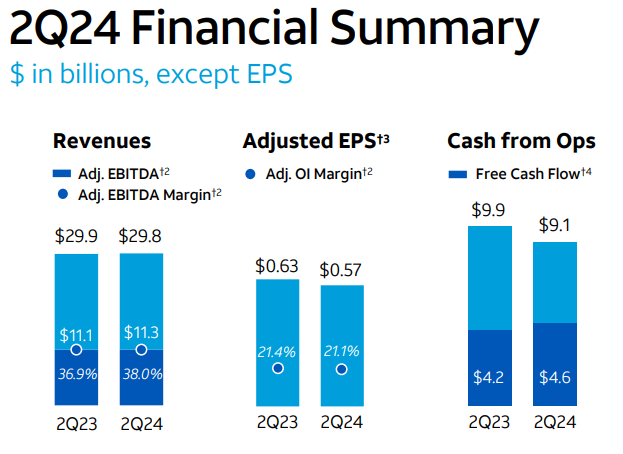
AT&T's revenues for Q2 2024 were $29.8 billion, a slight decrease from $29.9 billion in Q2 2023. This decline was primarily due to lower Business Wireline service revenues and Mobility equipment revenues. The net income was $3.9 billion, compared to a higher figure in the previous year. Adjusted EBITDA was $11.3 billion. The diluted EPS was $0.49, with an adjusted EPS of $0.57, a decrease from the previous year's $0.63.
Operating income was $5.8 billion, down from $6.4 billion in Q2 2023. Adjusted operating income was $6.3 billion. The operating income saw a decline due to higher operating expenses. Operating expenses increased to $24.0 billion from $23.5 billion, driven by network modernization efforts and higher depreciation costs. Cash from operating activities was $9.1 billion, down $0.8 billion year-over-year. Capital expenditures were $4.4 billion, with a total capital investment of $4.9 billion. Free cash flow was $4.6 billion, up $0.4 billion from the previous year.
Source: 2Q24_ATT_Earnings
Operational Performance
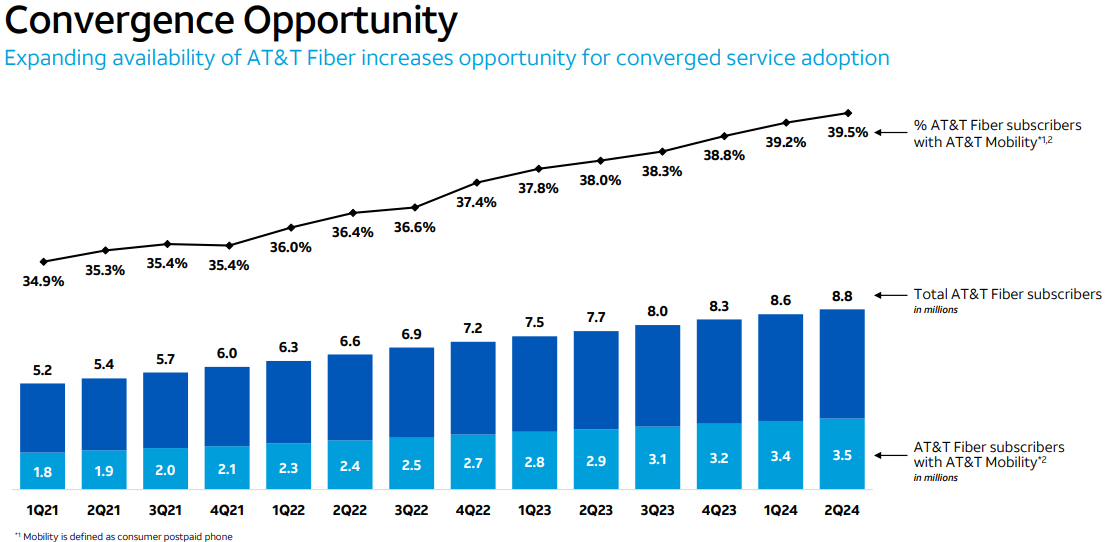
Mobility service revenues grew by 3.4% to $16.3 billion. AT&T Fiber added 239,000 net subscribers, marking the 18th consecutive quarter with over 200,000 net adds. Consumer broadband revenues increased by 7% to $2.7 billion. AT&T continues to lead in converged connectivity, with nearly 40% of AT&T Fiber households also opting for AT&T wireless services. Postpaid phone net adds totaled 419,000, with an industry-leading postpaid phone churn rate of 0.70%. AT&T continues to expand its fiber network through partnerships, such as the Gigapower joint venture and capital-light arrangements with other commercial fiber network providers.
Source: 2Q24_ATT_Earnings
Technological Advancements and Innovations
AT&T Internet Air is gaining traction, with nearly 350,000 total consumer subscribers, including 139,000 added in Q2 2024. Significant investments in 5G and fiber infrastructure continue, with ongoing network modernization efforts including Open RAN technology. AT&T Fiber now passes 27.8 million consumer and business locations, with a target to exceed 30 million by the end of 2025. The company has made substantial progress in integrating 5G and fiber services, leading to improved customer penetration and market share in areas where both services are offered.
B. T Stock Price Performance
AT&T stock price showed a notable 11.17% increase over the quarter, moving from $17.19 to $19.11, with highs and lows at $19.13 and $15.94, respectively. This performance outstripped major indices, with the S&P 500's price return at 3.85% and the NASDAQ's at 7.67%. Despite its substantial market cap of $137.022 billion, AT&T's stock demonstrated relative strength, outperforming broader market benchmarks.
Source: tradingview.com
II. T Stock Forecast: Outlook & Growth Opportunities
A. Segments with Growth Potential
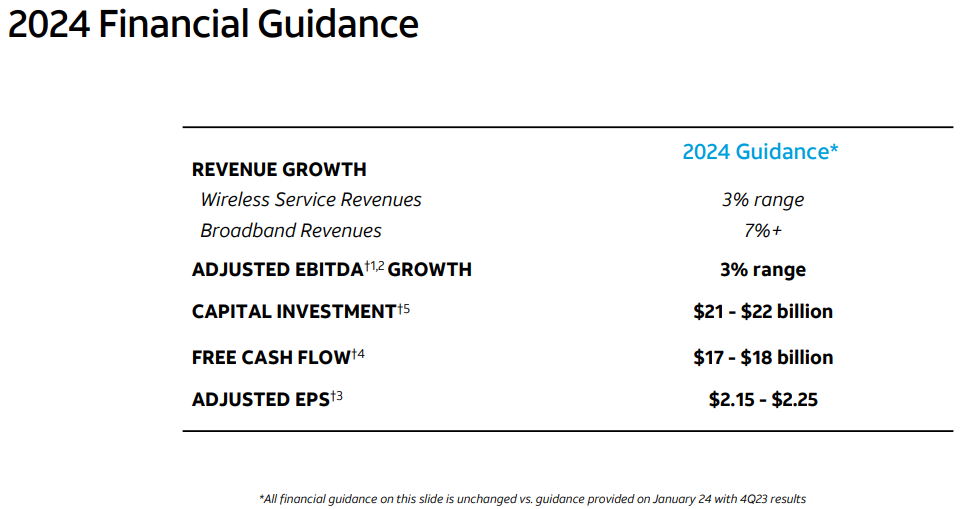
AT&T's 2024 growth trajectory is largely driven by its strategic focus on expanding its 5G and fiber networks. For 2024, the top-line growth in Wireless and Broadband will be 3% and 7% annually.
Source: 2Q24_ATT_Earnings
Key segments with significant growth potential include:
Mobility: AT&T continues to enhance its wireless services, delivering 419,000 postpaid phone net adds in Q2 2024, surpassing last year's pace. The Mobility segment's EBITDA growth of 5.3% reflects robust service revenue growth and efficiency in operational costs. With the rollout of new devices and features, the company expects increased subscriber activity in the latter half of the year, reinforcing its market position.
Fiber Broadband: The Consumer Wireline segment's fiber business is a standout performer, adding 239,000 fiber subscribers in Q2 2024. AT&T's fiber footprint now covers nearly 28 million locations, targeting 30 million by the end of 2025. The focus on fiber expansion is underscored by a 7% growth in broadband revenues and 18% increase in fiber revenue, driven by higher ARPU of $69. This growth is bolstered by the early success of AT&T Internet Air, a fixed wireless service that has quickly gained traction.
Business Solutions: Although traditional voice services are declining, AT&T's Business Wireline segment is leveraging its 5G and fiber infrastructure to offer innovative solutions like FirstNet and AT&T Internet Air for business. This segment aims to capitalize on emerging markets and technology advancements, providing services such as Dynamic Defense, which enhances network security.
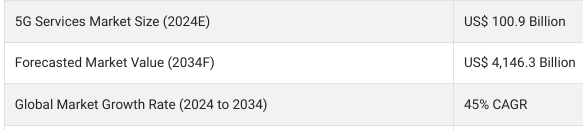
Source: factmr.com
B. Expansions and Strategic Initiatives
AT&T's growth strategy is anchored in several key expansions and initiatives:
Mergers and Acquisitions: The company's strategy includes scaling its Gigapower joint venture and forming capital-light partnerships with other fiber providers. These moves are designed to enhance fiber availability and accelerate the deployment of converged services across broader geographies. This approach not only extends AT&T's fiber reach but also reinforces its 5G and fiber convergence model.
Research and Development Investments: AT&T's commitment to innovation is evident in its substantial R&D investments, focusing on enhancing 5G technology and expanding fiber networks. The company's investment-led strategy has positioned it as the largest capital investor in U.S. connectivity infrastructure since 2019. This R&D push is critical in maintaining technological leadership and ensuring the scalability of its services.
Debt Reduction and Financial Flexibility: AT&T is also enhancing its financial health by reducing net debt, with a target of achieving a net-debt-to-EBITDA ratio of 2.5 times by mid-2025. This deleveraging effort, combined with robust free cash flow generation, strengthens AT&T's capacity to invest in growth while delivering shareholder value. The company's free cash flow guidance for 2024 is set between $17 billion to $18 billion, reinforcing its financial stability and growth prospects.
III. AT&T Stock Forecast 2024
A. AT&T Stock Forecast: Technical Analysis
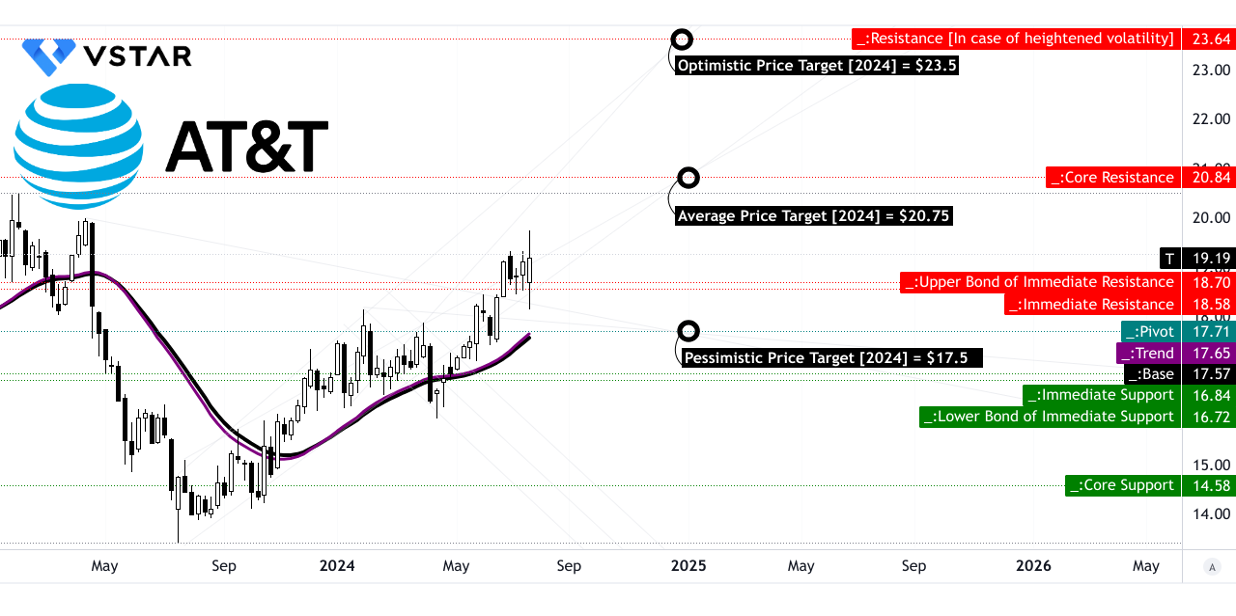
AT&T (NYSE: T) currently trades at $19.19. The stock's trendline, calculated using a modified exponential moving average, is $17.65, with a baseline of $17.57. These trend lines indicate a relatively stable price range, suggesting that AT&T has been moving within a narrow band recently.
- Average T Price Target by the end of 2024: Technicals project an average price target of $20.75 by the end of 2024. This target is derived from the momentum of change-in-polarity over the mid- to short-term, analyzed through Fibonacci retracement and extension levels. The projection indicates a moderate upside potential from the current price, considering the stock's recent movements.
- Optimistic T Stock Price Target: The optimistic scenario places the stock at $23.50. This is based on upward price momentum observed in current swings, again projected using Fibonacci levels.
- Pessimistic AT&T Stock Price Target: The pessimistic target is $17.50, grounded in the possibility of downward price momentum in current swings, assessed through Fibonacci analysis. This reflects a potential downside risk, acknowledging volatility and market fluctuations.
Support and Resistance Levels
- Primary Support: The primary support level is set at $18.70, providing a cushion against potential drops below the current price.
- Pivot of Current Horizontal Price Channel: The pivot is at $17.71, a critical level indicating where the stock might stabilize in the absence of strong directional moves.
- Core Resistance: Core resistance is at $20.84, marking a significant barrier to upward movement. In heightened volatility, resistance could be as high as $23.64.
- Support Levels: Other support levels include $16.84 and $14.58, indicating strong floors in case of significant downward movements.
Source: tradingview.com
Relative Strength Index (RSI)
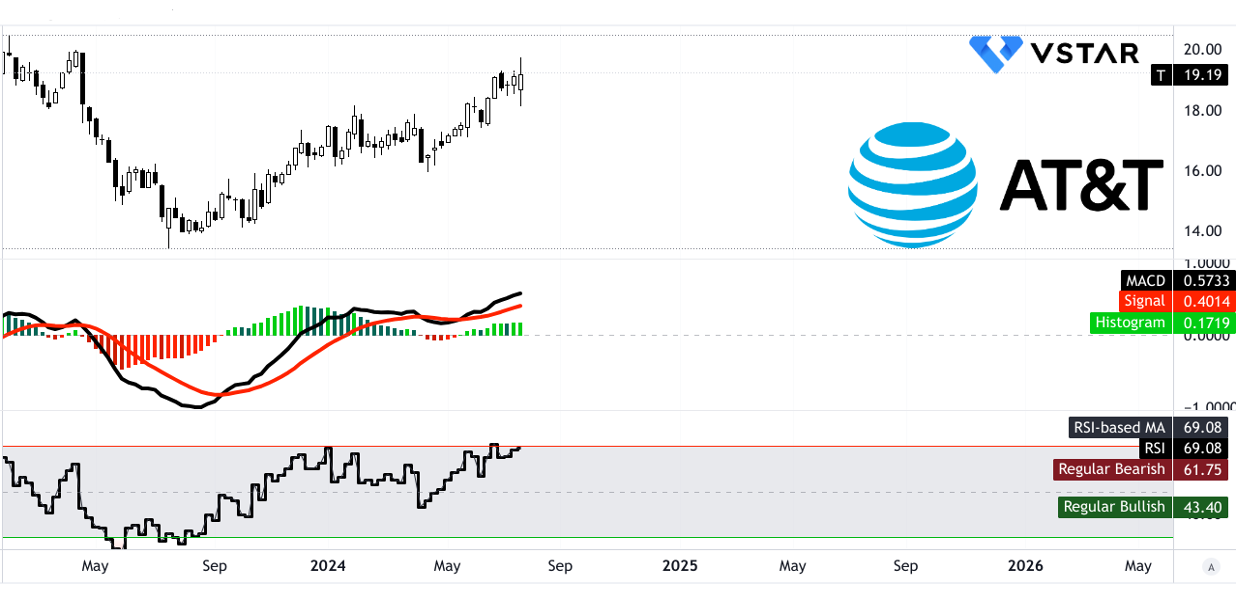
The RSI for AT&T stands at 69.08, close to the overbought threshold of 70, indicating that the stock may be slightly overbought. The regular bullish level is 43.40, while the bearish level is 61.75, suggesting a bearish divergence. The RSI line trend is sideways, indicating a neutral momentum in the stock's current state.
Moving Average Convergence/Divergence (MACD)
The MACD line is at $0.57, with the signal line at $0.40 and the MACD histogram at $0.17. These values suggest a bullish trend with a stabilized strength. The MACD analysis confirms a bullish sentiment but with a stable trend strength, implying cautious optimism.
Source: tradingview.com
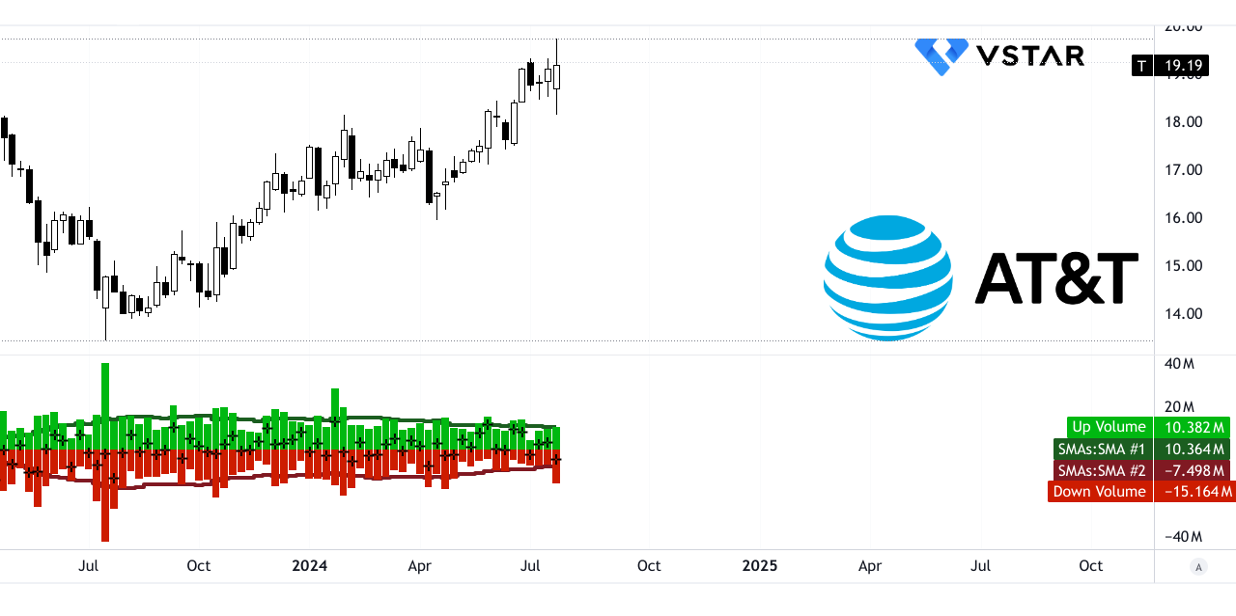
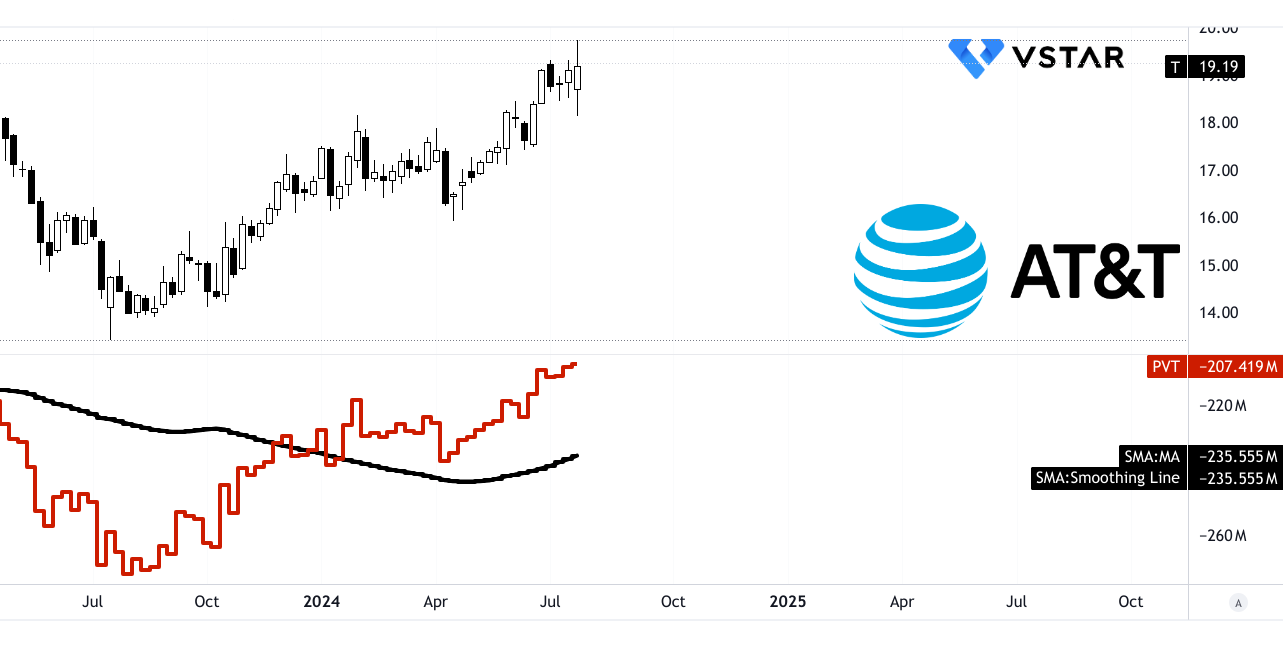
Price Volume Trend (PVT)
The PVT line is at -$207.42 million, with a moving average of -$235.56 million. Despite the negative values, the prevailing stock price volume momentum is bullish. This suggests that recent trading volume has been positive, despite the overall negative trend.
Volume Analysis
The moving average of up volume is $10.36 million, while the down volume is -$7.50 million, resulting in a volume delta of $2.87 million. This indicates a bullish volume momentum, with more buying activity than selling.
Source: tradingview.com
Source: tradingview.com
B. ATT Stock Forecast: Fundamental Analysis
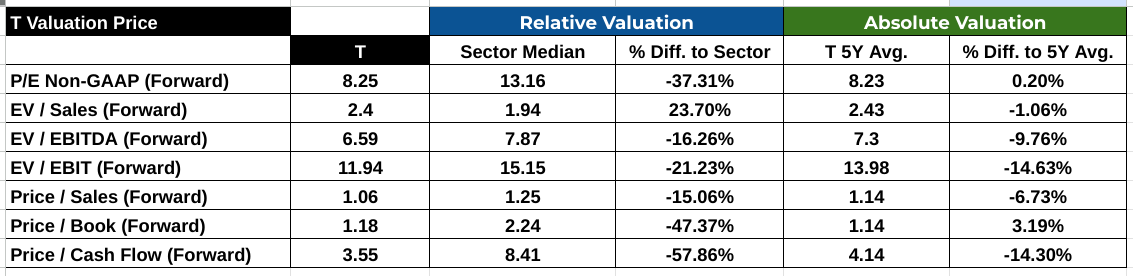
The Price-to-Earnings (P/E) ratio (Forward) stands at 8.25, significantly lower than the sector median of 13.16 by 37.31%, indicating that AT&T is undervalued relative to its peers. This could suggest potential for price appreciation, given the company's profitability. Comparatively, AT&T's P/E ratio is aligned with its 5-year average of 8.23, showing stability in valuation over time.
The Enterprise Value-to-Sales (EV/Sales) ratio (Forward) is 2.4, which is 23.70% higher than the sector median of 1.94. This indicates a premium valuation on the company's revenue generation capability. However, this metric is slightly lower than its 5-year average of 2.43, reflecting a slight undervaluation in recent times.
For the Enterprise Value-to-EBIT (EV/EBIT) ratio (Forward), AT&T's 11.94 is 21.23% lower than the sector median of 15.15, which again underscores undervaluation. This ratio is also below its 5-year average of 13.98, supporting the view of a potentially attractive entry point.
Source: Analyst's compilation
C. AT&T Stock Prediction: Market Sentiment
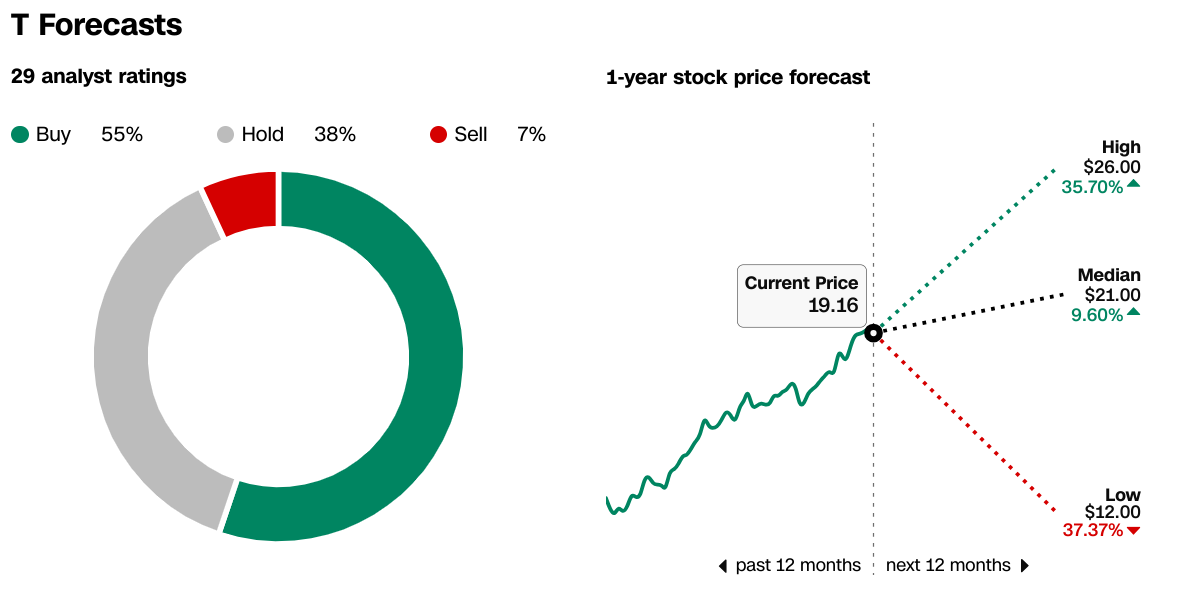
Market sentiment for AT&T is mixed. According to CNN, out of 29 analysts, 55% recommend buying, 38% hold, and 7% sell. The 1-year price forecast shows a high of $26.00 (35.70% upside), a median of $21.00 (9.60% upside), and a low of $12.00 (37.37% downside). The current price of $19.16 suggests moderate optimism.
Source:CNN.com
According to WSJ, recent analyst ratings have seen 12 buy recommendations, 4 overweight, 11 hold, and 2 sell, indicating a general preference for holding or cautiously buying the stock. The stock price target remains consistent with CNN's forecast: a high of $26.00, a median of $21.00, and a low of $12.00, with an average target of $20.49.
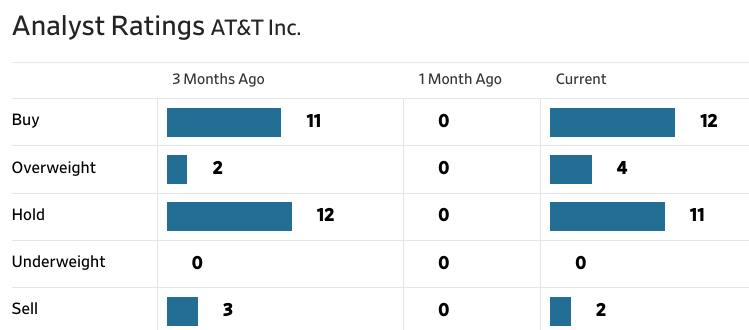
Source:WSJ.com
Investor Confidence, Institutional Holdings, Short Interest
Investor confidence appears stable, with institutional holdings accounting for 57.90% of the total shares outstanding, which is 7,170 million shares, valued at approximately $79.543 billion. This substantial institutional ownership indicates strong professional investment interest in AT&T, which often translates to perceived long-term stability and potential.
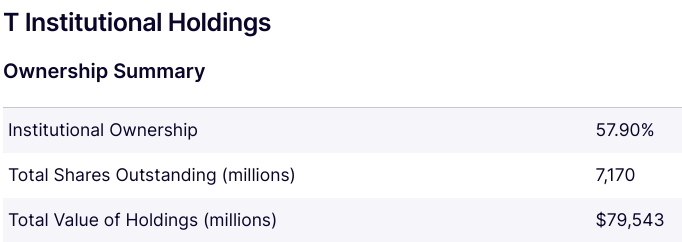
Source:Nasdaq.com
Short interest in AT&T is relatively low at 1.57% of the total shares outstanding, with 112.27 million shares sold short. The days to cover ratio is 2.84, indicating a moderate level of short interest which does not significantly impact market sentiment negatively. This suggests that most investors do not expect the stock to decline sharply in the near term.
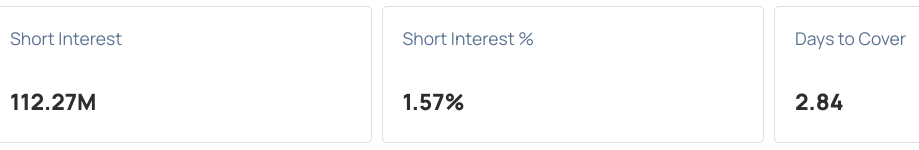
Source:Benzinga.com
IV. T Stock Forecast: Challenges & Risk Factors
AT&T operates in a highly competitive telecommunications industry where several formidable competitors pose significant challenges.
Verizon Communications Inc. (NYSE: VZ): Verizon, one of the largest telecommunications companies in the U.S., competes directly with AT&T in wireless services, broadband, and digital media. Verizon's strong network infrastructure and extensive customer base provide a solid competitive edge. Verizon's focus on expanding its 5G network and strategic acquisitions in digital media, like the purchase of Yahoo, further intensify the competition.
T-Mobile US (NASDAQ: TMUS): T-Mobile, known for its aggressive pricing strategies and innovative service offerings, has gained substantial market share, particularly after its merger with Sprint. This merger has significantly bolstered T-Mobile's spectrum portfolio and network capacity, allowing it to compete more effectively against AT&T in both urban and rural markets. T-Mobile's emphasis on customer satisfaction and 5G expansion makes it a formidable competitor.
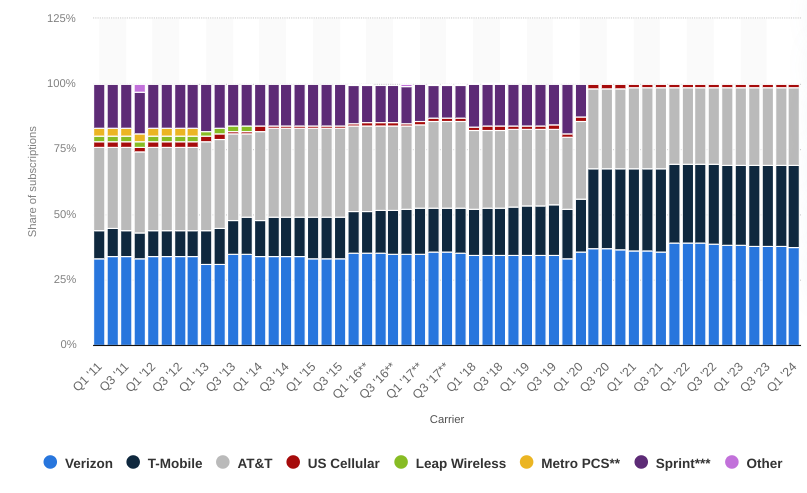
[Wireless network operator subscriptions market share in the United States from 2011 to 2024, by quarter]
Source: Statista.com
Other Risks
Financial Stability and Debt Levels: AT&T's substantial debt load, accumulated through acquisitions like Time Warner and DirecTV, poses a significant financial risk. High debt levels can limit the company's ability to invest in new technologies, reduce operational flexibility, and increase vulnerability to interest rate fluctuations. Effective debt management is crucial to maintain financial stability.
In conclusion, AT&T's Q2 2024 showed mixed performance with revenue slightly down t and a decrease in net income. Despite challenges, AT&T's stock increased over the quarter outperforming major US market indexes. Technical outlook is positive. The company's focus on expanding 5G and fiber networks is expected to drive growth, supported by strategic partnerships and R&D investments. However, high debt levels and competition from Verizon and T-Mobile remain significant risks. For those interested in trading AT&T stock CFDs, the VSTAR trading app offers a regulated, institutional level experience, and user-friendly platform with low costs and deep liquidity, ideal for both beginners and experienced traders.