EURUSD
Fundamental Perspective
The EUR/USD pair started weak in October, declining to 1.0958, driven by robust US employment data that boosted the US dollar. This positive data reduced market expectations for aggressive Federal Reserve rate cuts while escalating Middle East tensions pushed investors toward safe-haven assets, further supporting the Greenback. Oil prices spiked amid concerns over potential supply disruptions, creating pressure on global stock markets.
US employment data exceeded forecasts, with September's Nonfarm Payrolls showing 254K new jobs and unemployment dropping to 4.1%. Other key indicators, including the ADP private jobs report and an improved ISM Services PMI, pointed to a resilient US economy. As a result, market bets on a 50 bps Fed rate cut fell sharply, with most anticipating a more minor 25 bps reduction.
In the Eurozone, inflation pressures eased, with Germany's HICP falling and the broader EU index dipping to 1.8% annually. However, weak economic growth indicators, including a marginal rise in the EU Composite PMI to 49.6, kept the Euro downward.
Attention will be on key US releases, including September's CPI and FOMC meeting minutes, while the Eurozone calendar will highlight retail sales data and the ECB's meeting accounts. However, no major policy shifts are anticipated.
Technical Perspective
The weekly candle finished with a long red candle, erasing the previous six weeks' gains leaves sellers optimistic for this week.
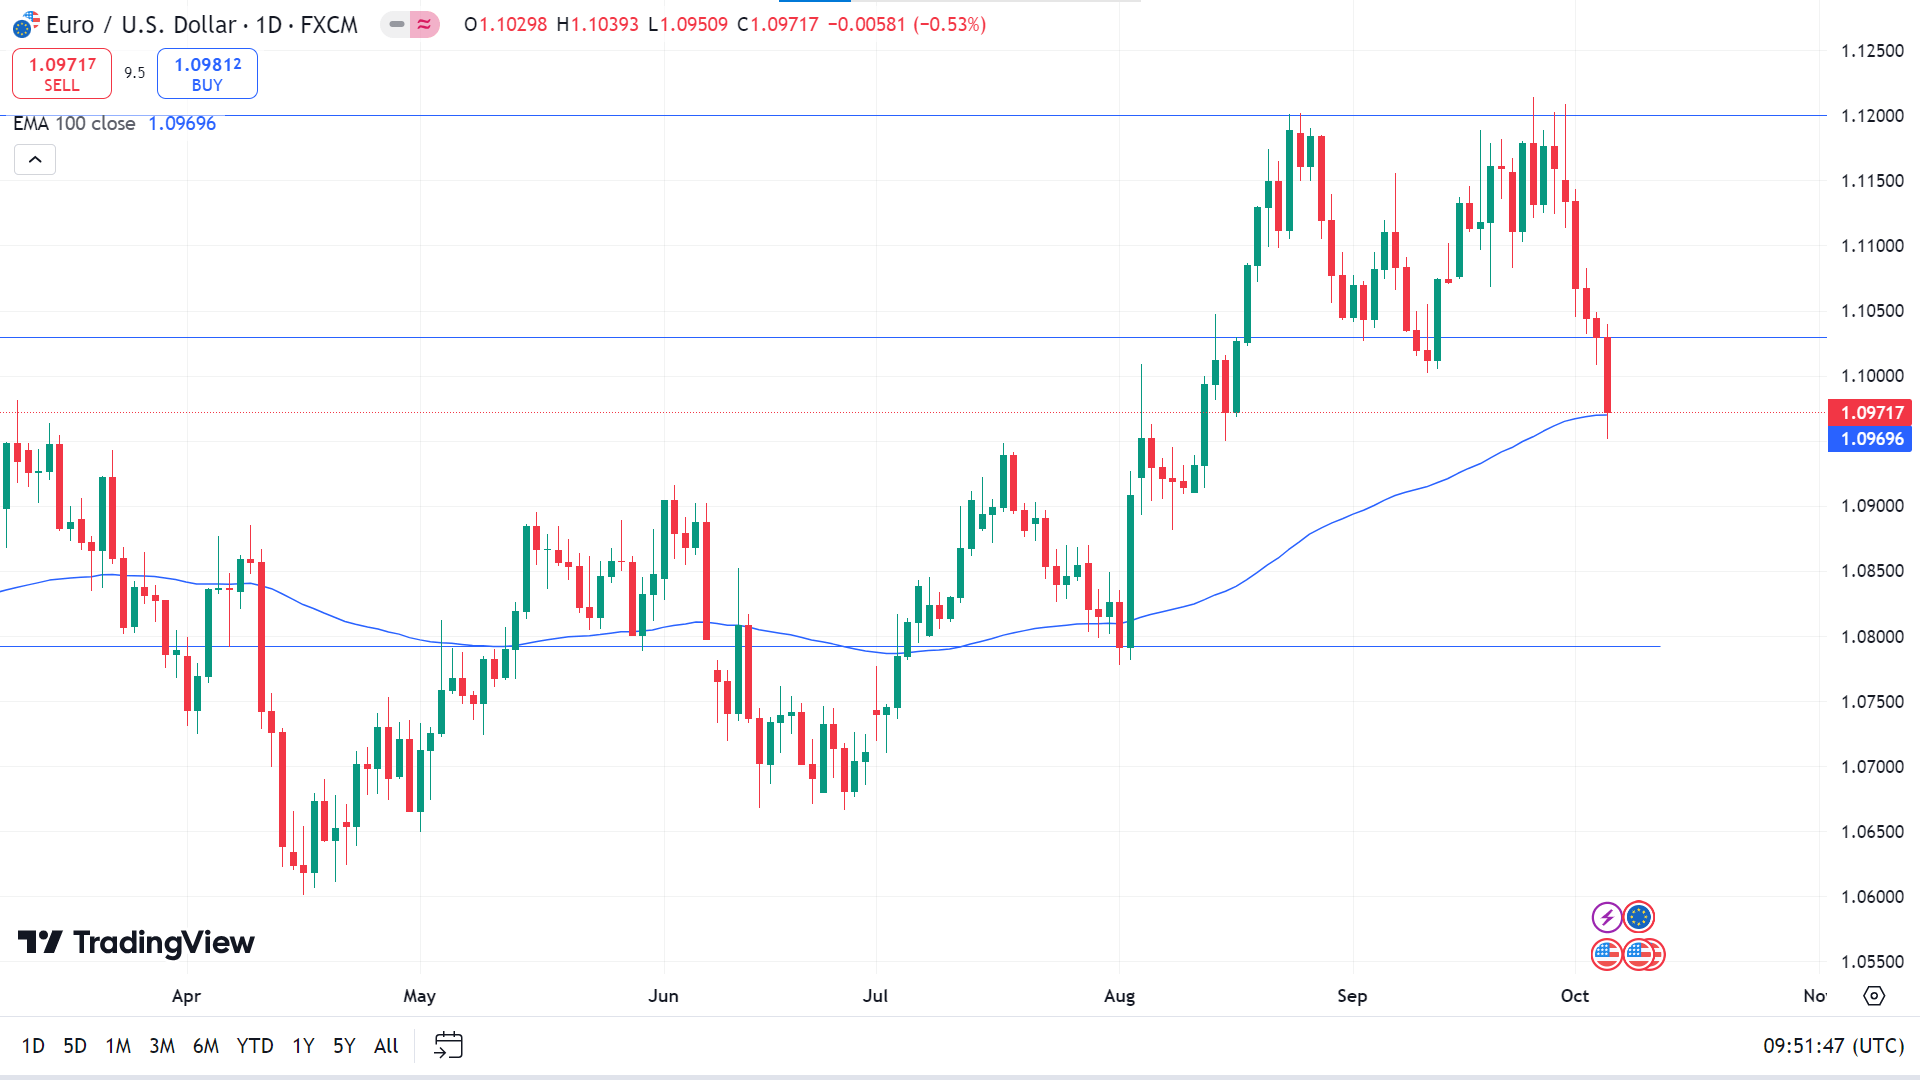
Due to recent bearish pressure, the price declined back to the EMA 100 line on the daily chart. If the dynamic support sustains the price, it can head to the possible neckline of a double top pattern to the 1.1030 level before further decline, and an acceptable breakout of that level can trigger the price to regain the next possible resistance of 1.1197.
Meanwhile, if the price continues declining below the EMA 100 line, it can reach the nearest support of 1.0894, followed by the next support near 1.0792.
GBPJPY
Fundamental Perspective
Following remarks from Japan's leadership, the Japanese Yen (JPY) weakened last week. Prime Minister Shigeru Ishiba reiterated that Japan's primary economic focus is overcoming deflation, with economic growth being crucial for fiscal stability. He committed to swiftly introducing a financial package aimed at alleviating rising household costs and emphasized the importance of balancing diplomacy with military strength in regional security.
Ishiba also highlighted the need for stronger alliances with like-minded countries alongside Japan's relationship with the United States. Economy Minister Ryosei Akazawa echoed these priorities, confirming the government's alignment with the Bank of Japan (BoJ) on the 2% inflation target while stressing that monetary policy adjustments must be carefully timed to aid Japan's exit from deflation. Chief Cabinet Secretary Yoshimasa Hayashi added that a supplementary budget would be presented to Parliament after the lower house election.
In the UK, dovish remarks from Bank of England (BoE) Governor Andrew Bailey on Thursday led to a Pound Sterling selloff. Bailey hinted at potential rate cuts if inflation improves further, causing UK money markets to price in 42 bps of cuts for 2024. However, BoE Chief Economist Huw Pill's more cautious stance on Friday helped stabilize the currency.
Technical Perspective
The weekly chart shows intense bullish pressure through the solid green candle, which suggests that the next candle might be another green one.
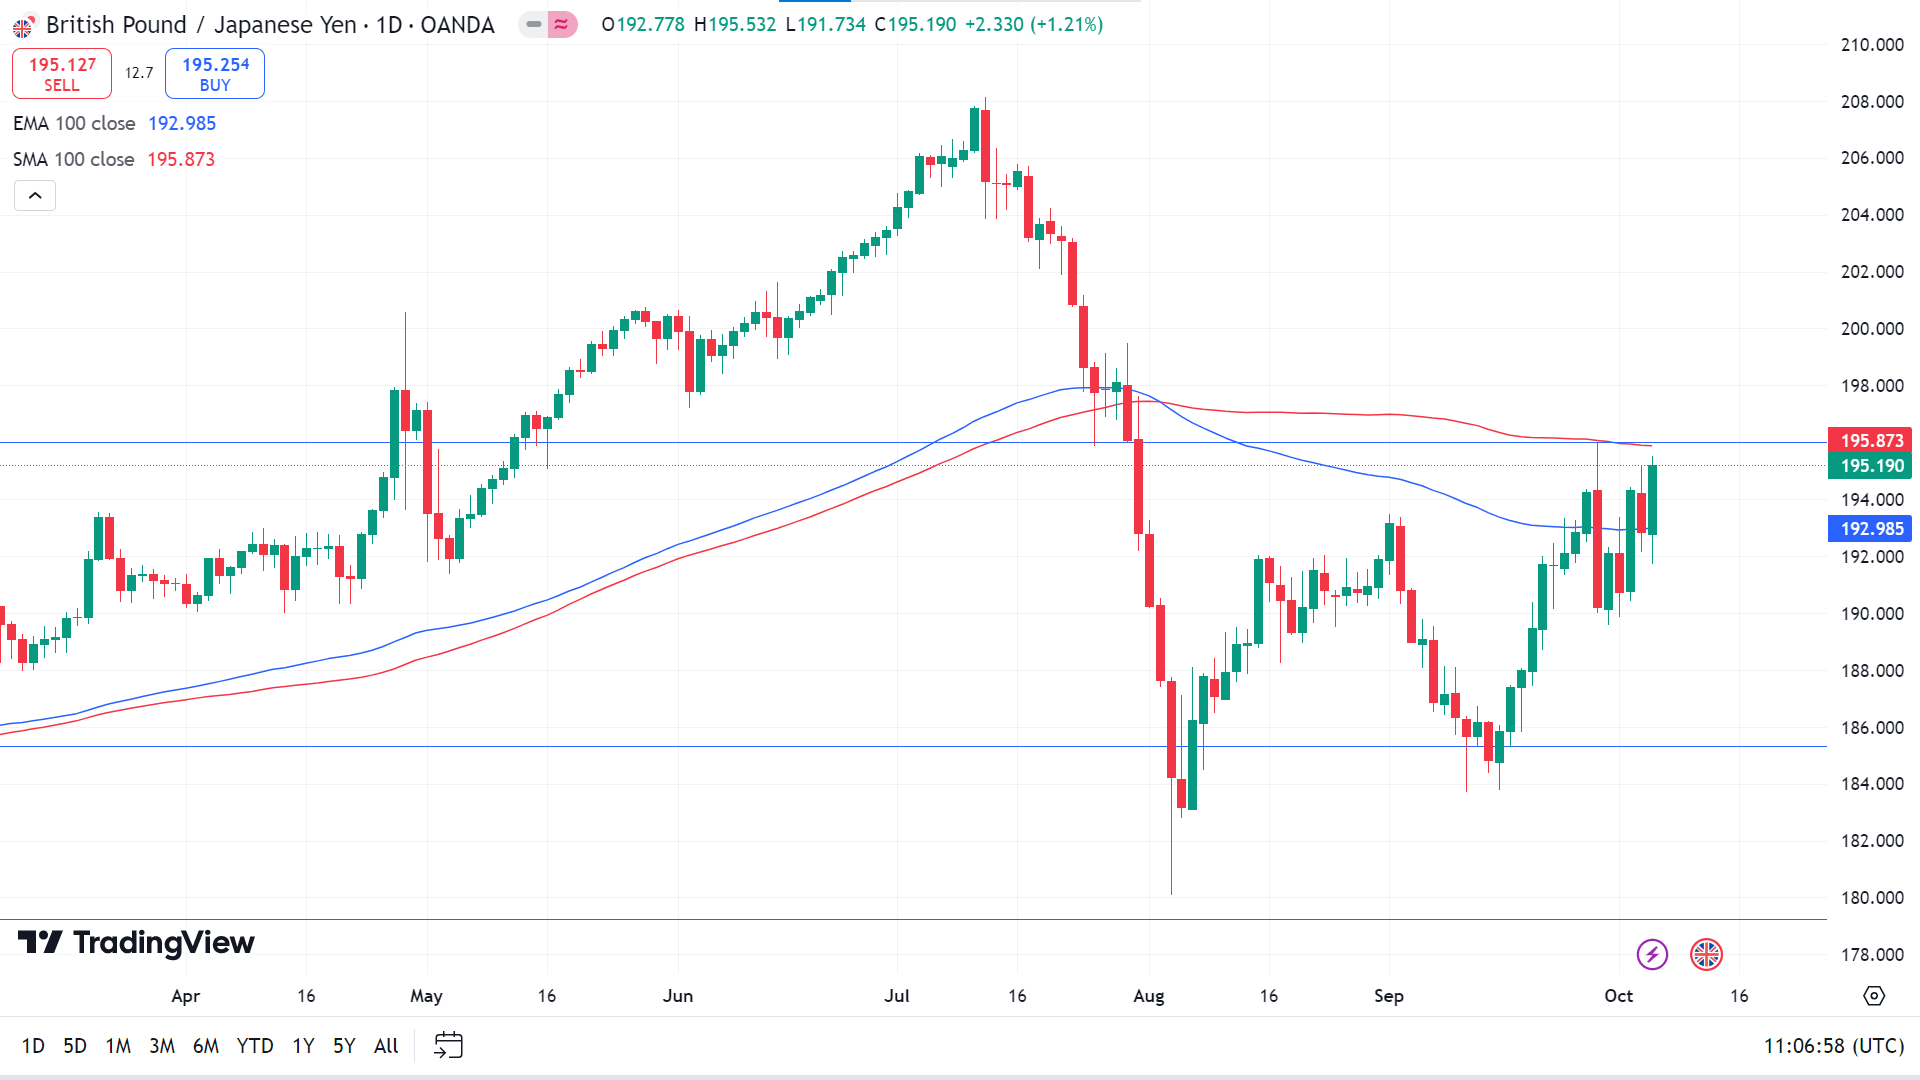
The price is floating between the SMA 100 and EMA 100 lines, which reflects a mixed signal. The zone is declared an essential level that may indicate the next price direction. If the price exceeds the SMA 100 line, it will declare a significant positive force on the asset price, which might drive the price toward the primary resistance of 198.17, followed by the next resistance near 202.85.
Meanwhile, if the price drops below the EMA 100 line, declaring sufficient bearish pressure, it may trigger the price toward the nearest support of 189.84, followed by the next support near 185.330.
Nasdaq 100 (NAS100)
Fundamental Perspective
The S&P 500 surged 0.2% for the week, while Nasdaq and Dow ticked 1% each. The United States added 254,000 nonfarm payrolls in September, while the Bloomberg survey anticipated 150,000 job additions. Meanwhile, the unemployment rate dropped to 4.1%, compared to 4.2% in August, beating market anticipations.
The Fed had a rate cut of 50-basis points last month to 4.75% to 5%. However, the stronger-than-expected jobs report reduces the likelihood of another large cut. Oxford Economics expects the Fed to implement two more minor 25-basis-point reductions in November and December.
The CME FedWatch tool showed that the odds of a 25-basis-point rate cut by the Federal Open Market Committee (FOMC) in November surged to 98% on Friday, up from 68% the day before. Meanwhile, the likelihood of a 50-basis-point cut dropped to zero from 32%.
In the bond market, the US two-year yield surged 21.4 basis points to 3.93%, while the 10-year yield increased 11.9 basis points to 3.97%, reflecting the market's response to the strong employment report.
Technical Perspective
The weekly chart creates a delicate bullish pattern, which leaves buyers optimistic for the upcoming week.
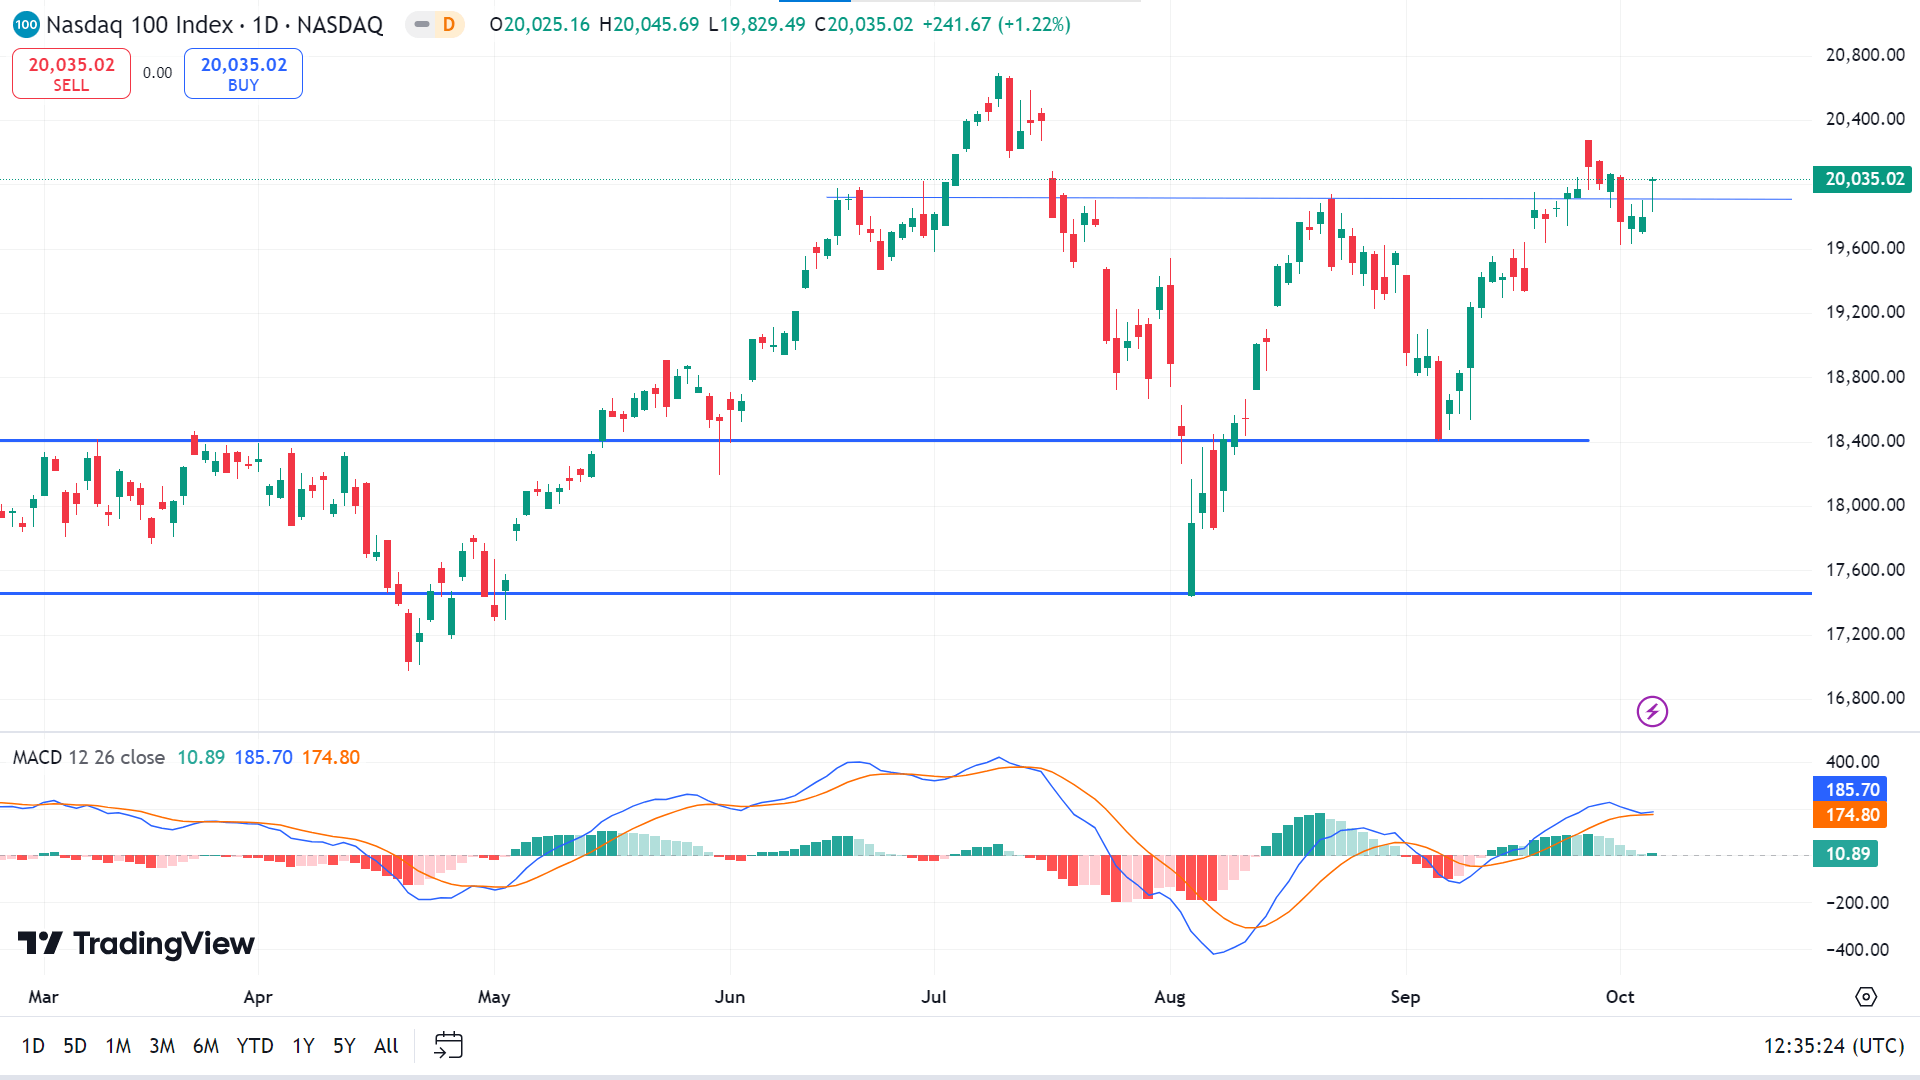
The MACD indicator window confirms the price is on a bullish trend through the green histogram bars and signal lines floating above the midline of the indicator window. If the bullish pressure is sustained, the price can hit the nearest resistance of 20,293.55, followed by the next resistance of 20,735.42.
Meanwhile, the green histogram bars are fading, and the signal lines are getting closer. If the MACD dynamic signal lines create a bearish crossover and histogram bars are fading, bulls may lose power, indicating the price may head to reach the primary support of 19,431.95, followed by the next support near 18,582.34.
S&P 500 (SPX500)
Fundamental Perspective
The S&P 500 increased 0.2% this week, supported by a Friday rally after September jobs data helped offset a slow start to October. The index closed at 5,751.07, marking its fourth consecutive weekly gain and nearing last week's record of 5,767.37 with an intraday high of 5,753.21.
The S&P 500 ended September on Monday with a 2% increase for the month and a 5.5% increase in Q3, bringing its year-to-date growth to nearly 21%. Much of the index's Q3 surge was driven by optimism about a Federal Reserve rate cut, which was realized in September. Now, market attention shifts to economic data and corporate earnings to assess the Fed's potential actions in November.
In September, nonfarm payrolls exceeded expectations, surging by 254,000 versus the forecasted 150,000, while the unemployment rate dropped to 4.1%.
Sector performance varied, with energy surging 7%, bolstered by rising oil prices. Diamondback Energy saw a 14% increase following analyst upgrades. Communication services rose 2.2%, led by a 5% jump in Meta Platforms. On the downside, materials fell 2%, and real estate declined 1.9%, with consumer staples, discretionary, and healthcare sectors also showing losses.
Technical Perspective
The weekly chart pattern confirms a robust bullish uptrend and indicates the next candle might be another green one.
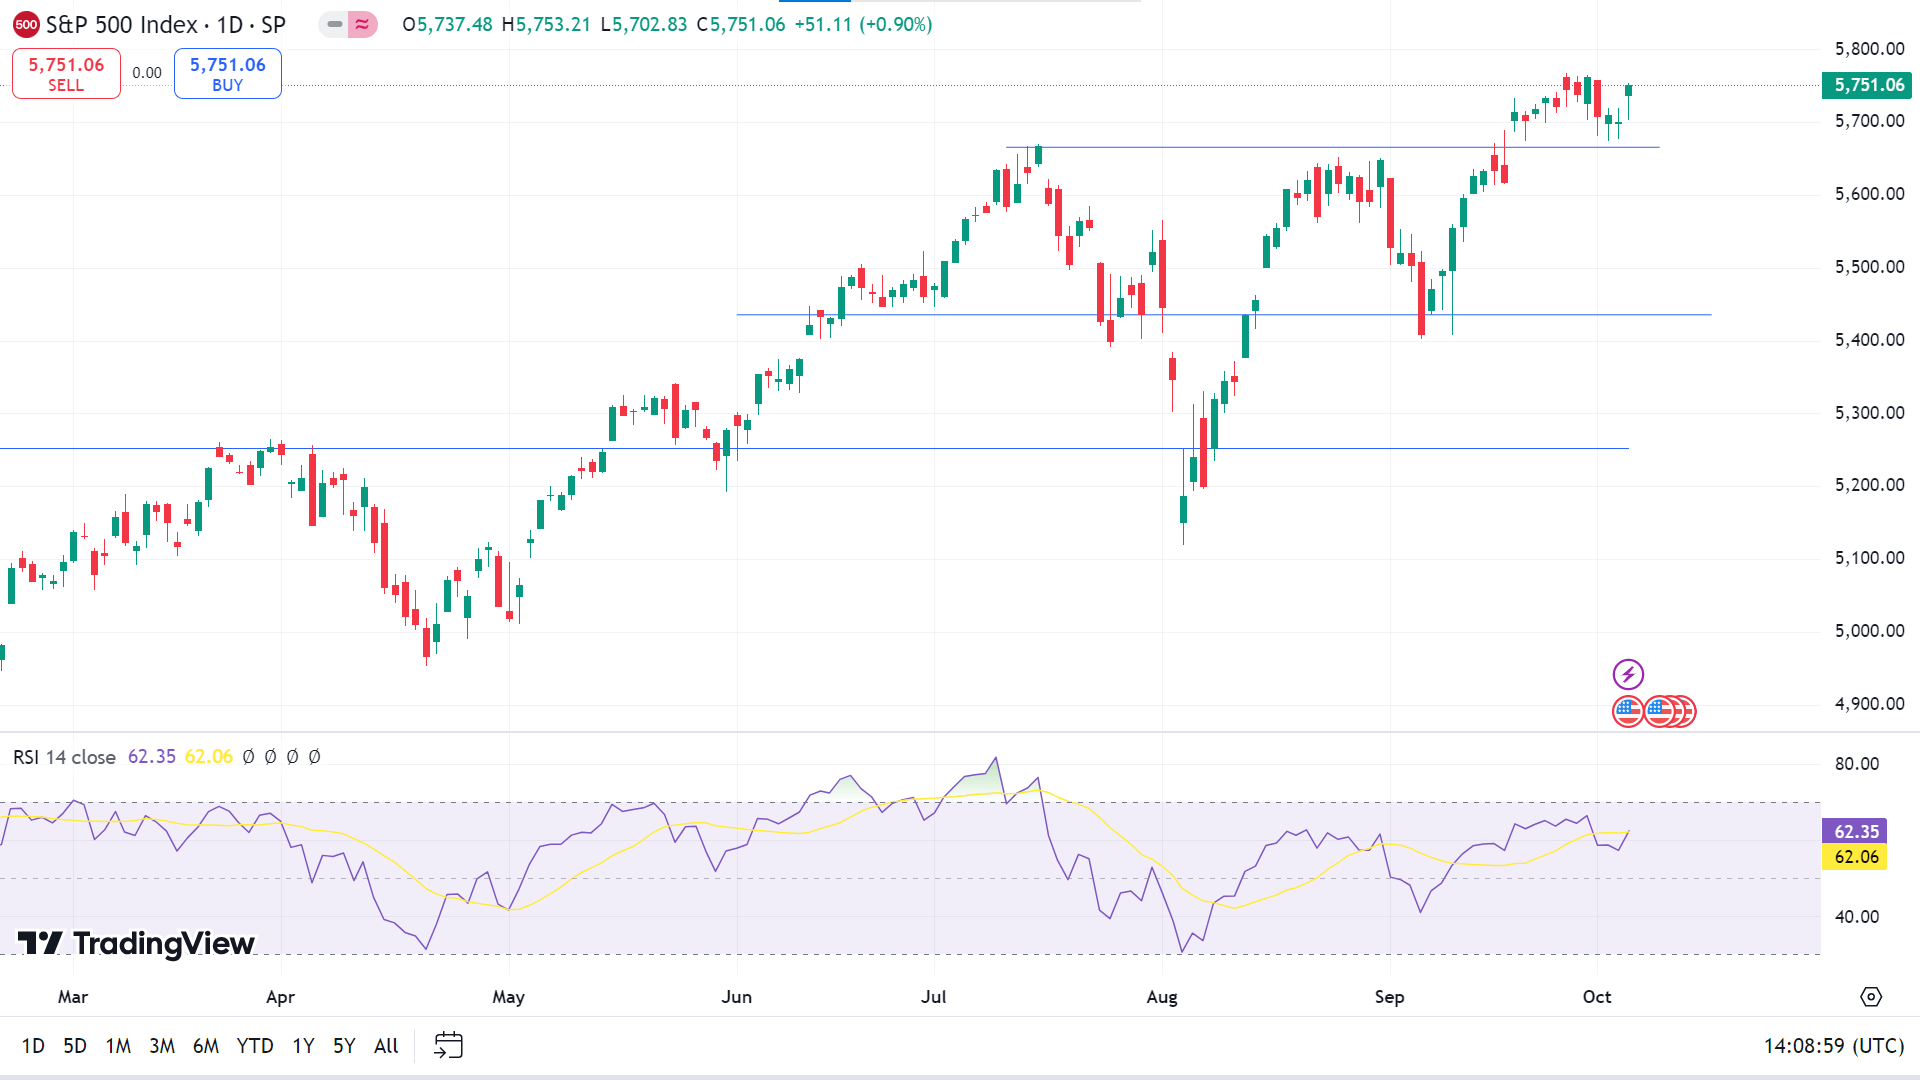
The price reaches near the ATH on the daily chart, and the RSI indicator window confirms the current bullish pressure through the dynamic signal line edging upside on the indicator window. A breakout above the current ATH may trigger the price to hit the nearest resistance, 5,869.58, followed by the next resistance near 6,008.91.
Meanwhile, suppose the price declines from this level or loses bullish pressure, and the RSI dynamic line edges lower toward or below the midline of the indicator window. In that case, it can hit the primary support of 5,641.48 before bouncing back, whereas the next possible support is near 5,504.83.
Gold (XAUUSD)
Fundamental Perspective
Gold prices dropped after a stronger-than-expected US jobs report pointed to a solid labor market, suggesting the Federal Reserve may gradually approach 25-basis-point rate cuts.
The US Bureau of Labor Statistics reported a strong September job market, alleviating pressure on the Fed, which had already cut borrowing rates by 50 basis points in September to support its employment goals. The unemployment rate fell, and average hourly earnings showed mixed results, with a monthly decrease and an annual increase.
The market reacted by pushing the US 10-year Treasury yield up by 12 basis points to 3.971%, the highest level since August, which limited gold's gains. The US Dollar Index also strengthened, rising 0.63% to reach 102.58, its highest point since mid-August.
The jobs data has reinforced market expectations for a 25-basis-point rate cut at the Fed's November meeting, with only a tiny percentage anticipating unchanged rates.
Upcoming US data on inflation, jobless claims, and consumer sentiment will be closely watched. Meanwhile, ongoing geopolitical tensions in the Middle East involving Hezbollah, Iran, Israel, and the US may limit gold's downside and could push XAUUSD toward the $2,700 level.
Technical Perspective
The weekly chart illustrates a doji after some green candles reflect a pause in the current uptrend. The next candle will probably be another green one.
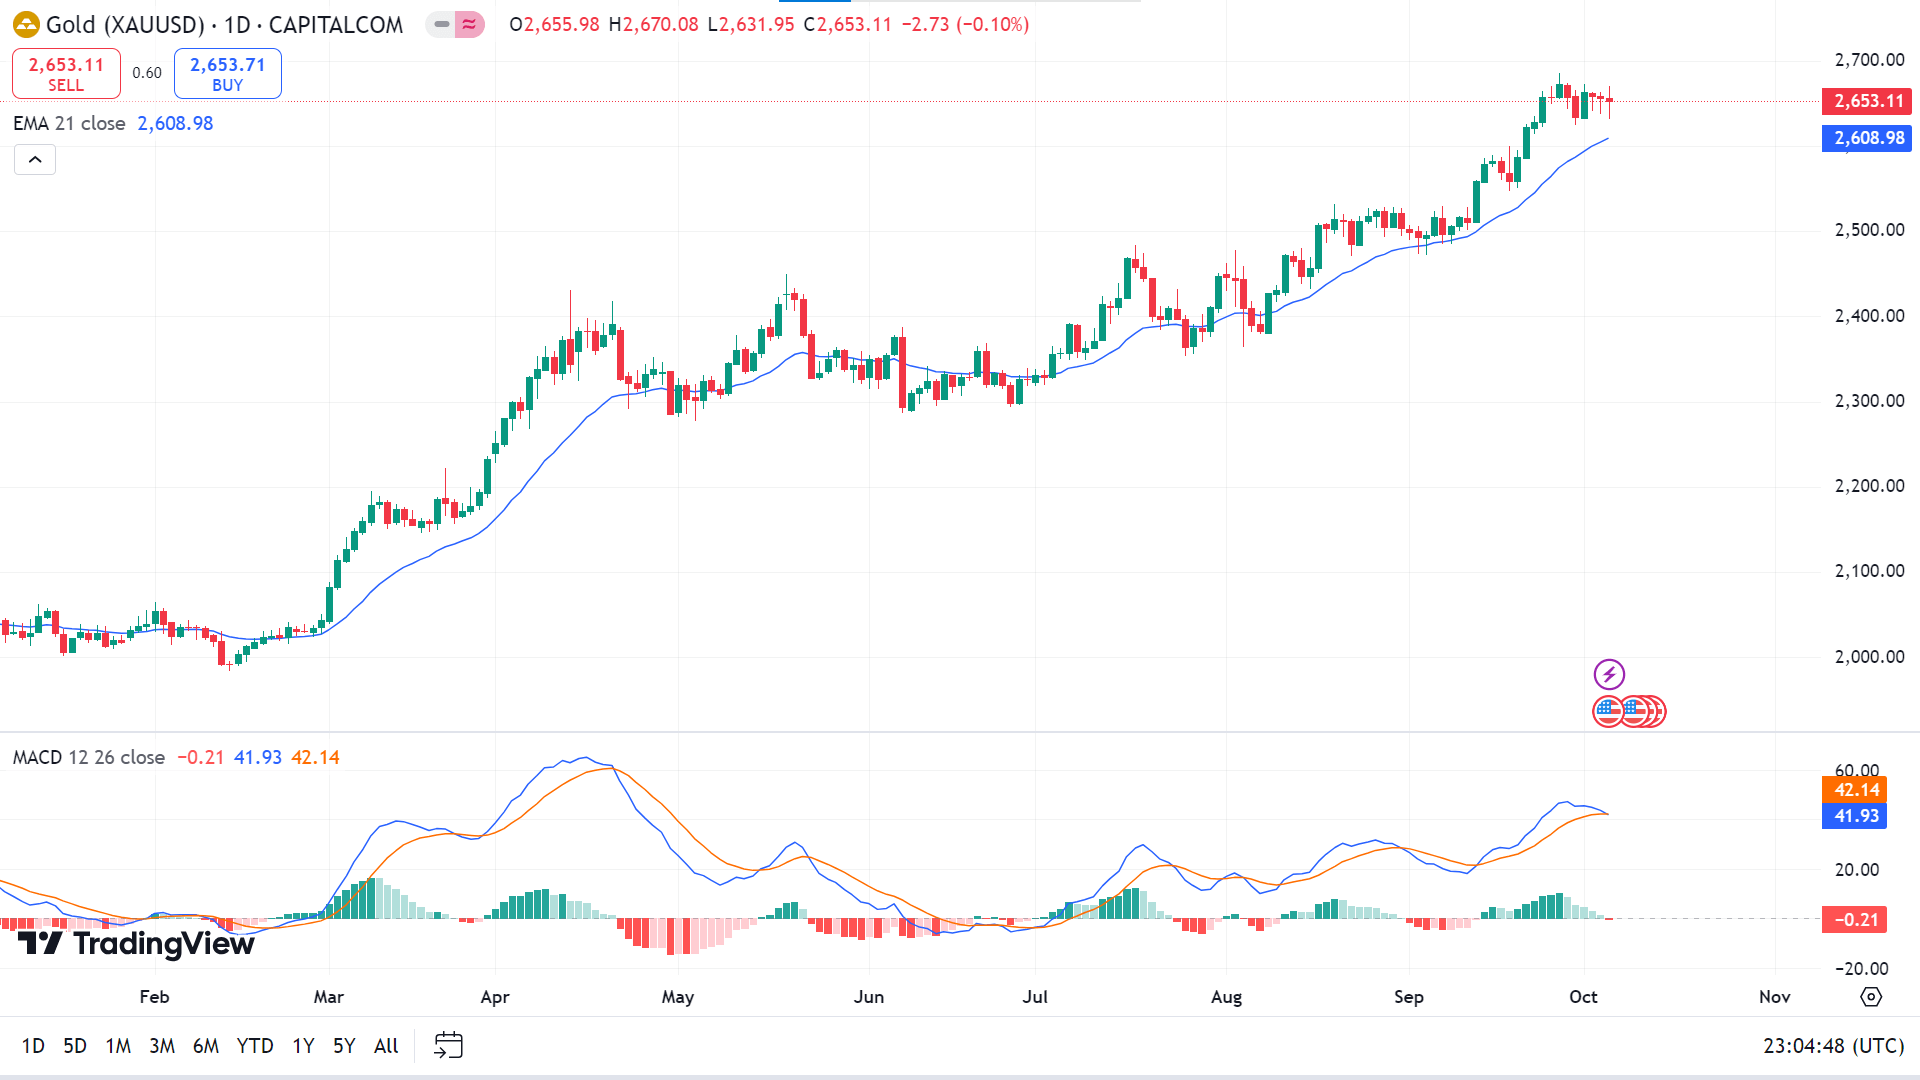
The price above the EMA 21 line declares recent bullish pressure on the asset price, while the MACD indicator shows the opposite. The price remains above the EMA 21 line, and MACD readings remain in bullish territory; it may hit the nearest resistance near 2,679.05, whereas a breakout might drive the price toward the next possible resistance near 2,729.47.
Meanwhile, following the MACD indicator readings, if the dynamic signal lines continue to decline further, red histogram bars appear, and the price drops below the EMA 21 line, it can hit the nearest support, which is near 2,586.99, or further below the next support near 2,515.79.
Bitcoin (BTCUSD)
Fundamental Perspective
This week, Bitcoin (BTC) fell over 6%, influenced by escalating tensions between Iran and Israel and declining institutional demand for Bitcoin ETFs. ETF outflows totaled more than $280 million, contributing to the market's decline. Analysts warn that Bitcoin's price could drop further if the conflict intensifies, potentially reaching $55,000.
The decline started with a 3.5% drop on Monday, likely due to reduced U.S. Bitcoin Spot ETFs inflows. On Tuesday, Bitcoin lost another 4% following Iran's missile strikes on Israel, which came in response to Israel's recent attacks on Lebanon, which triggered a wave of liquidations across the broader crypto market, totaling $500 million, with $140 million in Bitcoin alone.
QCP Capital suggests that if the geopolitical situation worsens, Bitcoin may see further declines. Tuesday saw a significant $240.6 million ETF outflow, followed by another $52.9 million on Wednesday.
Historically, Bitcoin behaves like traditional risk assets in the short term during geopolitical crises but has demonstrated greater long-term resilience, often outperforming Gold and the S&P 500. By the end of the week, Bitcoin steadied near $60,000, although continued ETF outflows highlight subdued institutional demand.
Technical Perspective
The BTCUSD pair ended the week in the red, losing previous weeks' gains and enabling selling opportunities. This suggests that the next candle might be another red one.
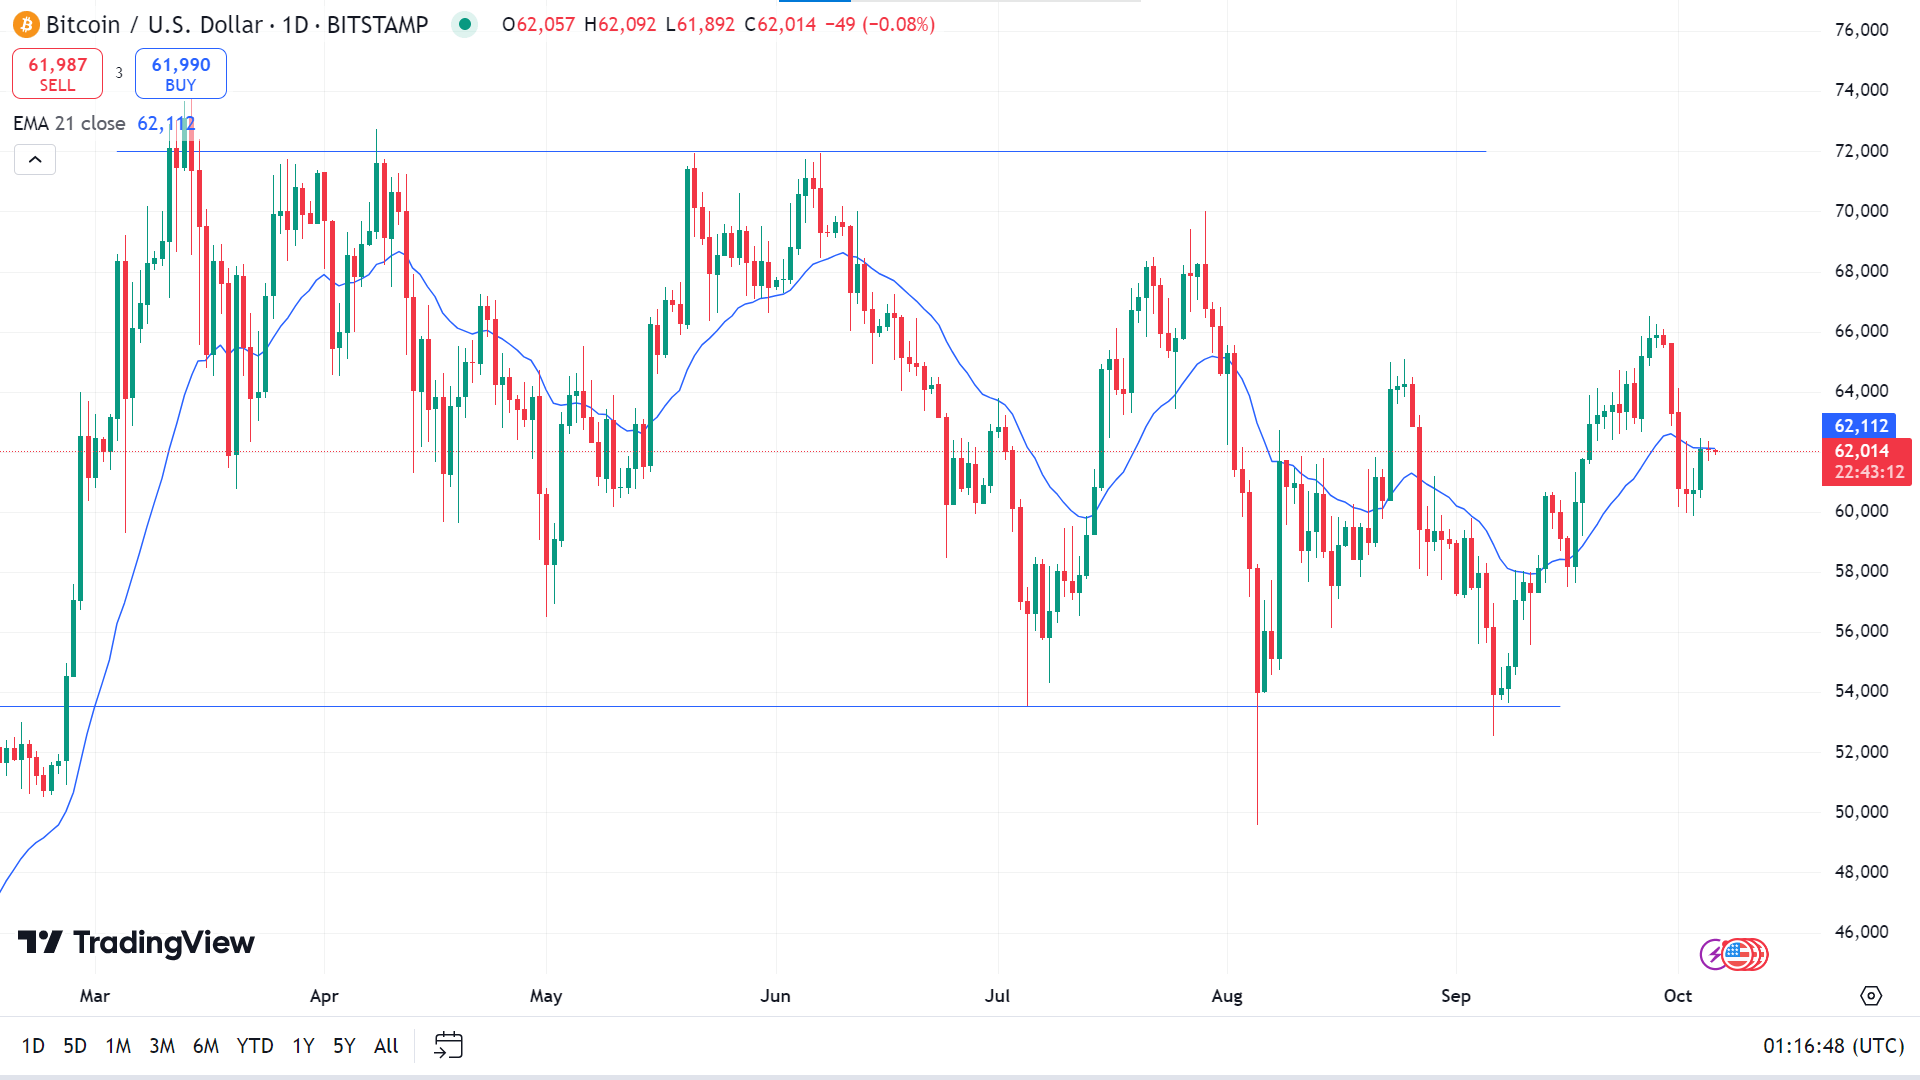
When writing, the price is moving closer to the EMA 21 line at the daily chart; if the asset exceeds the dynamic line, it can hit the nearest resistance of 65,048, followed by the next resistance near 68,248.
Meanwhile, if the price declines and continues to float below the EMA 21 line, it may head to reach the primary support near 59,958, followed by the next acceptable support of 55,452.
Ethereum (ETHUSD)
Fundamental Perspective
Ethereum's Net Unrealized Profit/Loss (NUPL) is currently at 0.29, indicating that while many ETH holders remain profitable, market sentiment is cautious. NUPL gauges unrealized gains or losses by comparing Ethereum's current price to its last transaction price. A higher NUPL points to optimism, while a lower one signals rising losses and potential selling pressure. NUPL peaked at 0.36 throughout September but has since dropped, reflecting failed recovery attempts and weakening confidence.
This decline suggests that many holders are now at a loss, potentially pushing the market toward a bearish outlook unless a strong catalyst emerges.
Additionally, whale activity has softened. The number of addresses holding at least 1,000 ETH peaked at 5,628 on September 25, signaling accumulation. However, the count has since slightly declined to 5,606, indicating caution rather than an aggressive sell-off. While this reduction in whale holdings signals some hesitation, it does not suggest a broad market exit or heightened volatility.
Overall, the market remains uncertain, with whales taking a cautious "wait-and-see" approach as confidence weakens but without triggering significant price disruptions.
Technical Perspective
The weekly chart confirms the recent bearish pressure through the last red candle, leaving sellers optimistic for the next week.
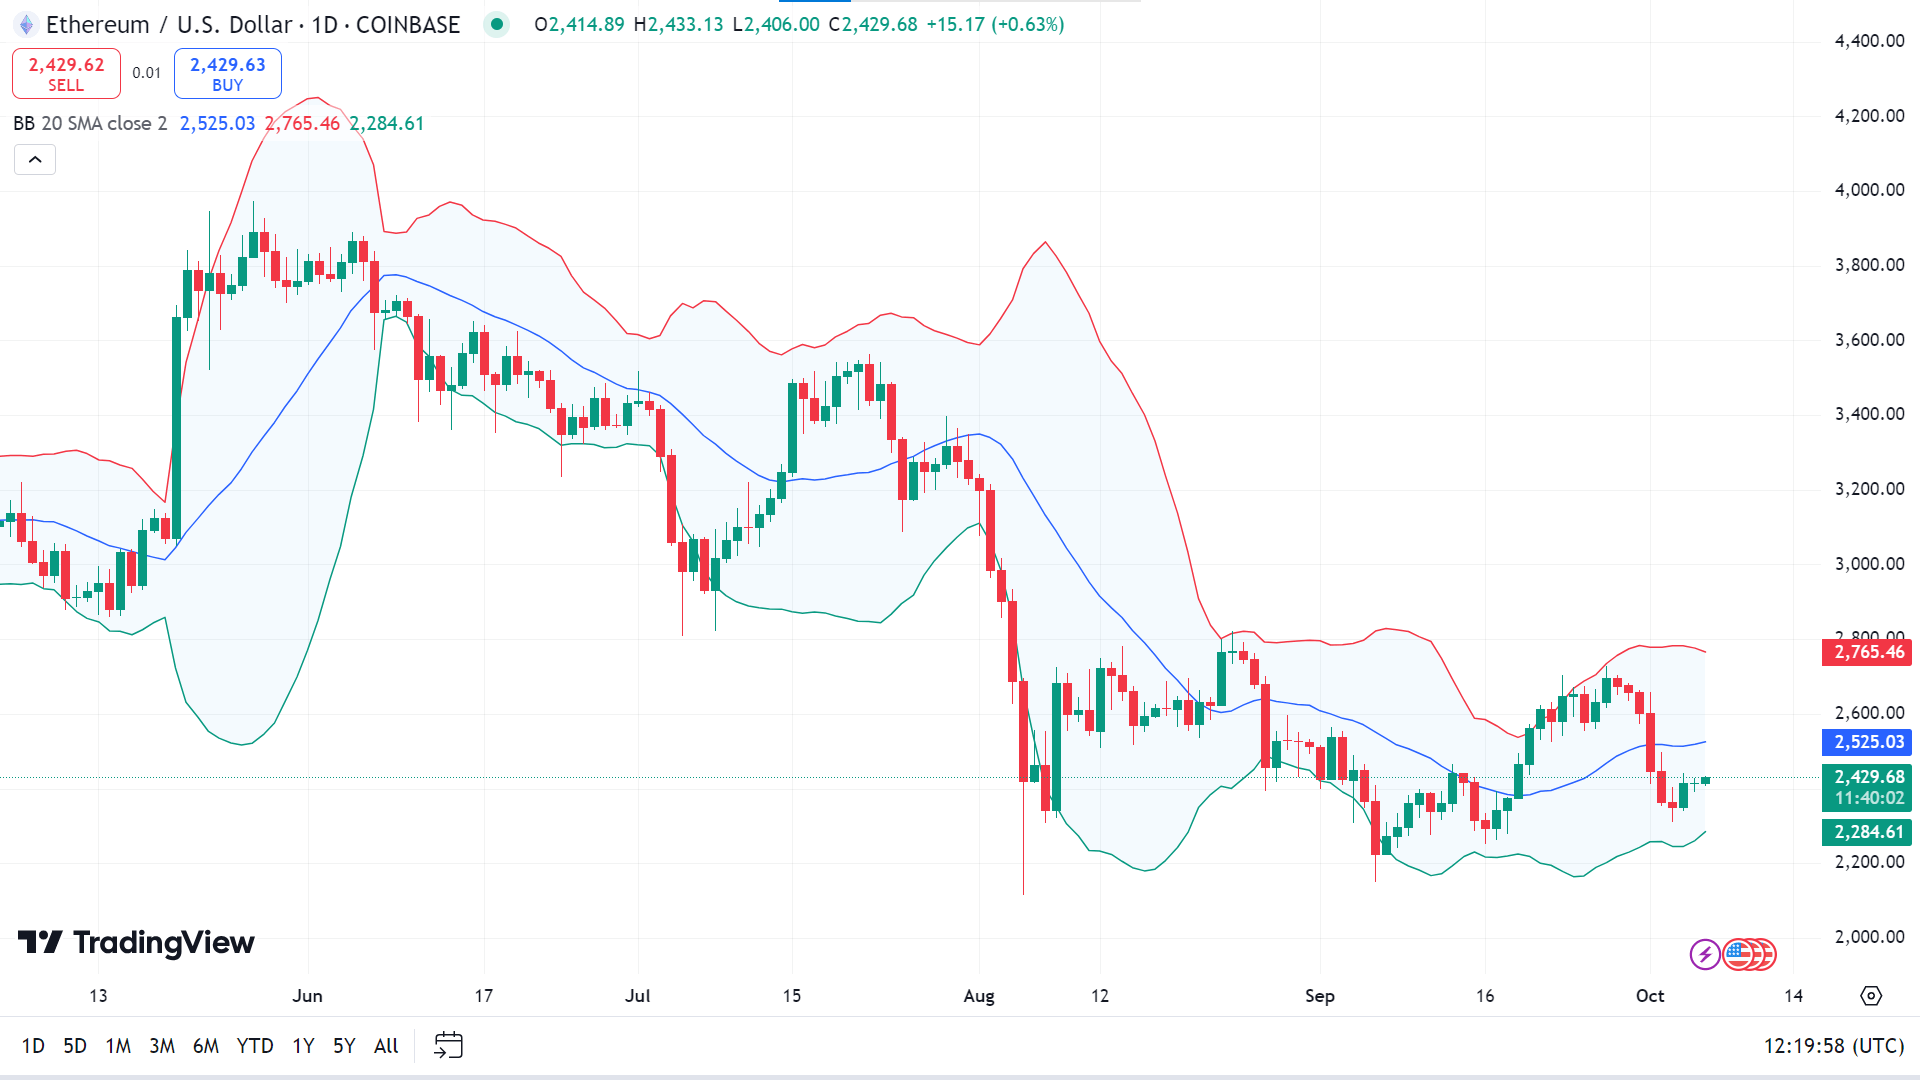
The price is moving in the lower channel of the Bollinger bands indicator, declaring recent bearish pressure. This pressure could drive the price toward the primary support of 2,272.23, followed by the next support near 2,135.49.
Meanwhile, if the price bounces back above the midline of the Bollinger Band indicator, it will enable the price to hit the nearest resistance of 2,714.88, followed by the next resistance near 2,851.62.
Tesla Stock (TSLA)
Fundamental Perspective
Tesla (TSLA) shares dropped 4% this week after falling short of Wall Street's expectations for Q3 deliveries, issuing a recall, and discontinuing its lowest-priced model. The company reported deliveries of 462,890 vehicles, slightly under the forecast of 463,897, marking the fourth straight quarter of missed estimates, which led to a 3% decline in Tesla's stock on Wednesday.
The sell-off continued Thursday with another 3% drop following Tesla's decision to discontinue its cheapest Model 3 sedan. Wedbush analyst Dan Ives noted that this move likely aimed to reduce reliance on Chinese-made components amid trade tensions. The discontinued model was the last to use lithium iron phosphate (LFP) batteries from China, which had previously been utilized in nearly half of Tesla's vehicles.
Additionally, Tesla issued its fifth Cybertruck recall of the year, affecting over 27,000 units due to rearview camera issues that did not meet federal safety standards.
Tesla's tough week follows broader challenges, including concerns over its Autopilot feature, mass recalls, and growing competition in China. Three senior executives resigned earlier this year, and its Chief Information Officer, Nagesh Saldi, is also reportedly departing.
Technical Perspective
The weekly chart shows the last red candle, which enables the possibility of creating a double-top pattern. If the recent bearish pressure sustains, the next candle might be another red one.
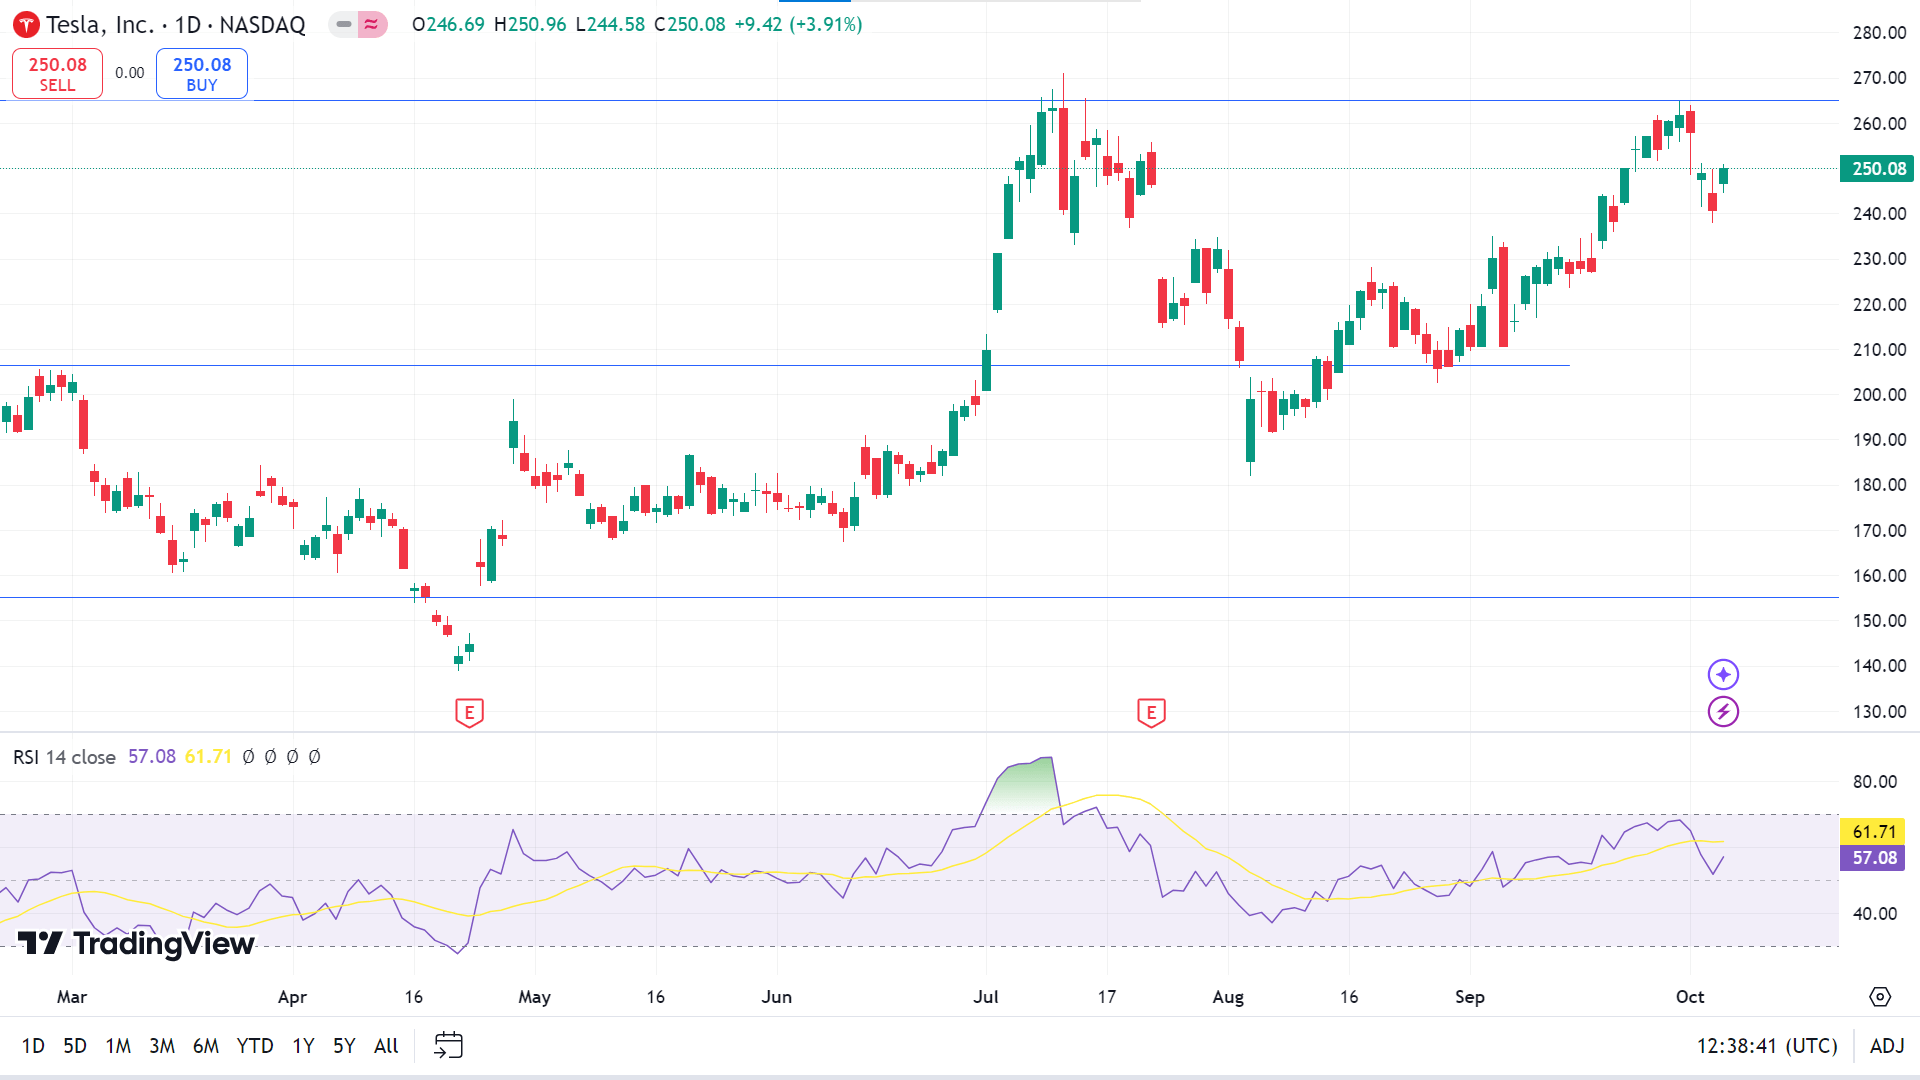
The price is still bullish, as the RSI indicator window confirms through the dynamic signal line above the midline and edging upside, declaring the price may reach the primary resistance of 266.47, followed by the next resistance of 279.50.
Meanwhile, if the price loses bullish pressure at this level and the RSI signal line slops below the midline, the price might drop to the nearest support near 224.28, followed by the next support near 211.25.
Nvidia Stock (NVDA)
Fundamental Perspective
NVIDIA Corporation (NASDAQ: NVDA) announced that its latest AI chip, Blackwell, has entered full production after experiencing earlier delays. In a CNBC interview, CEO Jensen Huang noted that demand for the chip is overwhelming, with many customers eager to secure early access. Huang also highlighted a new partnership with Accenture, stating that AI will significantly enhance enterprise innovation and speed.
JPMorgan maintains its Overweight rating on NVIDIA with a price target of $155. In a recent investor update, the firm confirmed that NVIDIA is scheduled to begin high-volume shipments of its Blackwell GPU platform in Q4. The company expects to generate several billion dollars in revenue from these quarterly shipments.
JPMorgan also urged investors not to focus too heavily on minor changes in the chip's rack scale portfolio, emphasizing that NVIDIA's long-term strategy remains strong. The note reinforced confidence in the company's ability to meet market demand for Blackwell, which is positioned as a critical driver of NVIDIA's future growth amid soaring demand for AI solutions.
Technical Perspective
The weekly chart pattern confirms that the price is approaching the resistance of the recent range. A successful breakout might lead to a new ATH, keeping buyers optimistic for the upcoming weeks.
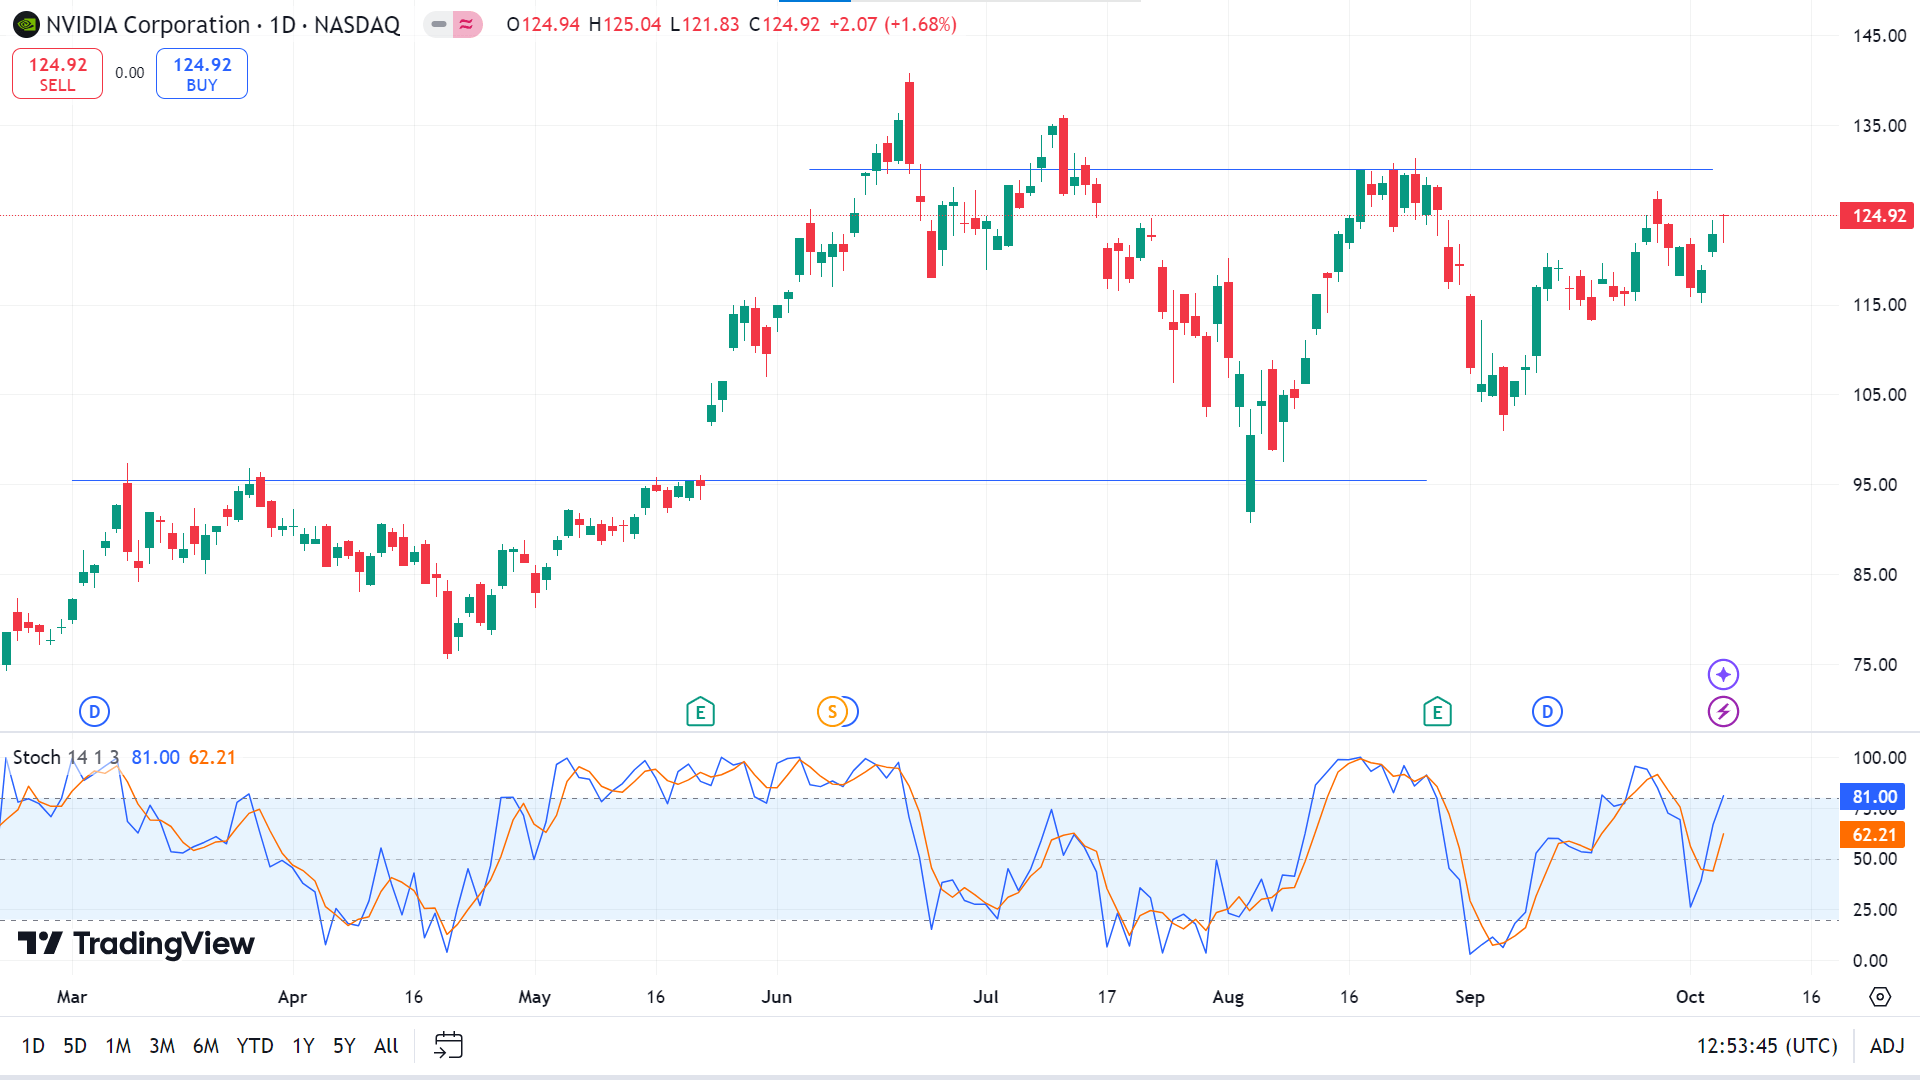
Many technical indicator readings confirm that the price is moving in an uptrend on the daily chart. Due to recent bullish pressure, the dynamic signal lines on the stochastic indicator move straight to the upper line of the indicator window, which may lead the price to the primary resistance of 126.89, followed by the next resistance near 133.19.
Meanwhile, any pause on the current uptrend or if the Stochastic dynamic signal line heads down from this level may lead the price to decline to the nearest support of 113.20, and the next possible support is near 103.80.
WTI Crude Oil (USOUSD)
Fundamental Perspective
Crude oil and gasoline prices hit 5-week highs on Friday, continuing Thursday's rally. The surge was driven by fears that Israel might retaliate against Iran's missile attack by targeting its oil facilities, potentially disrupting global supply. Citigroup estimates such an attack could remove 1.5 million barrels per day (bpd) from the market. However, President Biden urged Israel to consider alternatives to striking Iran's oil fields.
More substantial U.S. economic data also contributed to rising oil prices. In September, U.S. nonfarm payrolls increased by 254,000, significantly above expectations, while unemployment fell to 4.1%, reflecting more robust fuel demand. Additionally, French industrial production in August saw its most significant monthly gain in 15 months, further supporting energy demand.
However, the outlook for crude oil remains mixed. Libya is set to restore oil production, while Saudi Arabia may abandon its unofficial $100/barrel price target. Meanwhile, Russian crude exports have surged to a 3-month high, adding bearish pressure. OPEC+ has paused its planned production increases, offering some support, while U.S. crude inventories remain below the 5-year average, with production near record highs.
Technical Perspective
The weekly chart confirms the end of the bearish pressure. The price bounced back from the support level, and a single candle erased the previous week's loss, indicating that the next candle might be another green one.
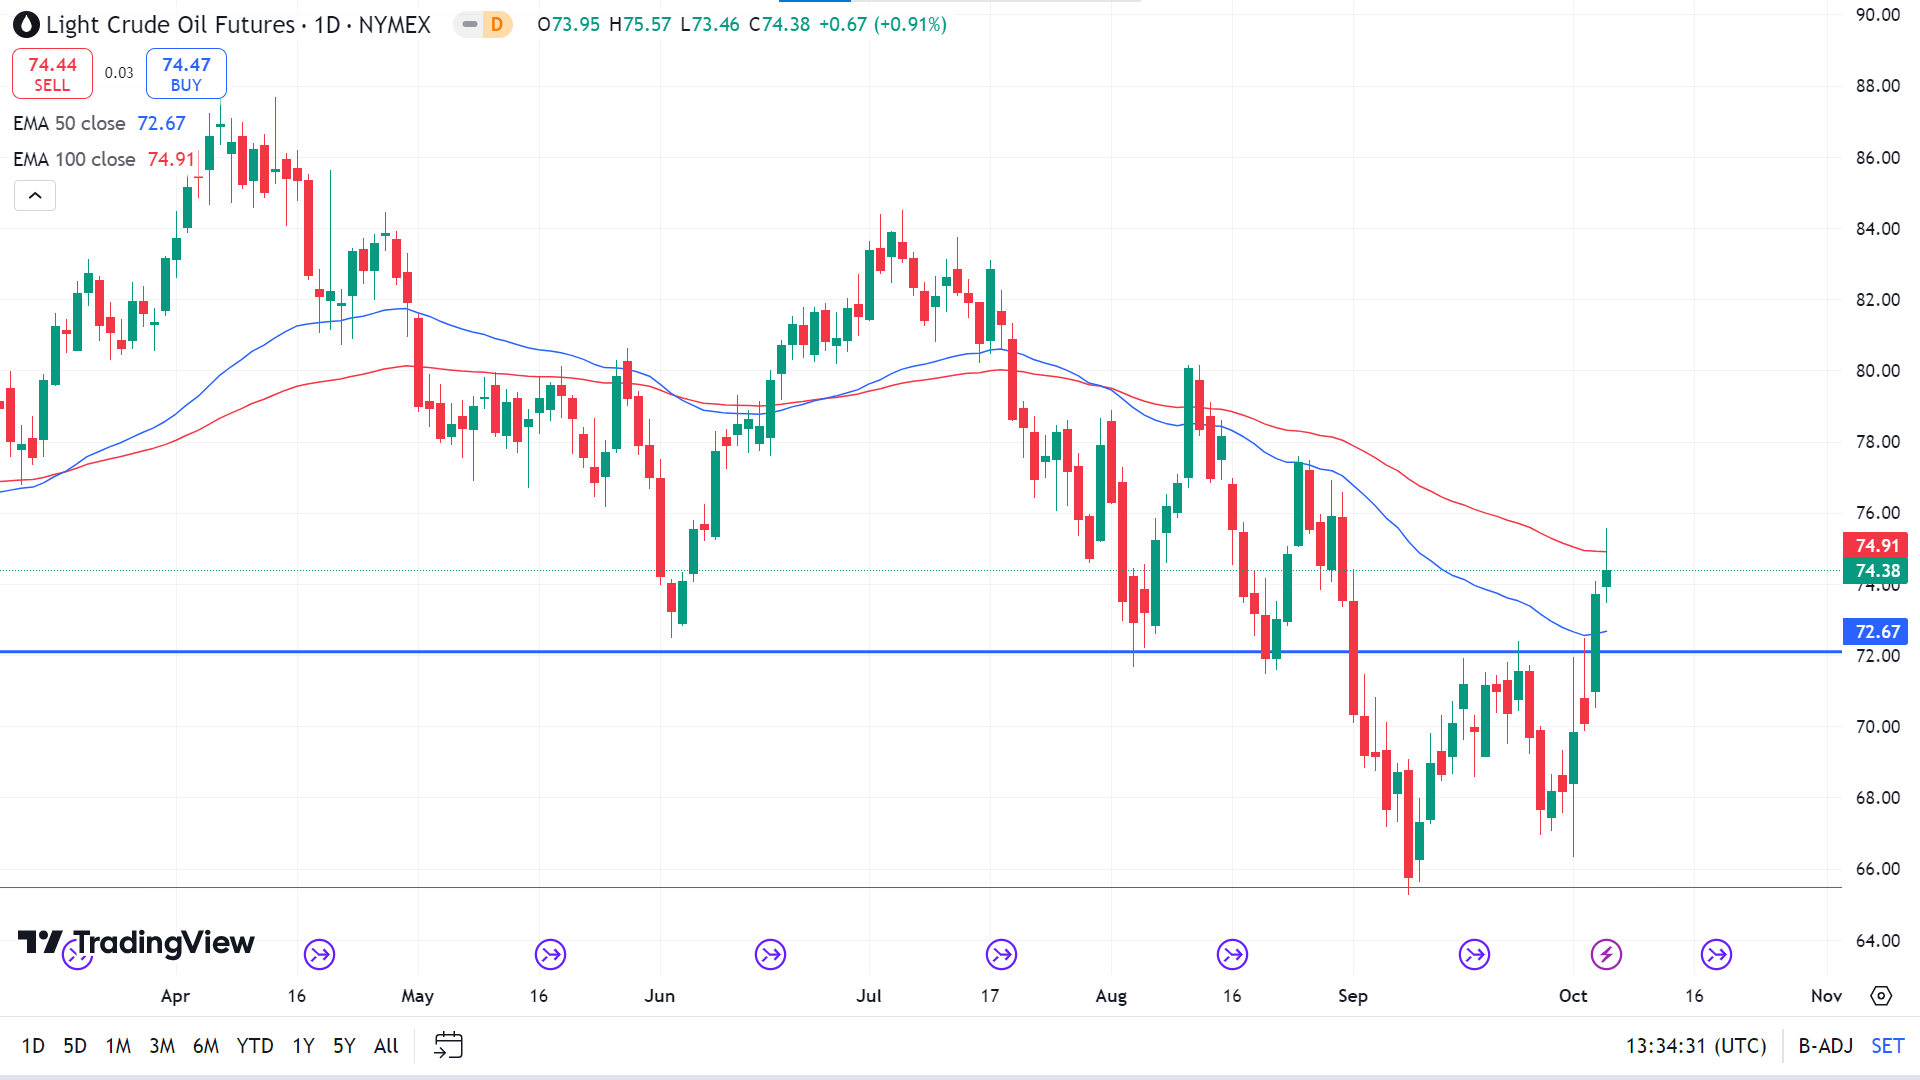
On the daily chart, the price floating between the EMA 100 and EMA 50 lines creates a zone, and reaching beyond the zone may confirm the future direction of the Crude oil price. If the price exceeds the EMA 100 line, it will indicate a solid bullish pressure, and the price may head to reach the primary resistance of 77.45, followed by the next resistance near 80.17.
On the other hand, if the bearish pressure resumes and the price declines below the EMA 50 line, it will indicate significant bearish pressure, which may lead the price to the nearest support of 71.67, followed by the next support near 67.63.


