EURUSD
Fundamental Perspective
The EURUSD extended its rally for a fourth straight day on Thursday, nearing the 200-day Simple Moving Average (SMA) at 1.0870 and close to the 1.0900 resistance level. This climb correlates with a softer US Dollar, as the US Dollar Index (DXY) dipped below 104.00 amid a broader decline in US Treasury yields. The Euro found additional support in a modest pullback in 10-year German bund yields after reaching highs near 2.45%.
Market expectations for a 25-basis-point rate cut by the Federal Reserve (Fed) on November 7 have intensified, driven by persistently high PCE inflation data and a strong labor market, ahead of Friday's Nonfarm Payrolls report. The CME FedWatch Tool shows nearly full pricing for this anticipated cut.
Meanwhile, the European Central Bank (ECB) recently cut its Deposit Facility Rate to 3.25%, with officials adopting a cautious approach to further reductions. ECB President Christine Lagarde expects inflation to align with the 2% target by 2025, while Governing Council member Fabio Panetta suggests more easing may be needed. Conversely, board member Isabel Schnabel supports a gradual approach to avoid overshooting targets.
As the Fed and ECB weigh policy, EURUSD's path will likely hinge on broader economic dynamics, with the more robust US economy favoring the Dollar.
Technical Perspective
EURUSD posted a green candle after four consecutive losing weeks, reflecting a pause in the current bearish trend.
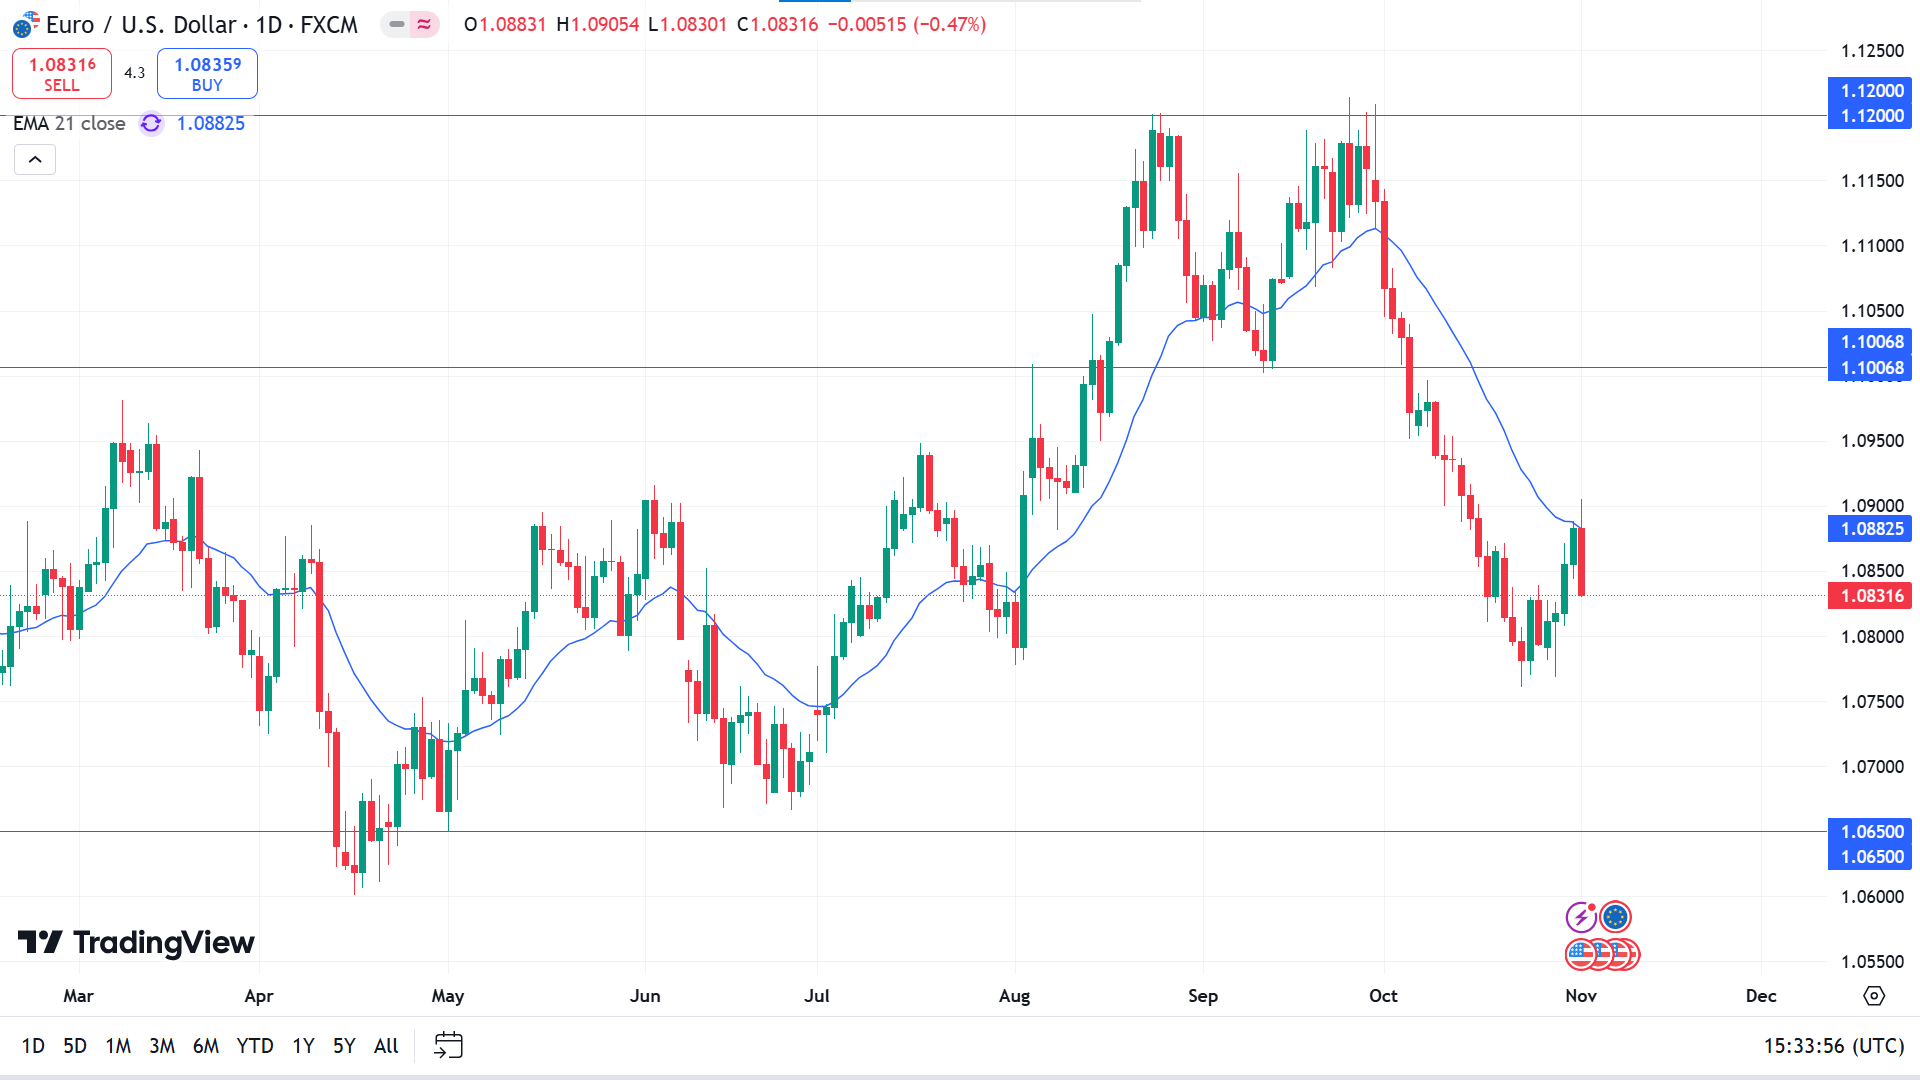
In the daily chart of EURUSD, an ongoing bearish trend is visible as the recent selling pressure came after sweeping the buy-side liquidity from the 1.1200 level. Moreover, the post-NFP sentiment showed the same sentiment after having a solid reversal from the dynamic 21 EMA line.
According to the current context, a downside continuation is highly possible, where the selling pressure below the 1.0777 level could lower the price towards the 1.0650 level.
On the other hand, the August 2024 low could work as a crucial support as a minor upward correction is visible from that zone. In that case, overcoming the 20 EMA line might find resistance from the 1.1000 area.
GBPJPY
Fundamental Perspective
The Bureau of Labor Statistics (BLS) reported just a 12K increase in US payrolls for October, well below the anticipated 113K and the prior month's revised 223 K. This slowdown largely reflects disruptions from a Florida hurricane and aerospace industry strikes. As expected, the Unemployment Rate held steady at 4.1%, while Average Hourly Earnings—an important wage growth indicator—rose by 4% year-over-year, which aligns with forecasts.
GBPJPY declined as the yen strengthened in currency markets after Bank of Japan (BoJ) Governor Kazuo Ueda's comments increased speculation of a potential rate hike in December.
Japan's manufacturing sector showed further weakness, with the October au Jibun Bank Manufacturing PMI slipping to 49.2 from 49.7 in September, indicating ongoing contraction. This decline reflects lower manufacturing output and a steeper drop in new orders as the fourth quarter begins.
Japan's Chief Cabinet Secretary Yoshimasa Hayashi remarked that he expects the BoJ to work closely with the government to ensure monetary policies effectively support stable and sustainable inflation, targeting the bank's long-term price objectives.
Technical Perspective
The price closed bearish in the weekly candle, with no violation of the previous weekly low. It is a sign that more clues are needed before anticipating a short move.
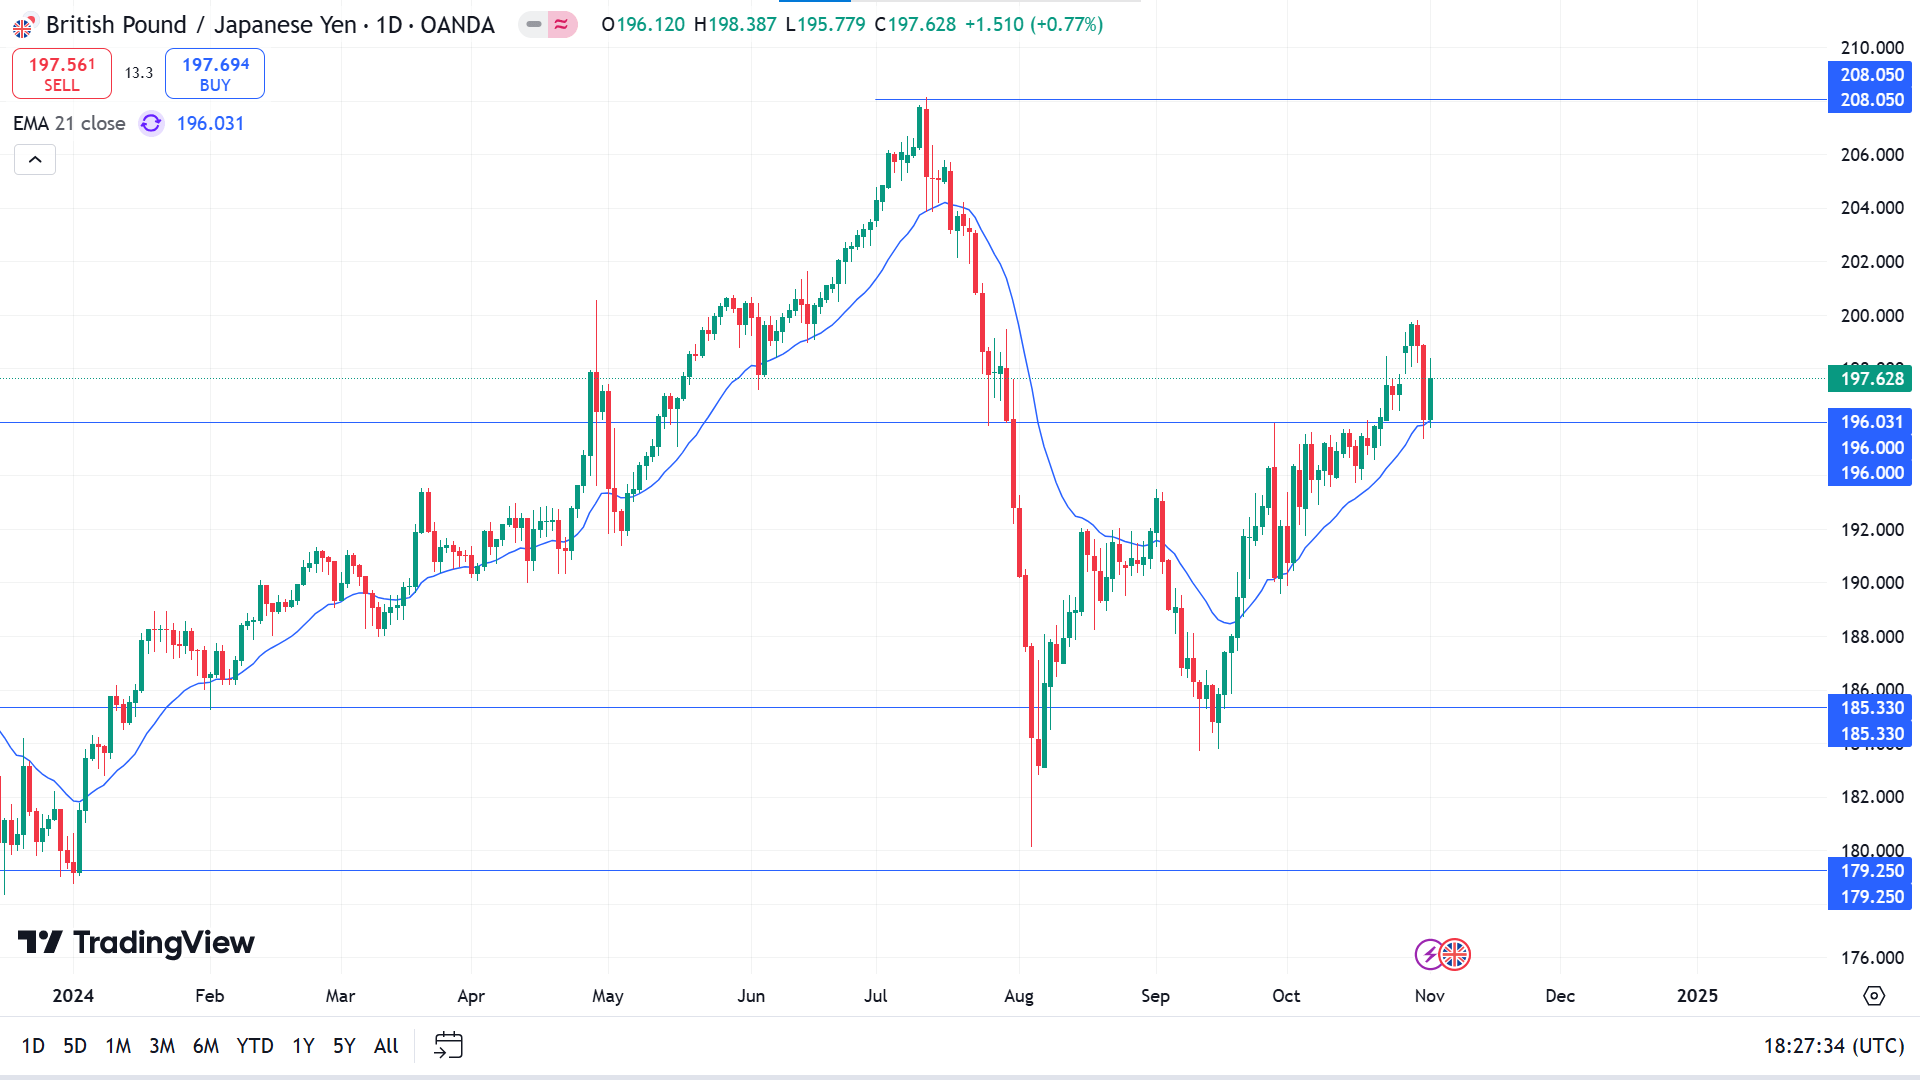
Despite the selling pressure on Thursday, the price maintained the growth by closing the week above the 20-day EMA. Moreover, the static 196.01 event level is working as a barrier to bulls.
Based on the bullish outlook of GBPJPY, a bullish rebound is possible as long as the price hovers above the 196.00 psychological line, and eyes on the resistance near 208.05 with sustainable bullish pressure.
However, a selling pressure below the 196.00 level could signal a potential buy-side liquidity sweep, which might extend the loss towards the 190.00 to 188.00 area before forming a bullish signal.
NASDAQ 100 (NAS100)
Fundamental Perspective
US equity indexes dropped this week as mixed Big Tech earnings and rising government bond yields influenced investor sentiment ahead of key economic data and the upcoming presidential election.
Among tech giants reporting, Meta (META), Apple (AAPL), and Microsoft (MSFT) ended lower compared to last week, while Amazon (AMZN) and Alphabet (GOOG) registered gains.
On Thursday, the personal consumption expenditures (PCE) price index showed a 0.2% rise for September, meeting expectations and lowering the annual rate to 2.1% from 2.3% in August. The core PCE, excluding food and energy, increased by 0.3% month-over-month, holding the year-over-year rate at 2.7%.
On Friday, October, nonfarm payrolls grew by just 12,000, well below the 100,000 expected, marking the smallest monthly gain since December 2020. Revisions trimmed gains by 31,000 for September and 81,000 for August.
This job data strengthens expectations for the Federal Reserve to cut its interest rate by 25 basis points to a target range of 4.5%-4.75% at its November 7 meeting. The FedWatch Tool shows a 33% likelihood of rates at 3.75%-4% by July, suggesting a gradual easing path.
Technical Perspective
The last red weekly candle declares recent bearish pressure, although it finds temporary support near 19920.00.
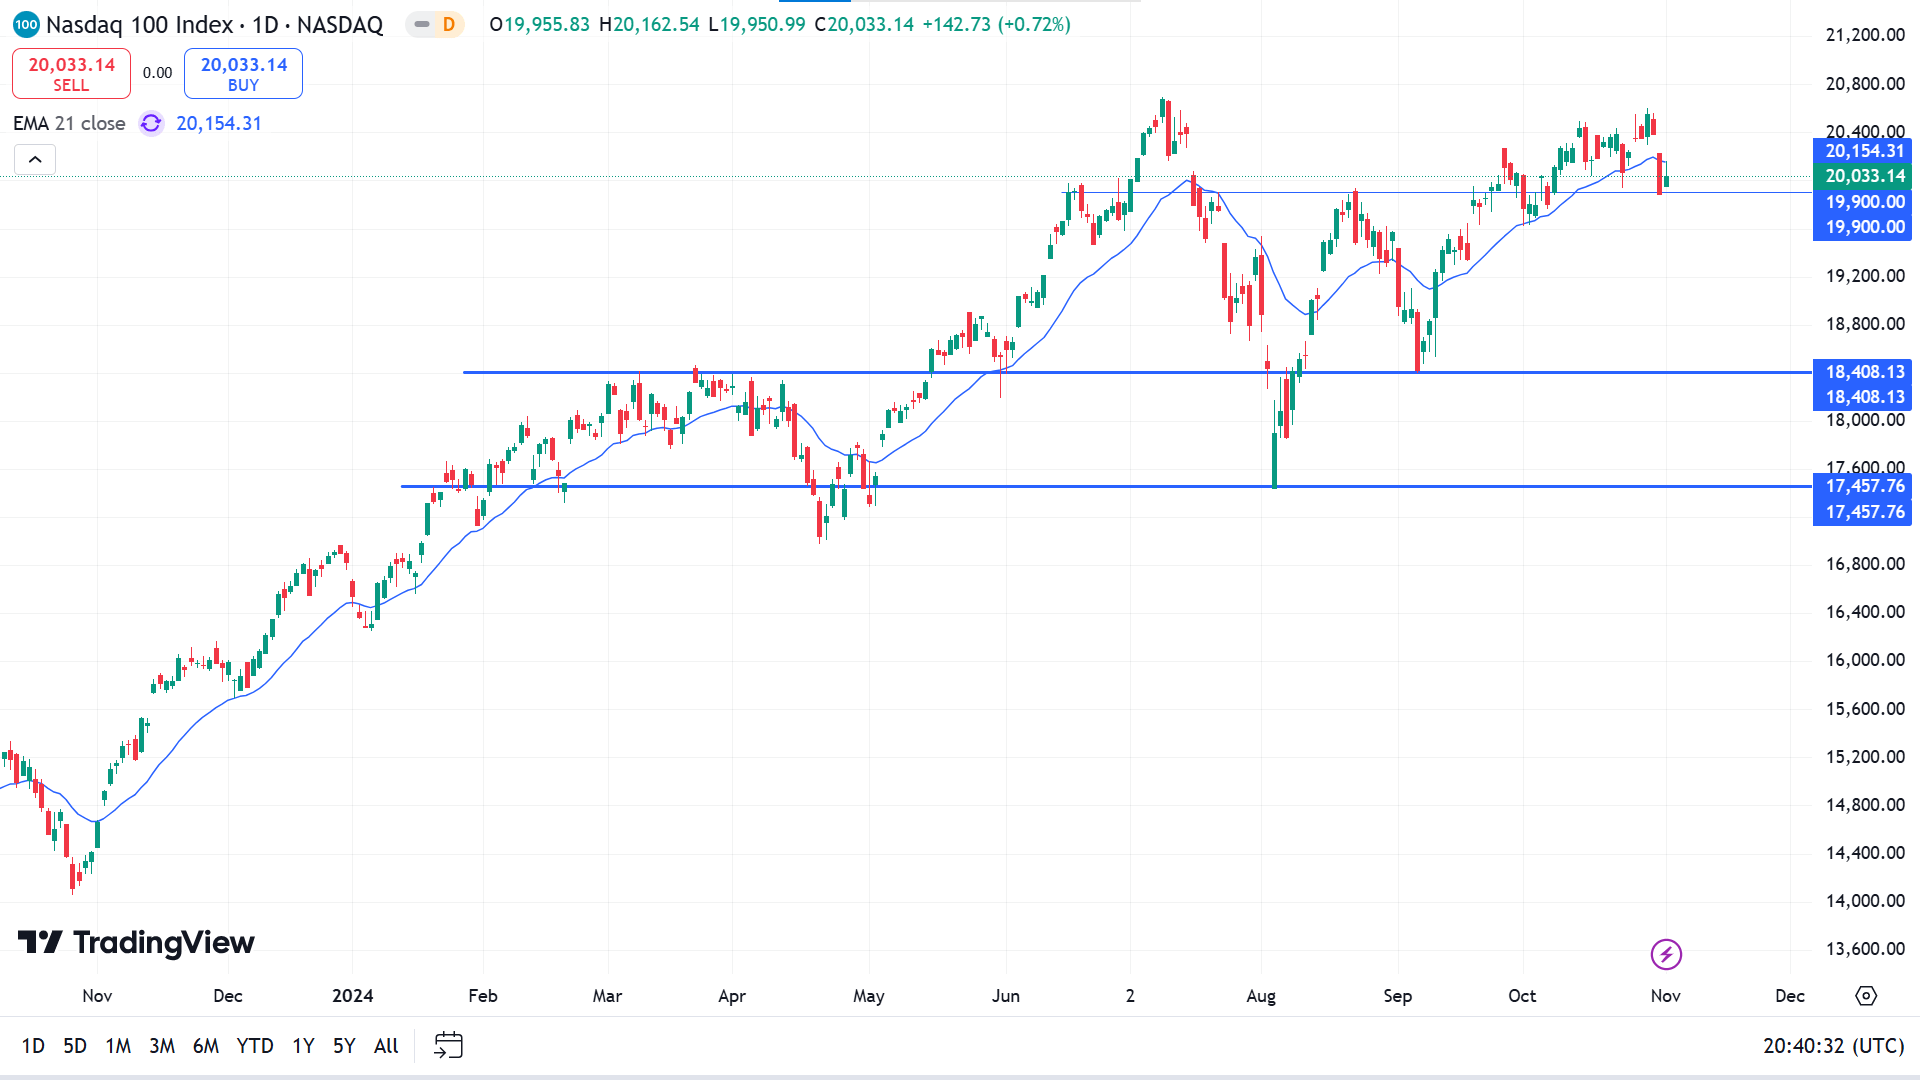
The Nasdaq 100 daily chart is trading within a triangle pattern, where the most recent price hovers below the July 2024 high. Moreover, a bearish daily candle below the 21 day EMA is visible, which could be a potential bearish signal.
As per the current market outlook, an additional selling pressure below the 19900.00 level might open a high probable selling pressure, aiming for the 18408.13 level.
The alternative approach is to find an immediate bullish reversal above the 20,115.00 level, which will trigger the price to the top at nearly 20588.46.
S&P 500 (SPX500)
Fundamental Perspective
The S&P 500 declined 1.4% this week, marking its second consecutive weekly decline as tech stocks led a broader pullback. The index closed at 5,728.80 after a 1% drop in October, the second monthly loss this year, yet it remains up 20% in 2024.
A 0.4% gain on Friday helped trim weekly losses as softer-than-expected October payrolls fueled hopes for further Federal Reserve rate cuts. Nonfarm payrolls added only 12,000 jobs last month, well below the forecasted 100,000, while the unemployment rate stayed at 4.1%.
Nearly all sectors posted weekly losses, with technology dropping 3.3%, real estate down 3.1%, and utilities slipping 2.8%. Super Micro Computers (SMCI) led tech declines, plunging 45% after Ernst & Young resigned as auditor over concerns with financial reporting controls. Qorvo (QRVO) also fell 27% after revising its revenue guidance lower.
In contrast, communication services and consumer discretionary sectors posted gains of 1.5% and 0.5%, with Charter Communications (CHTR) climbing 9.1% on strong Q3 results.
Upcoming earnings reports include Vertex Pharmaceuticals (VRTX), Qualcomm (QCOM), and Airbnb (ABNB). Key economic updates are expected on Q3 productivity, September factory orders, and the Fed's rate decision, with the US presidential election on Tuesday.
Technical Perspective
The weekly chart shows the price retraces from the peak and may be seeking support from the near-term weekly support.
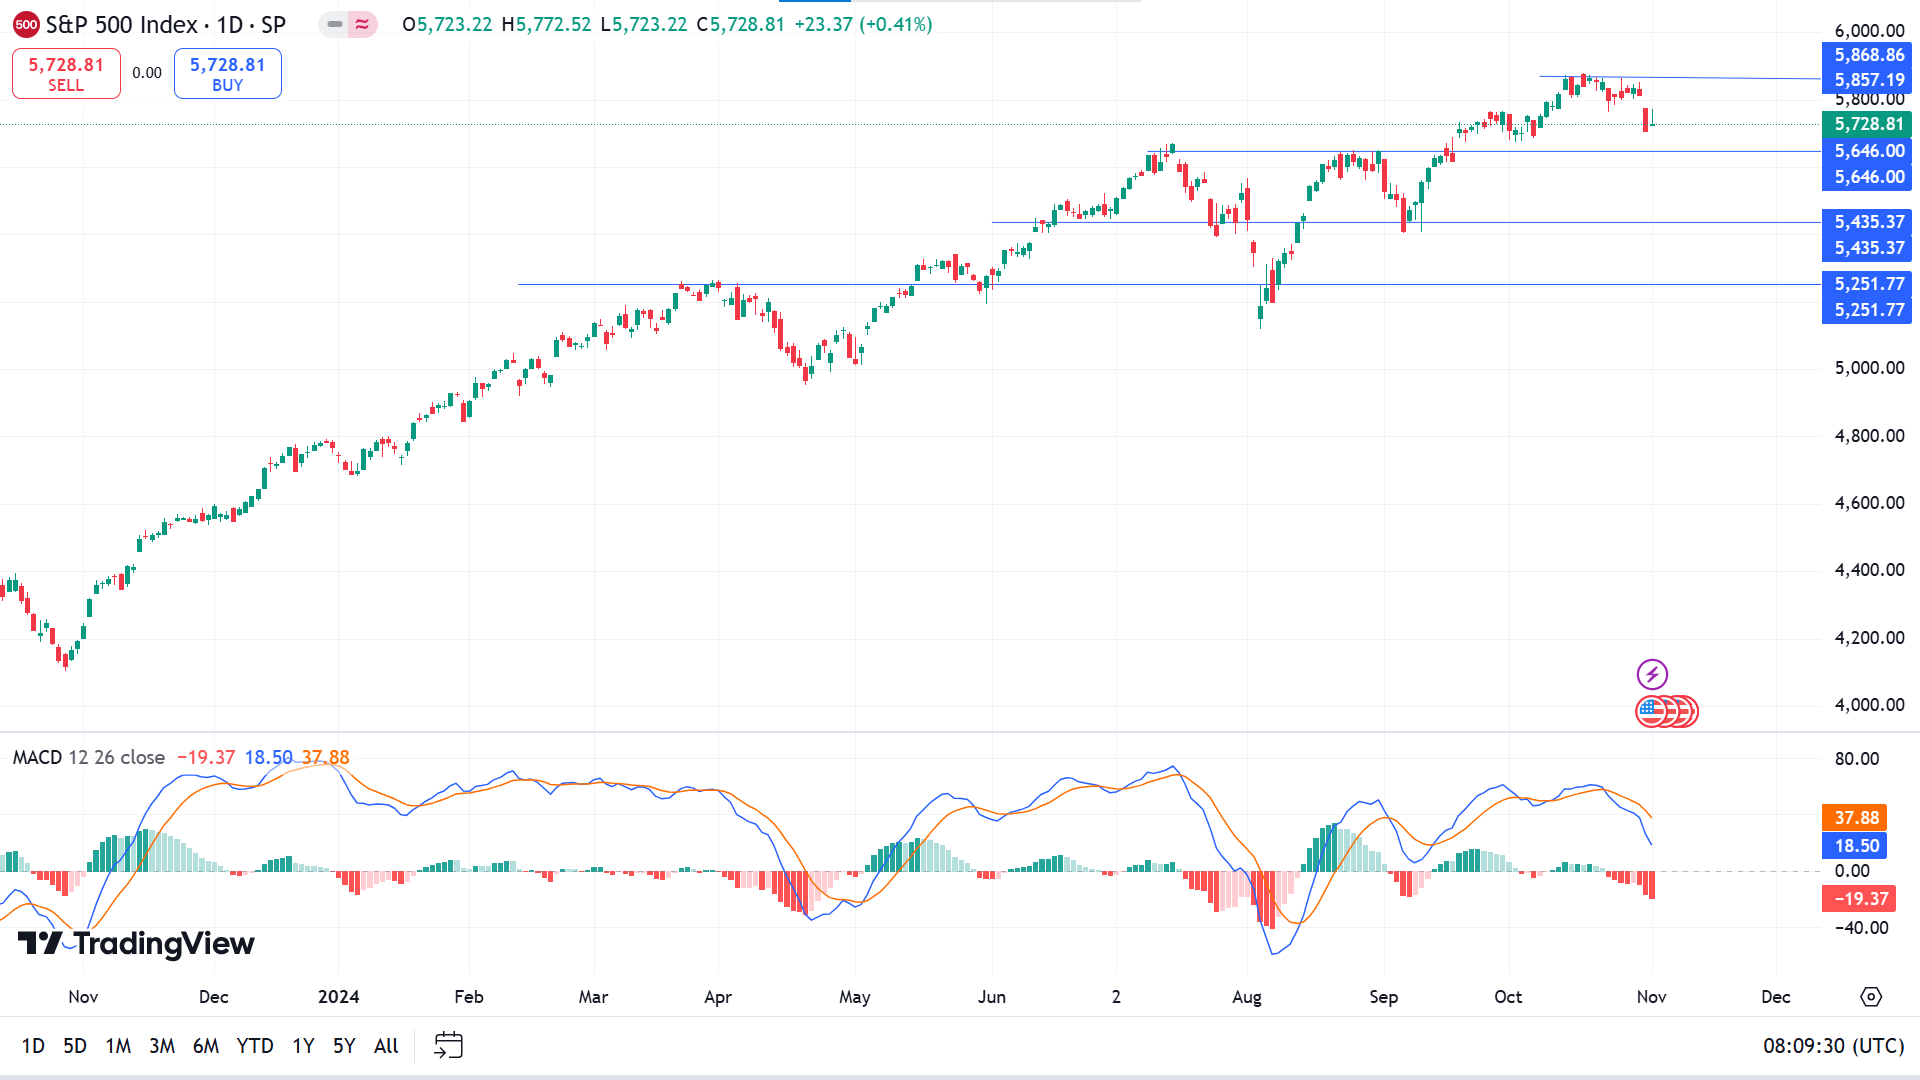
In the daily market outlook of the S&P 500, the price became sideways at the top, suggesting a weaker buying pressure. Moreover, a MACD Divergence is visible, as the Signal line failed to match the trend by forming new highs.
Following the market sentiment, a selling pressure below the 5646.00 line could offer a bearish corrective pressure at the 5435.37 support level.
However, a decent recovery with a valid bullish pressure above the 5646.00 level could extend the gain and may move toward a new ATH near 5957.09.
Gold (XAUUSD)
Fundamental Perspective
Gold (XAUUSD) fluctuated on Friday, initially climbing to the $2,760s after US Nonfarm Payrolls (NFP) data showed a much lower-than-expected increase of 12,000 jobs in October, far below the forecasted 113,000 and September's revised 223,000. However, the metal soon fell back to the $2,740s.
Gold's decline may have been influenced by mixed signals from the US Institute of Supply Managers (ISM). While the ISM Manufacturing PMI dropped to 46.5 in October, below expectations of 47.6, the Prices Paid Index, a key inflation measure, rose sharply to 54.8, surpassing the 48.5 forecast. This cost increase could reduce the chances of aggressive Federal Reserve rate cuts, putting pressure on gold.
The weak NFP figures, however, could prompt the Fed to consider deeper rate cuts, which would support gold by lowering the opportunity cost of holding the non-yielding asset.
Safe-haven demand is also boosting gold as Middle East tensions escalate. Hopes for a ceasefire were dashed after a Hezbollah rocket attack in northern Israel killed seven, with intensified bombings in Beirut claiming over 55 lives. This unrest and uncertainty around the US presidential election continue to support the demand for gold amid heightened geopolitical and economic risks.
Technical Perspective
The last candle on the weekly chart closed as an inverted hammer, reflecting a pause in the current uptrend.
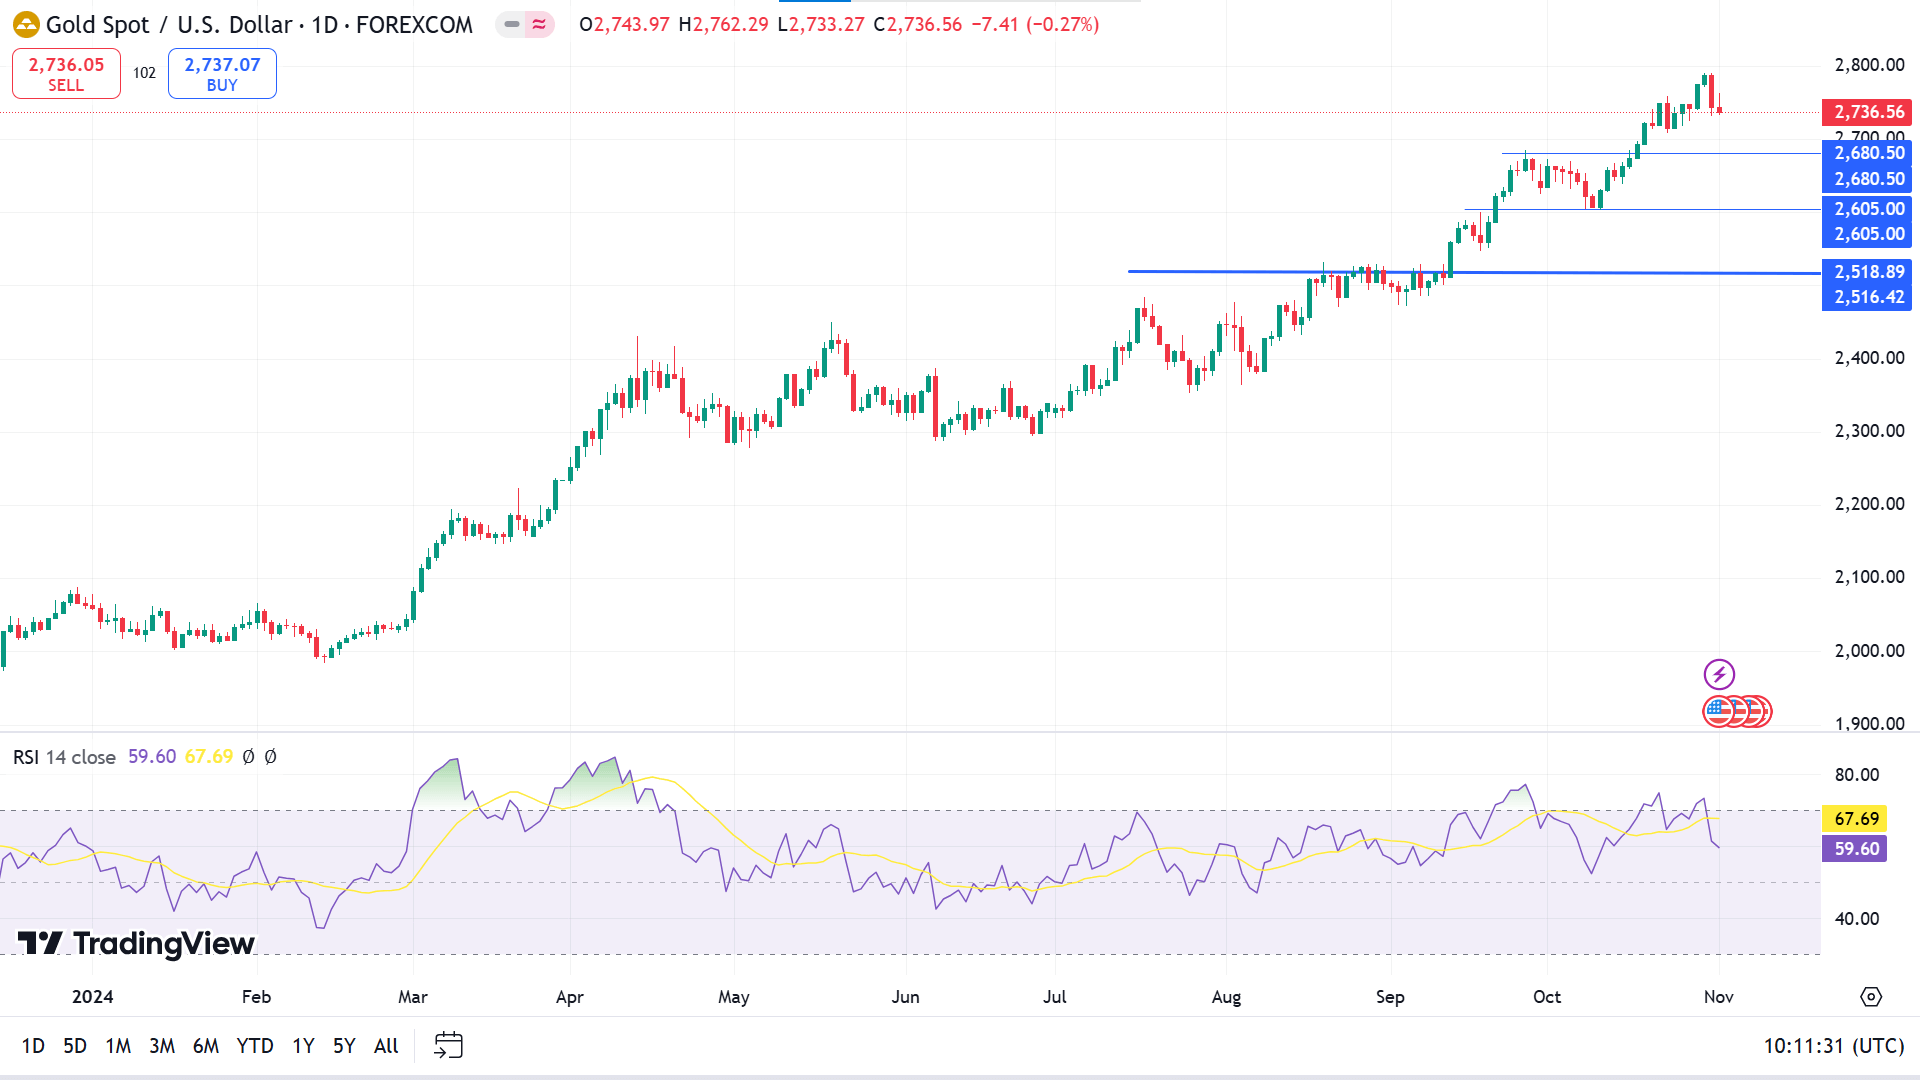
The RSI dynamic line slopes toward the indicator window's midline, which supports recent bearish pressure. At the same time, its edging upside will indicate a bullish continuation.
Based on the current market outlook of XAUUSD, a selling pressure below 2680.00 could enable a selling opportunity, extending toward 2605.00 or further below.
However, the major market trend remains bullish where the primary target would be to test the 2680.00 level, which may bounce the price back to the top of 2790.11 or further upside.
Bitcoin (BTCUSD)
Fundamental Perspective
Bitcoin (BTC) gained over 2% this week, benefiting from early momentum that nearly pushed it to a new all-time high before encountering a pullback amid heightened profit-taking. Analysts suggest BTC may face further declines in the lead-up to the U.S. presidential election, an event anticipated to shape future crypto regulation. Many traders believe a Trump victory would support a more favorable regulatory environment for digital assets, making the election outcome crucial for BTC's near-term trajectory.
Bitcoin's gains were underpinned by robust institutional demand and renewed optimism. On Monday, BTC rose 2.85%, and Tuesday saw a further 3.97% increase, reaching $73,620—close to the March peak of $73,777. Futures Open Interest (OI) on exchanges hit a record $42.23 billion, signaling fresh capital inflows and increased buying interest.
However, signs of profit-taking emerged as BTC approached new highs. According to Arkham Intelligence, the Government of Bhutan moved $66.55 million worth of BTC to Binance, possibly to support fiscal initiatives amid mining pressures. If Bhutan chooses to sell this BTC, it could lead to additional selling pressure, given its substantial holdings of $889.36 million.
Technical Perspective
The BTCUSD price showed a selling pressure by moving above the multi-month high and closing as a Hammer candlestick on the weekly price.
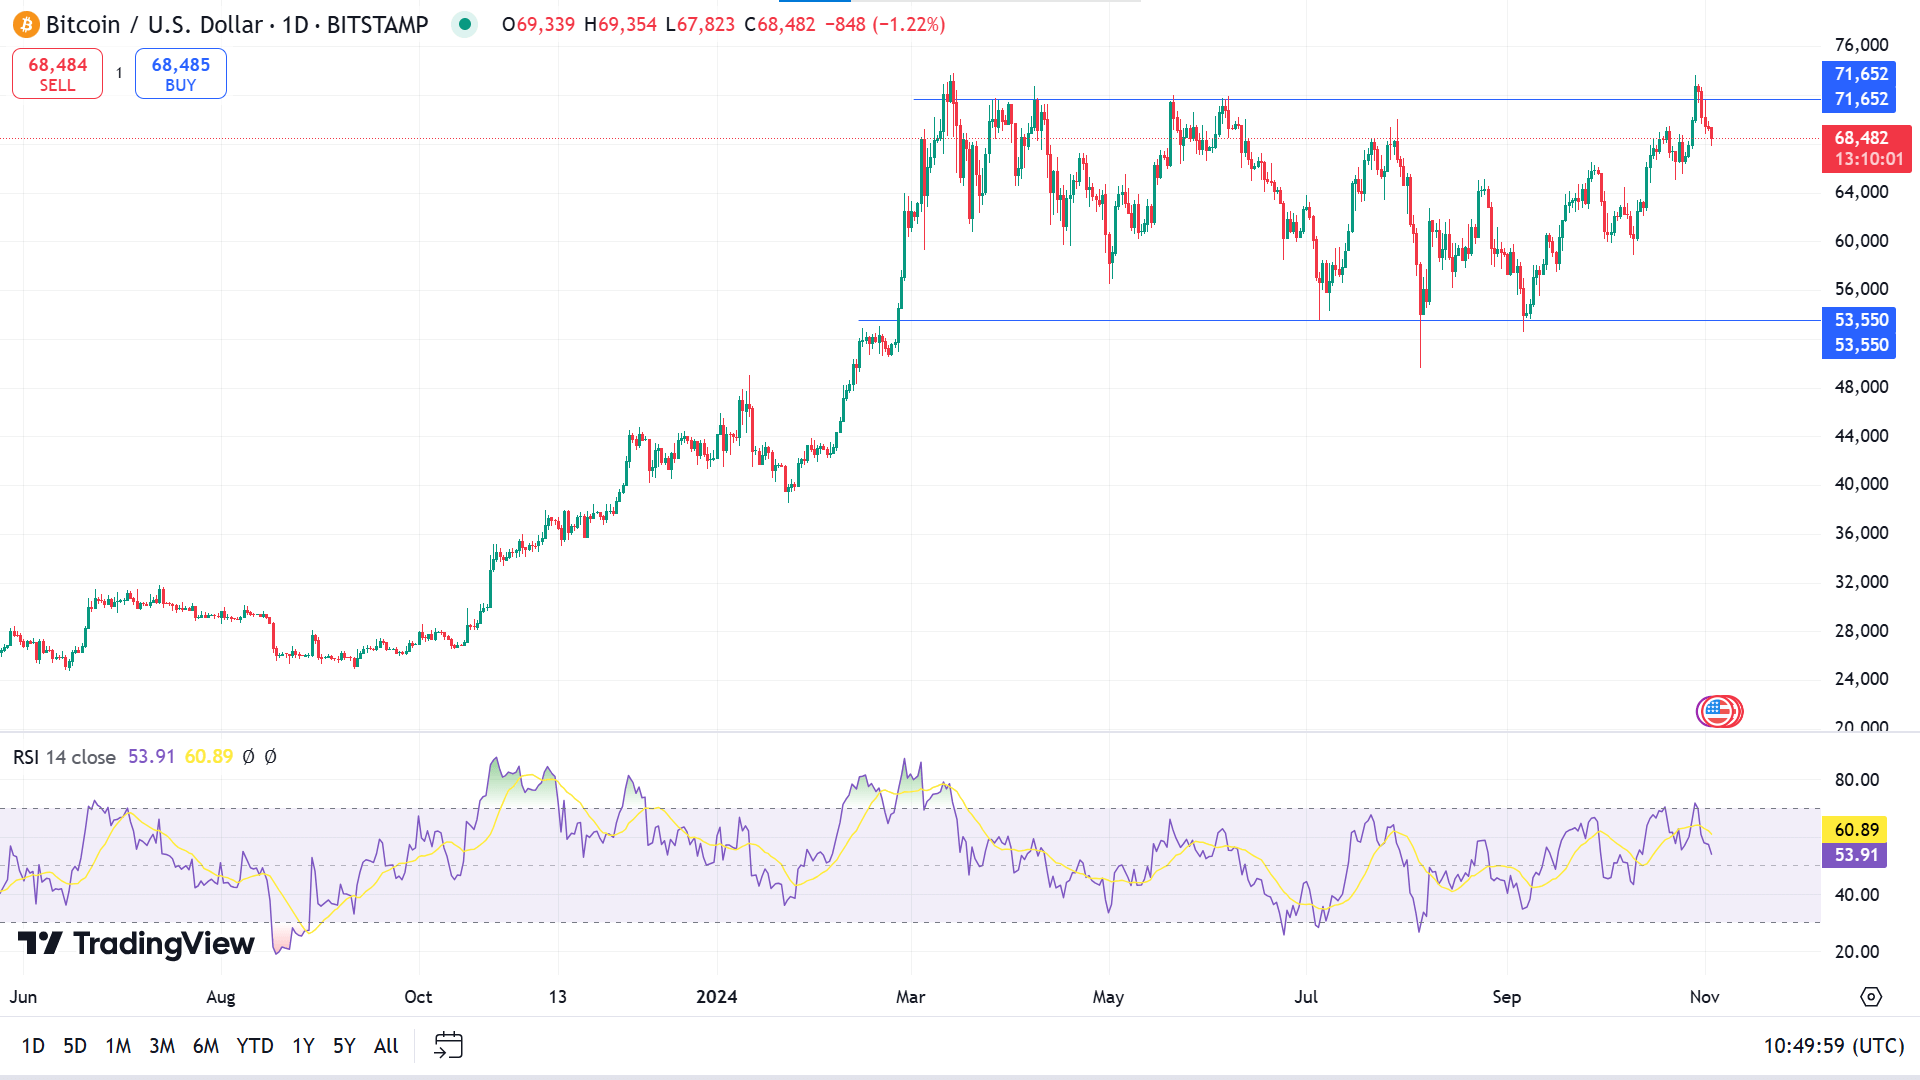
In the daily chart, the price has remained from 71,652 to 53,550 since Q2 this year. The RSI indicator window suggests a fresh sell pressure as the dynamic signal line heading steadily toward the midline of the indicator window is rejected from the upper line.
The price has recently reached a peak near 73,600 and declines quickly below the range top, which may enable adequate selling opportunities for investors to 53,550.
The RSI indicator window confirms bear domination on the asset price, and the sell signal will be invalid if the price exceeds and remains above 71,652. Meanwhile, it may drive buyers optimistic as the price could hit a new ATH near 76,671.
Ethereum (ETHUSD)
Fundamental Perspective
Ethereum (ETH) declined over 1% on Friday, though a key support level of around $2,490 indicates a possible rebound as on-chain data highlights ongoing investor accumulation.
Despite a market-wide pullback, Ethereum exchange-traded funds (ETFs) recorded $13 million in net inflows on Thursday, marking three consecutive positive flows, per Coinglass. This steady inflow reflects gradual, growing interest from institutional investors in ETH.
ETH's Mean Coin Age metric, which measures the average holding duration of ETH in wallets, also suggests continued accumulation. An upward trend in this metric indicates that investors are holding rather than selling. Since August 23, the Mean Coin Age has generally been on the rise, with a minor dip on October 25 before resuming, signaling that investors are again accumulating ETH, as Sentiment reported.
Supporting this accumulation trend, the on-chain platform EmberCN identified notable whale activity. One whale recently amassed 19,772 ETH (valued at $49.62 million) over three days, part of a broader strategy that included withdrawing 54,272 ETH (roughly $137 million) from Bybit and Binance since September 17.
Meanwhile, Ethereum's total holder base has expanded by 3.64 million over the past two months, reaching 130.52 million—a pace 40% higher than in previous months, reflecting growing investor appetite for ETH.
Technical Perspective
The double-top pattern is validated on the weekly chart as the price declines below the neckline. Also, the price is floating below the EMA 21 line on the daily chart, validating the bearish pressure and short-term bearish trend.
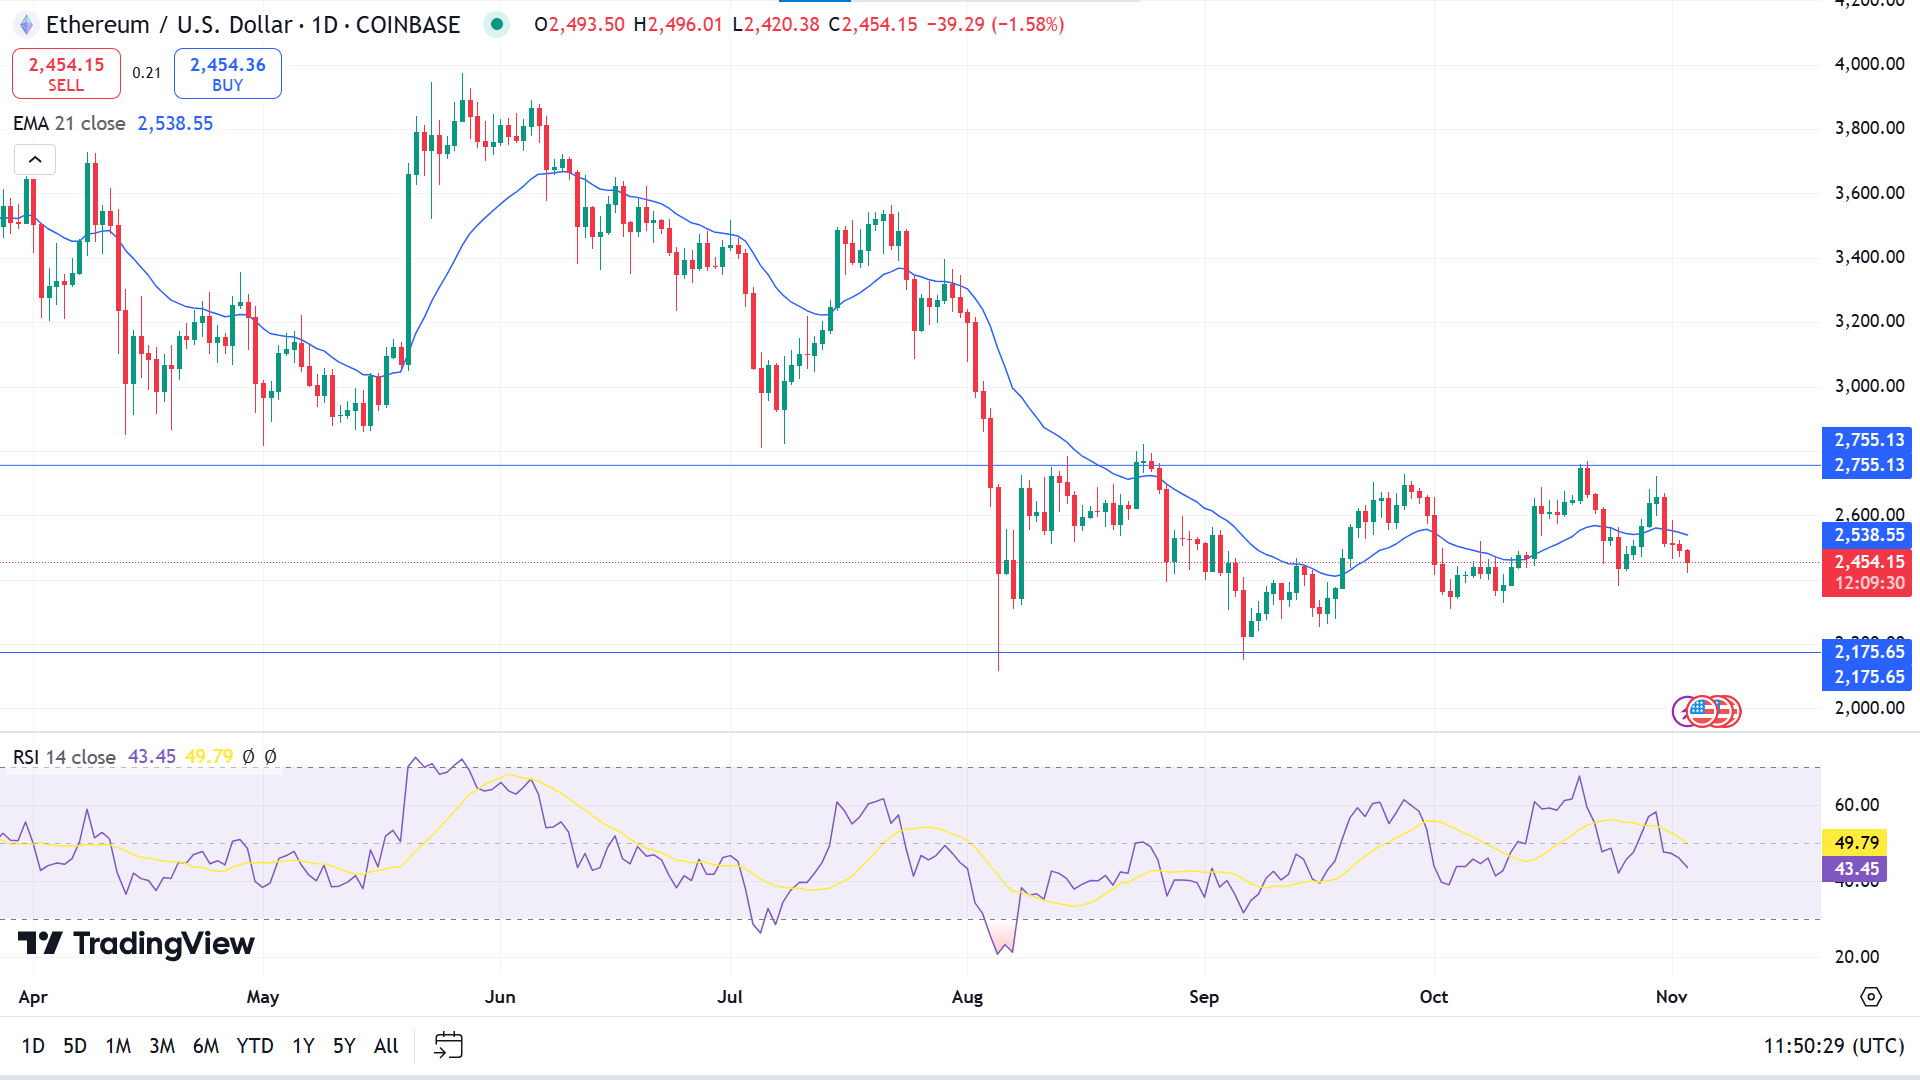
As the bearish trend validates, the bearish drop-base-drop formation signals a potential trend continuation, from where a valid trend continuation could lower the price towards the 2175.65 level.
On the bullish side, a valid rebound with a counter-impulsive momentum above the 2775.13 line might open a long opportunity, aiming for the 3600.00 level.
Nvidia Stock (NVDA)
Fundamental Perspective
Nvidia (NVDA), a leading name in graphics chips for gaming and artificial intelligence, has consistently outperformed earnings expectations, positioning it as a strong candidate for continued success in upcoming reports. Within the Zacks Semiconductor - General industry, Nvidia has delivered an impressive average earnings surprise of 8.58% across its last two quarters.
In its latest quarterly report, Nvidia achieved $0.68 per share earnings, beating the consensus estimate of $0.64 for a 6.25% surprise. The prior quarter saw an even greater outperformance, with earnings of $0.61 per share versus an expected $0.55, representing a 10.91% surprise.
This consistent earnings momentum, driven by its strong positioning in high-demand sectors like gaming and artificial intelligence, suggests that Nvidia may be well-prepared to continue delivering positive surprises in future reports.
Technical Perspective
The price was rejected from the 144.13 on the weekly chart and closed with a bearish engulfing pattern.
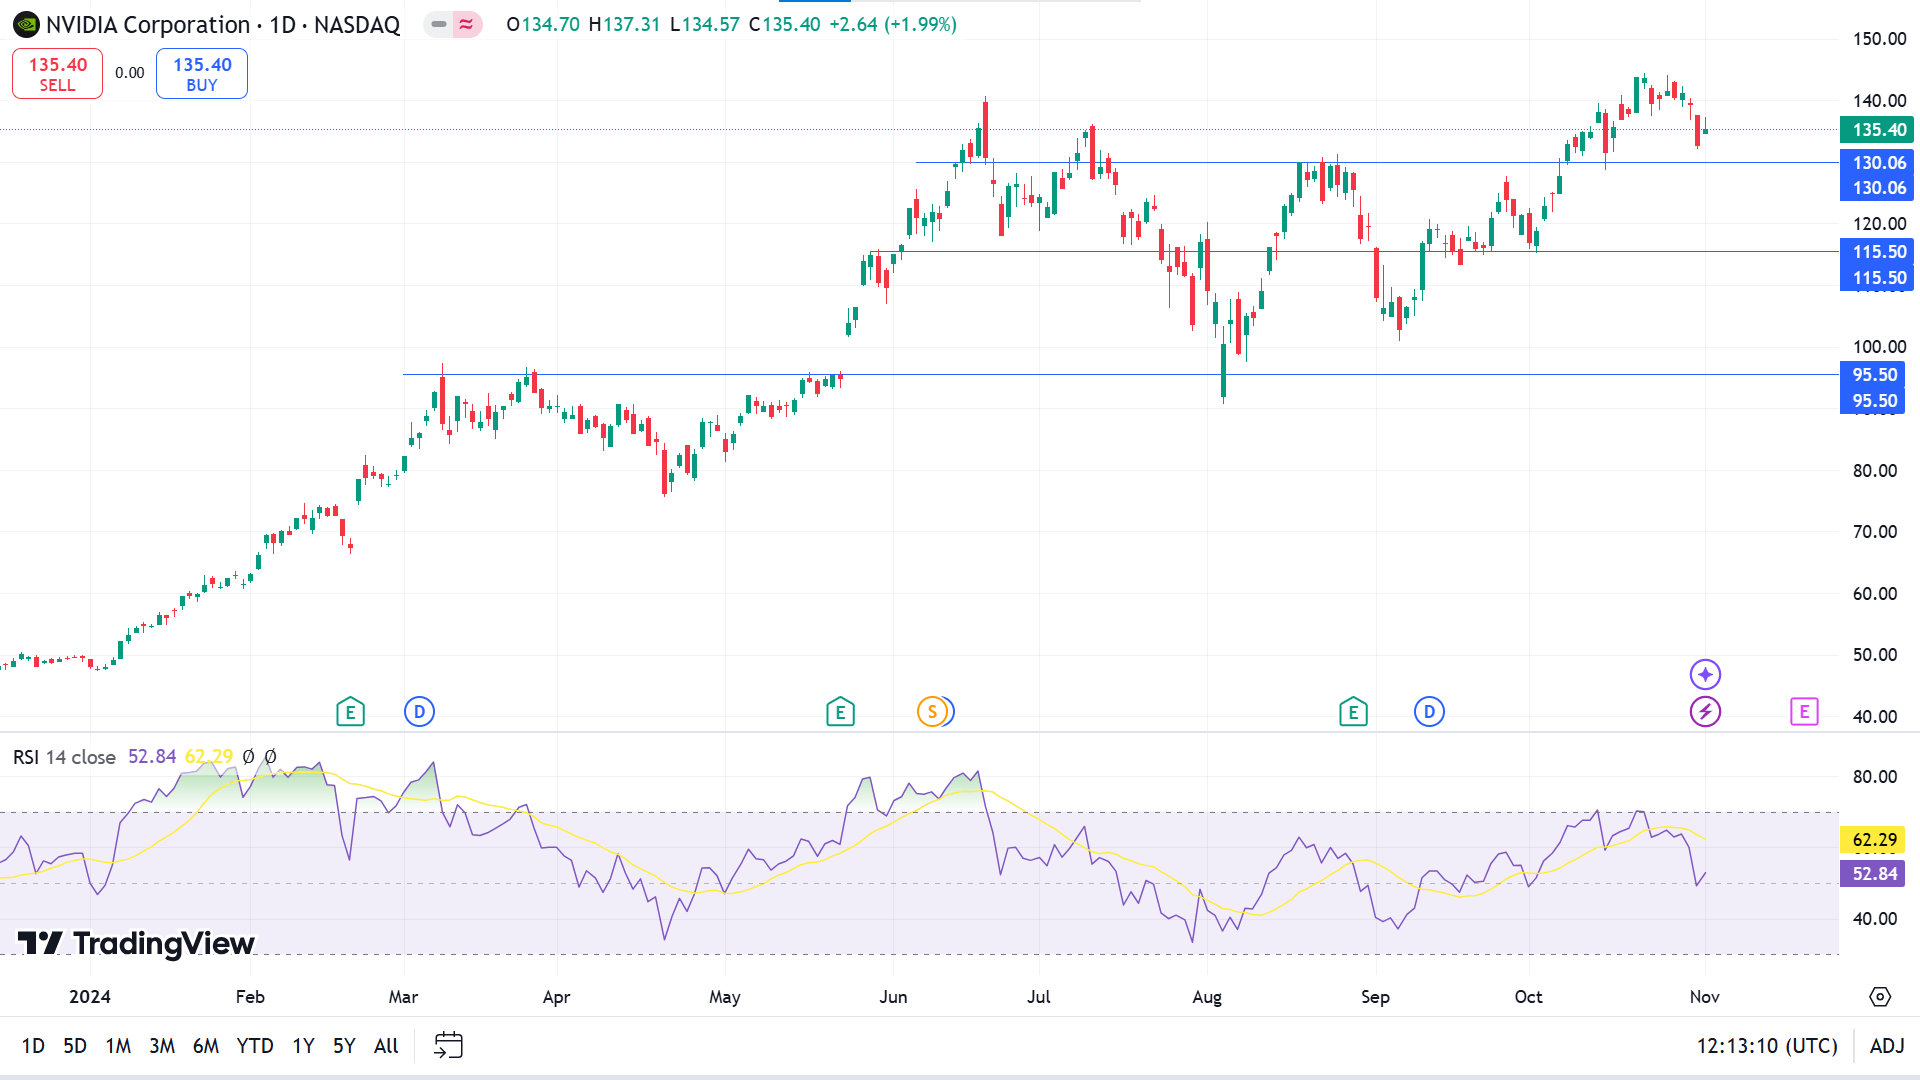
In the daily chart of NVDA, the buying pressure in the main price chart showed a corrective market momentum. Moreover, the RSI divergence is visible as the Signal line failed to make a new high, following the main price swing.
Following the divergence, investors should monitor how the price trades at the 130.06 level, as a break below this line could lower the price toward the 100.00 psychological line.
On the other hand, buyers may look at 130.06 as an adequate buy level, which may trigger the price to bounce back to the top of 144.13 or beyond.
Tesla Stock (TSLA)
Fundamental Perspective
Tesla's Q3 earnings report sparked a wide range of analyst reactions, with its impressive results prompting upgrades and cautionary outlooks.
Bank of America raised its price target from $255 to $265 after the earnings announcement, but Tesla's shares quickly exceeded this, closing at $269.19 on Friday after a remarkable 22% rally. With such strong performance, Bank of America also boosted profit forecasts through 2026, highlighting Tesla's projected production growth of 20%-30%, a potential new EV model, advanced autonomous driving features, reduced costs for the 4680 battery, and added revenue from regulatory credits.
Morgan Stanley maintained Tesla as its “top pick” with a $310 target, emphasizing volume growth expectations for next year, while Wedbush reiterated an “outperform” rating at $300, citing margin expansion alongside growth.
Conversely, JPMorgan issued an “underweight” rating with a $135 target, implying close to 50% downside. JPMorgan analysts expressed concerns that certain revenue sources, like regulatory credits, might be short-lived, potentially impacting earnings stability.
While some see Tesla as a leader in EV innovation with strong growth potential, others warn of challenges in sustaining recent gains amid competitive pressures and changing market dynamics.
Technical Perspective
The price peaked near 273.54 but created a red candle after a solid green in the weekly chart. As the latest candle remains within the bullish body of the previous week, we may consider it as a continuation opportunity from the inside bar formation.
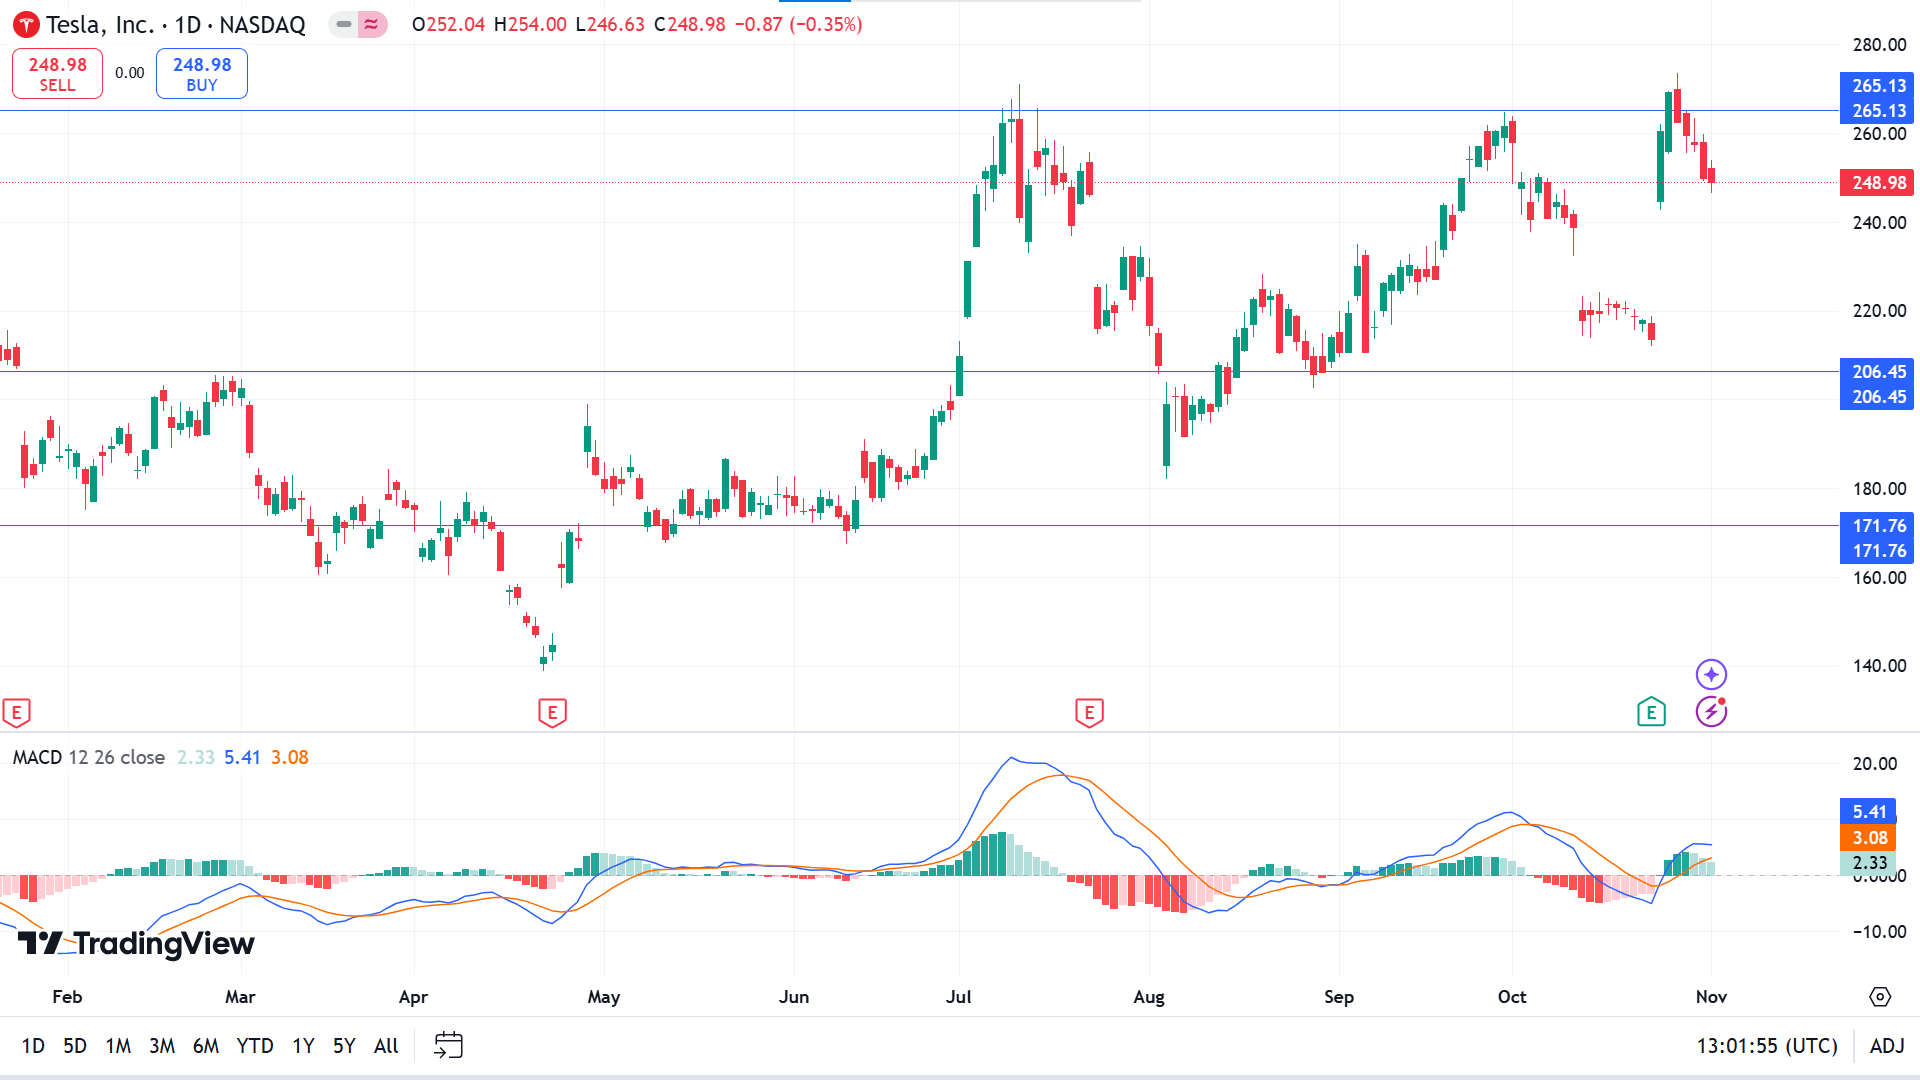
Looking at the daily chart, the price remains corrective, where a MACD divergence is present. Moreover, the Histogram is bullish as recent lines are above the neutral point.
Following the minor bearish trend, the price can reach a low range of nearly 215.97, leaving sellers optimistic about filling the daily chart gap. The sell signal will be invalid if the price exceeds the 265.13 level.
Meanwhile, the gap on the daily chart indicates that 242.70 can be an adequate support level for the price to hit the recent peak of 273.54 or beyond that level.
WTI Crude Oil (USOUSD)
Fundamental Perspective
West Texas Intermediate (WTI) crude oil prices edged higher on Friday amid renewed concerns over Middle Eastern unrest, though early gains eased by the close. December WTI finished up $0.23 at $69.49 per barrel after peaking at $71.45, while Brent crude, the global benchmark, rose $0.31 to $73.12.
The price uptick followed an Axios report suggesting that Iran is preparing further strikes on Israel using drones and missiles from Iraq, based on unnamed Israeli sources. This report intensified worries about a broader conflict between Iran and Israel, coming after an earlier decline in oil prices when Israel launched targeted strikes on Iranian sites following an October 1 missile attack.
Additional support for oil prices came from an unexpected decrease in U.S. crude inventories last week and speculation that OPEC+ might reconsider its plan to increase oil production by 180,000 barrels per day starting in December.
Meanwhile, weak U.S. employment data released on Friday showed the economy added only 12,000 jobs in October, a significant drop from September's revised 254,000 and well below the expected 110,000, according to Marketwatch. This weaker jobs report has yet to impact trading significantly.
Technical Perspective
The last doji candle with a small green body on the weekly chart declares a pause and leaves a mixed signal.
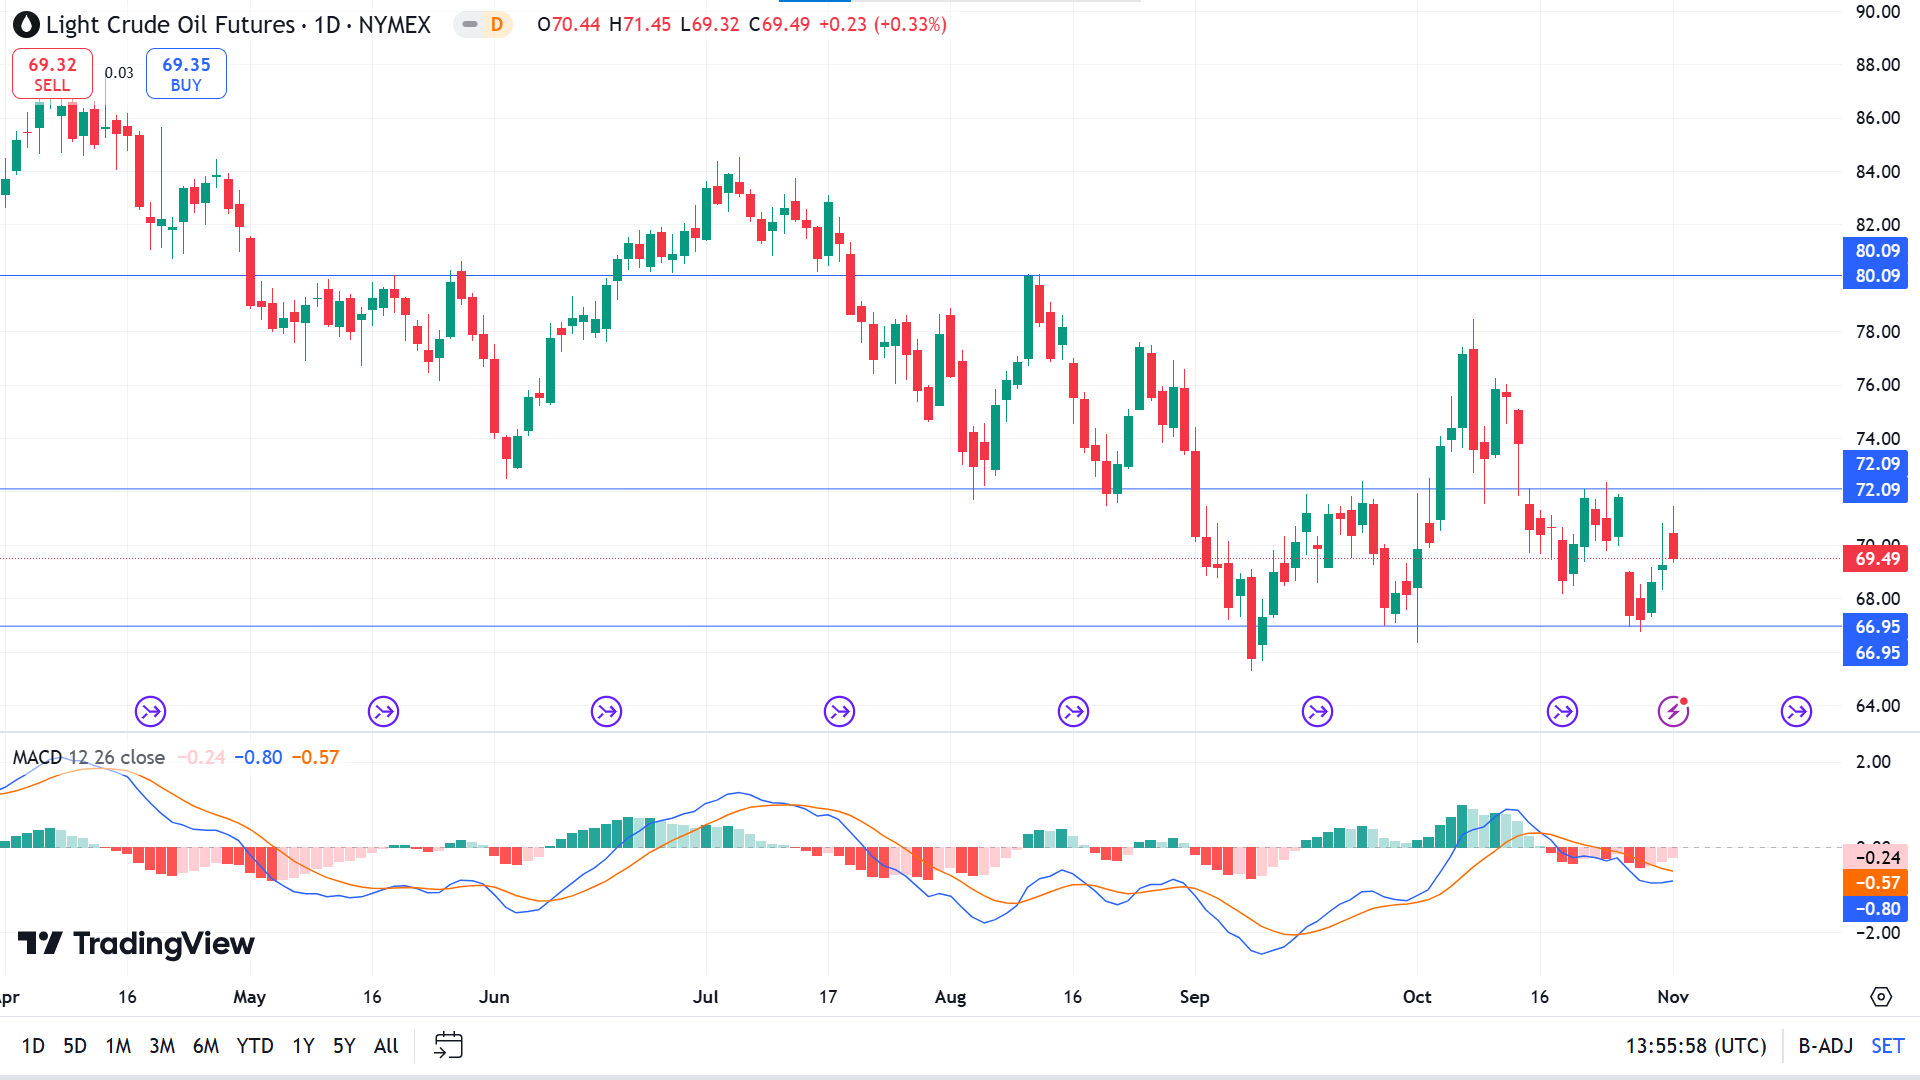
According to the daily chart of WTI, the ongoing market momentum is corrective within a descending channel. Moreover, the MACD Histogram remains bearish, signaling an ongoing bearish trend.
On the bullish side, buyers may look carefully at 66.95 to open long positions, which are valid until 72.09. A breakout may drive the price up to near 80.09.
Meanwhile, if the daily candle closes below the 66.95 level, the buy setup will be invalid and may enable a selling opportunity toward 64.54.


