EURUSD
Fundamental Perspective
The recent slide of the EURUSD pair below the 1.0700 mark reflects a complex interplay of economic indicators and political events affecting both the Eurozone and the United States. Political uncertainty in Europe, highlighted by far-right gains in France, Austria, and Germany during the European Parliamentary Elections, has led to investor concerns about potential shifts in fiscal policies, immigration, and climate-change measures. This political instability prompted a move from the Euro towards the safe-haven US Dollar.
Meanwhile, US economic data has painted a mixed picture. Softer-than-expected inflation figures weakened the Dollar as markets speculated the Federal Reserve might ease its monetary tightening. However, the Fed's decision to maintain interest rates and cautious inflation outlook contributed to a Dollar rebound. Easing Producer Price Index figures and a drop in consumer sentiment further highlighted economic caution, yet they did not prevent the Dollar from strengthening as investors sought stability amidst global uncertainty.
Despite record highs in the S&P 500, European markets suffered, weakening both local stocks and the Euro. The EURUSD pair appears poised for continued volatility, influenced by upcoming economic data releases and ongoing political developments. Investors should remain vigilant, as these evolving factors will likely shape market sentiment.
EURUSD Forecast Technical Perspective
The last weekly candle closed with a red body and wicks on both sides, posing two consecutive losing weeks. This reflects bearish pressure on the asset price, increasing the possibility of a downside continuation.
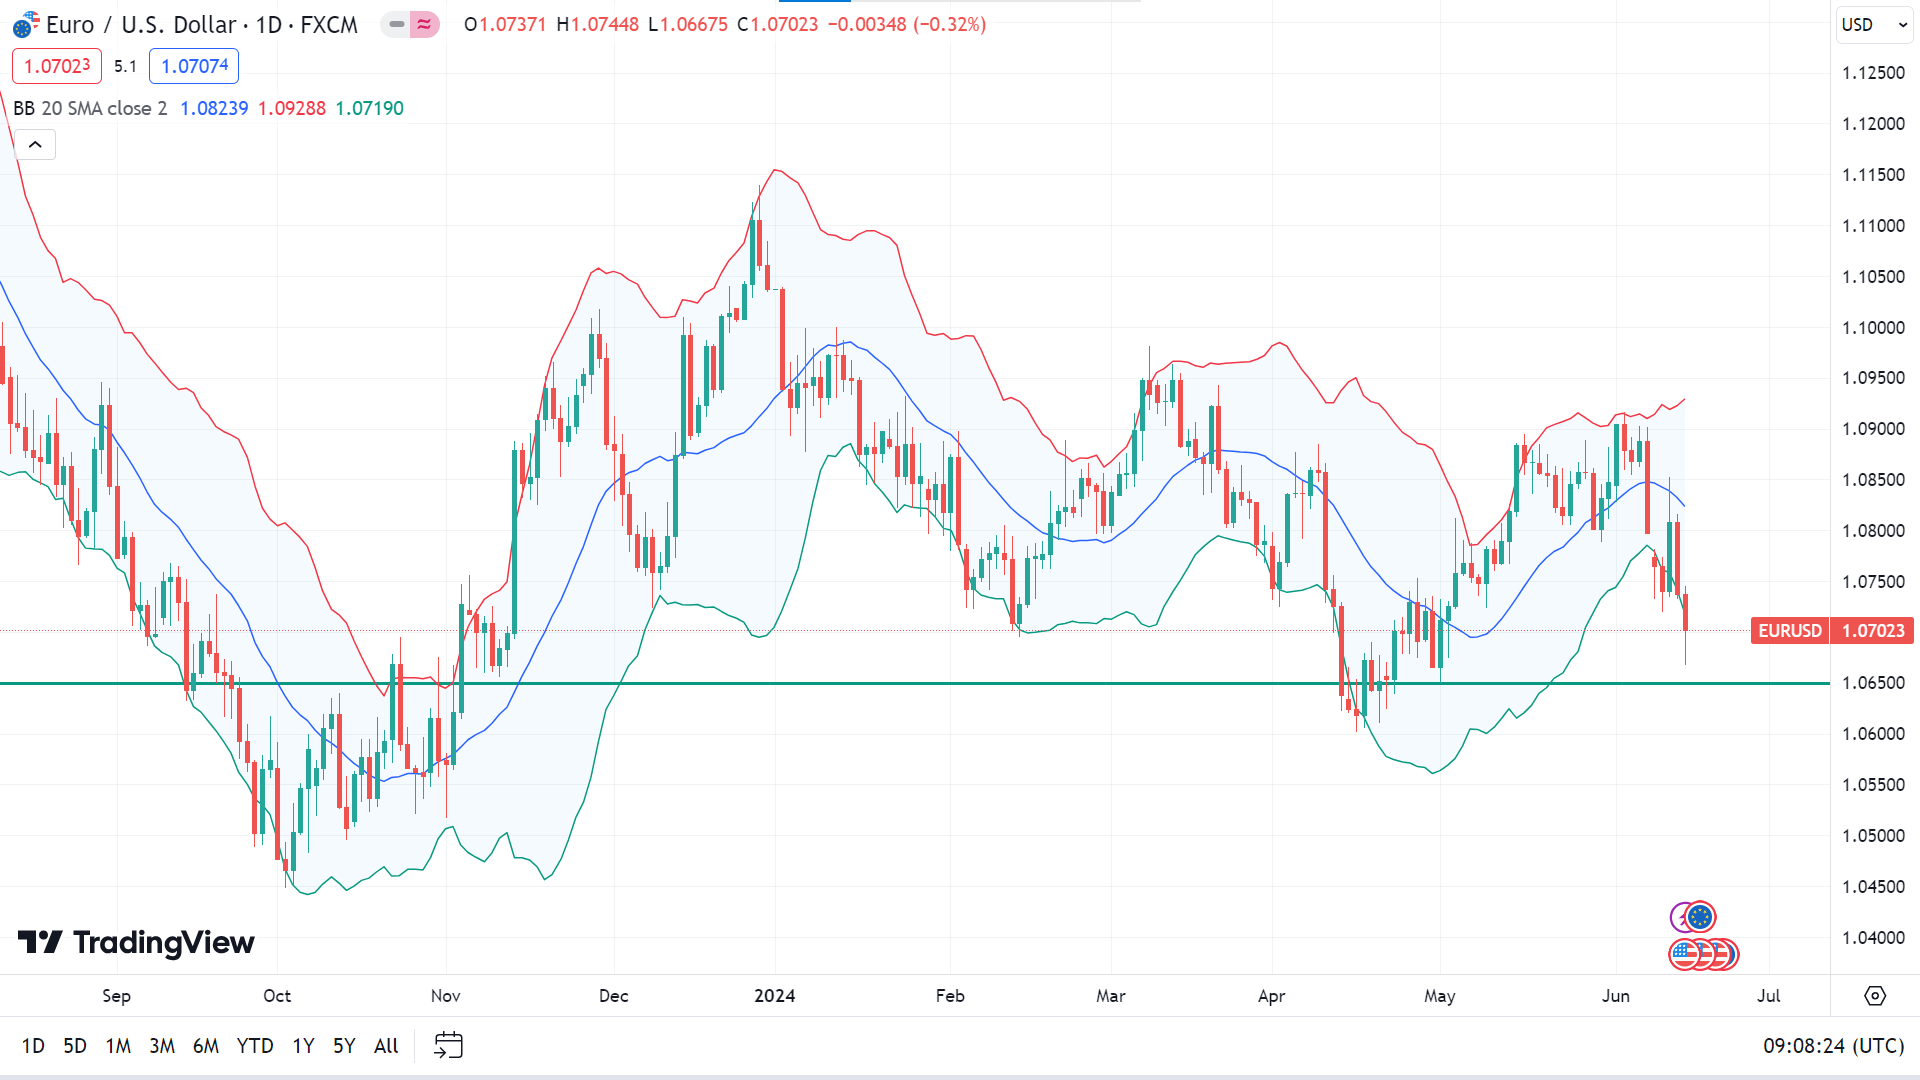
The price sinks below the lower band of the Bollinger Bands indicator, indicating significant bearish pressure on the asset price. In that case, the price may head toward the nearest support of 1.0650, followed by the next support near 1.0450.
Meanwhile, the lower band of the Bollinger Bands often indicates an oversold phase, indicating a pause may be expected in the current bearish trend, which can trigger the price to reach the nearest resistance of 1.0875, followed by the next resistance near 1.0981.
GBPJPY
Fundamental Perspective
The Japanese Yen edged lower on Friday after the Bank of Japan (BoJ) opted to maintain its interest rate at 0% during its June policy meeting. This decision marks the second consecutive meeting with unchanged rates following a hike in March, the first since 2007. However, the BoJ reduced bond purchases to allow more flexibility in long-term interest rates, and they are planning to finalize a strategy for further reductions over the next 1-2 years.
Meanwhile, the UK employment data released Tuesday had little impact on the Pound Sterling. With public appearances by Bank of England (BoE) policymakers cancelled ahead of the July 4 general elections in the UK, the currency remained influenced by US Dollar dynamics.
Looking ahead, attention shifts to the UK inflation report and the BoE's interest rate decision. Although no significant economic statistics are expected from either side of the Atlantic on Monday, China's activity numbers might engage traders. The UK CPI data for May will be published on Wednesday, followed by the BoE policy decision on Thursday. Concurrently, the UK Retail Sales data will be released on Friday, followed by S&P Global Preliminary Manufacturing and Services PMI.
GBPJPY Forecast Technical Perspective
The last weekly candle finished as a gravestone doji with a green body, after a hammer candle reflecting the consolidation phase or a pause at the current bullish trend, leaving optimism that the next candle can be another green one.
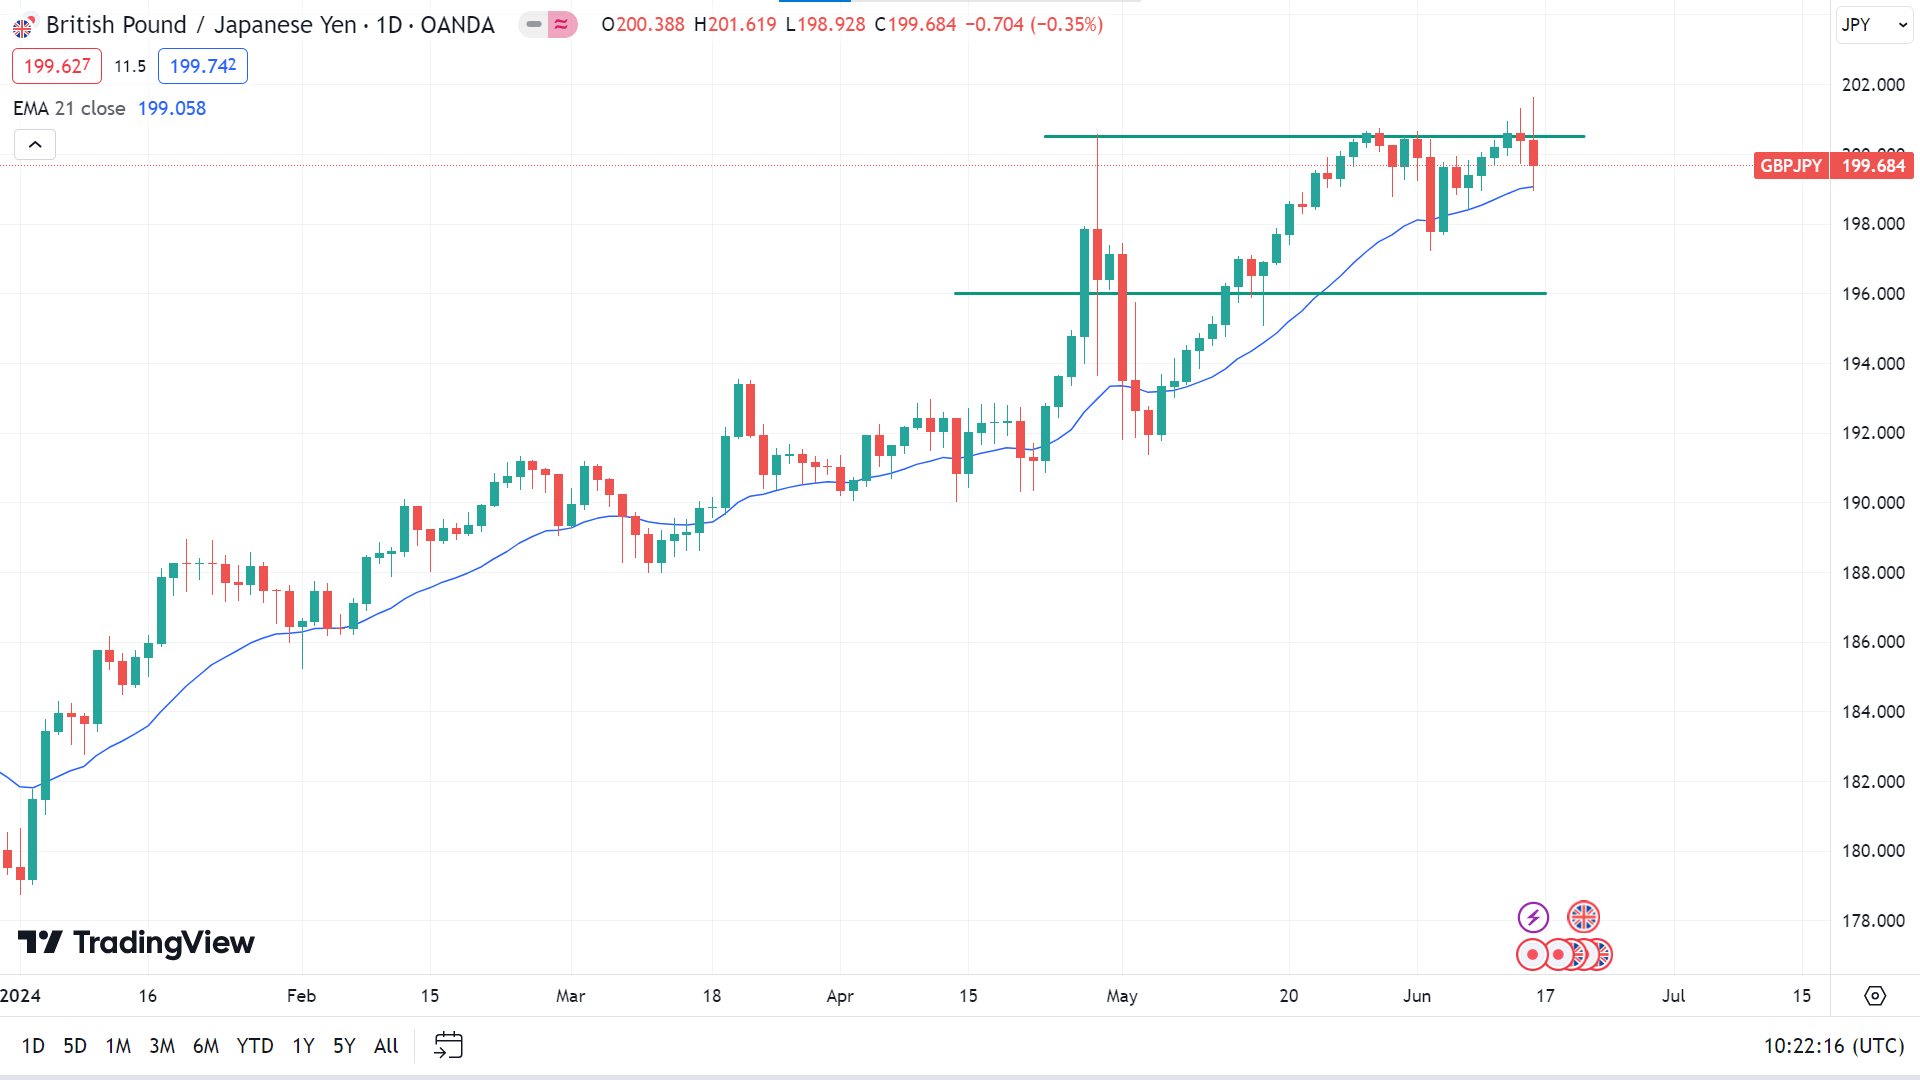
The price hovers above the EMA 21 line, reflecting fresh, significant bullish pressure on the asset price, which indicates it may reach the nearest resistance of 200.50. Any breakout can trigger the price to the next resistance, which is near 203.31.
On the negative side, if the price drops below the EMA 21 line, it can decline to the nearest support of 197.52, followed by the next historic support near 196.00.
Nasdaq 100 (NAS100)
Fundamental Perspective
The latest US Federal Reserve economic projections (dot plot) were released alongside the FOMC meeting, revealing a mildly hawkish surprise. As expected, the Fed maintained the Fed funds rate at 5.25%-5.50% for the seventh consecutive meeting. However, the median projected Fed funds rate for the end of 2024 is now 5.1%, suggesting only one rate cut before the year's end, compared to the previous forecast of three cuts and market expectations of two cuts in 2024.
Moreover, the median projection for core PCE inflation for 2024 and 2025 has been revised upward to 2.8% and 2.3%, respectively, from the earlier forecasts of 2.6% and 2.2%. This guidance underscores the Fed's cautious stance on rate cuts, maintaining a data-dependent approach.
In the press conference, Fed Chair Jerome Powell emphasized the need for more data to justify rate cuts despite acknowledging modest progress toward the 2% inflation target. The dovish camp found a glimmer of optimism in the projection of an additional rate cut in 2025, forecasting four cuts compared to three in March's dot plot.
These forward guidance adjustments highlight the Fed's cautious approach to rate cuts and reliance on forthcoming data. Powell’s remarks reinforce the commitment to a prudent, data-driven policy strategy, maintaining flexibility in response to evolving economic conditions.
Technical Perspective
The last weekly candle closed in solid green, reflecting solid bullish pressure on the asset price, leaving optimism for buyers as the next candle might be another green one.
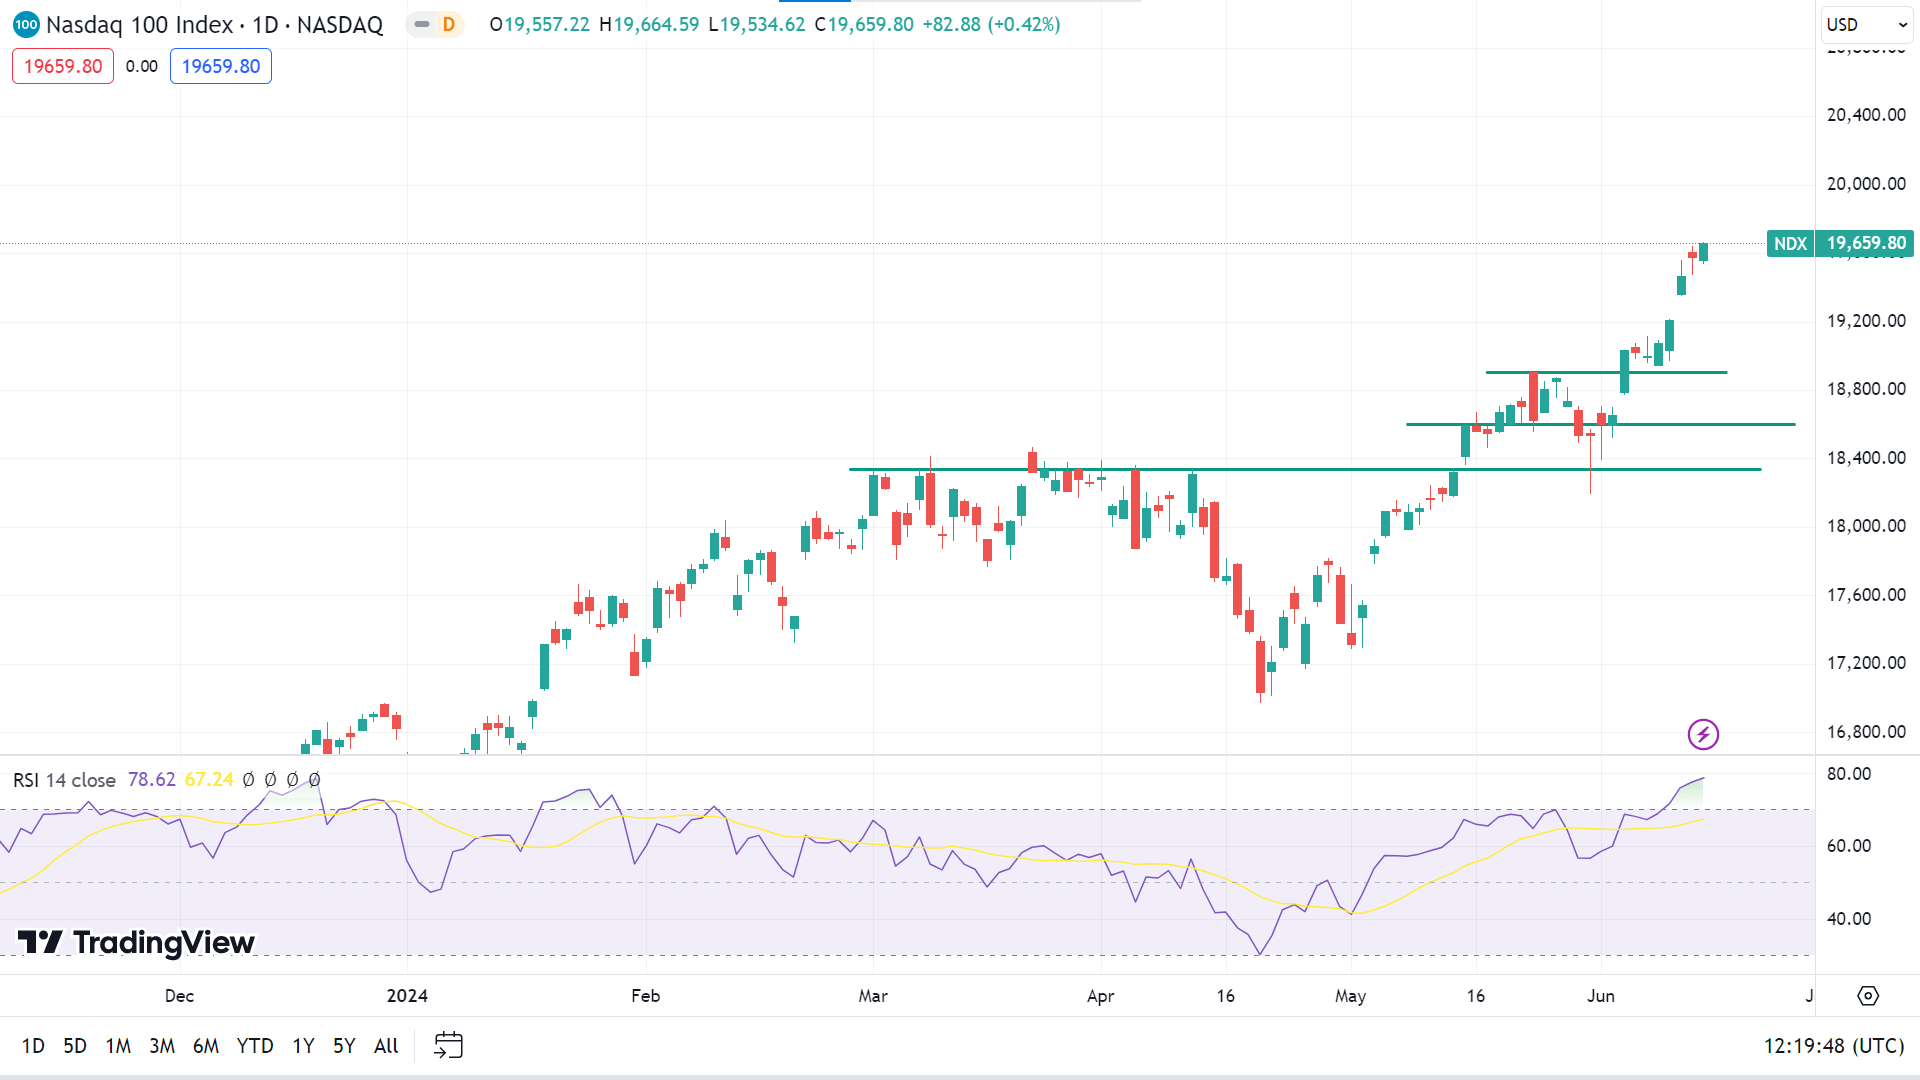
The price is bullish on the daily chart, and the RSI indicator reading remains overbought. This shows buyers' domination at the asset price, indicating it may reach the $2000 mark or beyond.
On the negative side, any pause in the current trend can trigger the price to drop to the nearest support of $19.278.78, followed by the next support near $18,242.85.
S&P 500 (SPX500)
Fundamental Perspective
The S&P 500 index increased 1.6% this week, reaching fresh highs led by the technology sector. On month-to-date, it is up 2.9%, with a 14% gain for the year.
Tech sector strength drove the rise despite the Federal Open Market Committee reducing its projected 2024 rate cuts to one. The committee kept the benchmark rate unchanged on Wednesday, adjusting its projections from three to one rate cut this year.
Technology stocks surged 6.4%, followed by gains in real estate at 1.2% and communication services at 0.9%. Broadcom (AVGO) led the tech rally, soaring 23% after raising its full-year revenue outlook on robust fiscal Q2 results, driven by AI demand and VMware software. Oracle (ORCL) shares increased by 9.7% due to optimistic growth forecasts and new cloud partnerships with OpenAI and Google.
Conversely, the energy sector fell 2.3%, financials dropped 2%, consumer staples declined 1.2%, and industrials lost 1%. APA Corp. (APA) shares fell 3.6% following an investment rating downgrade by Evercore ISI, reducing its price target to $39 from $52.
Upcoming economic data includes May retail sales and industrial production on Tuesday, housing starts and building permits on Thursday, and existing home sales on Friday.
Technical Perspective
The last weekly candle closed in solid green, supporting the current strong bullish trend, indicating the next candle can be another green one.
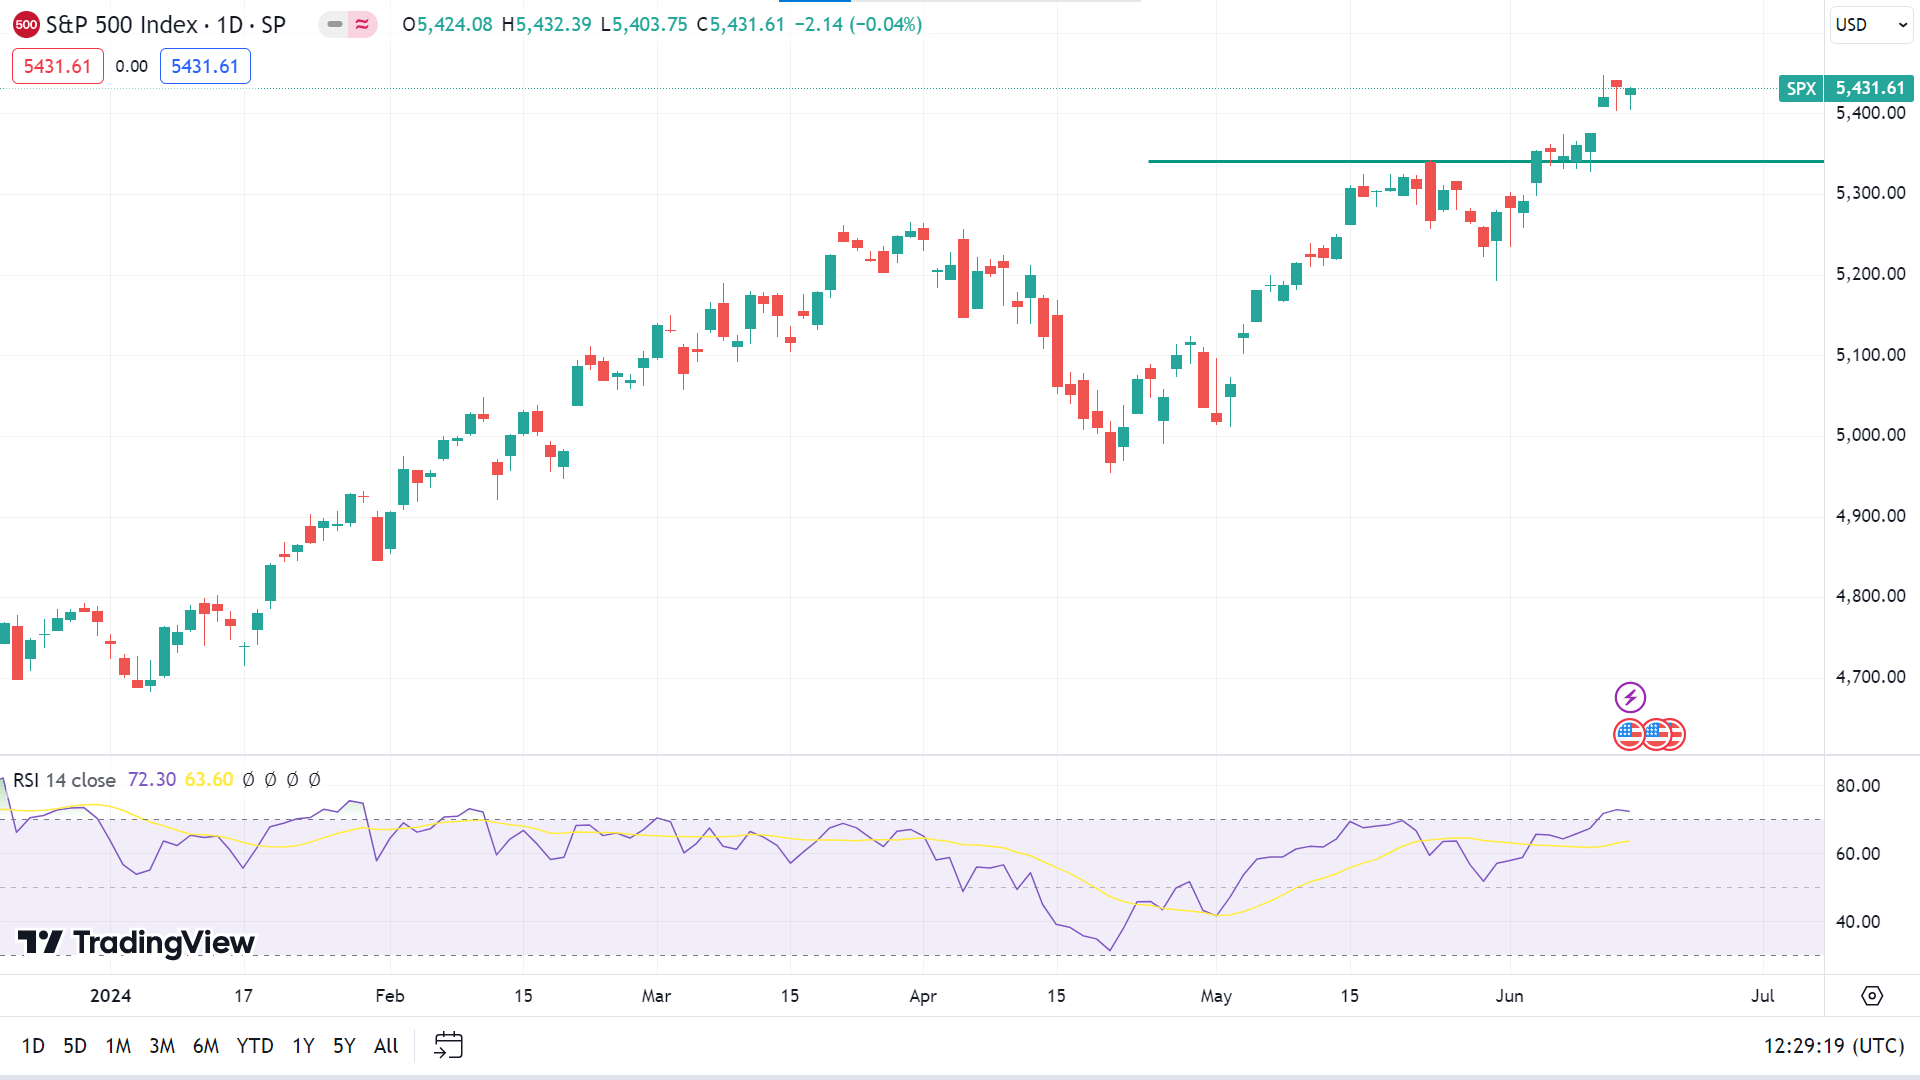
The price continues to gain rapidly on the daily chart, as the RSI indicator reading remains overbought. This suggests the price may head to the nearest resistance of $5540.97, followed by the next resistance near $5871.80.
Meanwhile, on the negative side, if the RSI indicator reading starts to slop downside and any pause on the current bullish trend, it can trigger the price to drop to the nearest support of $5336.52, followed by the next support near $5256.31.
Bitcoin (BTCUSD)
Fundamental Perspective
Cryptocurrency analyst Ali Martinez recently reported a significant Bitcoin selling spree by miners and large whales, collectively offloading over $4.1 billion worth of Bitcoin. According to data from Santiment, whales sold more than 50,000 BTC in the past ten days, valued at approximately $3.30 billion. Additionally, Bitcoin miners sold over 1,200 BTC, worth nearly $80 million. This massive sell-off has added to the downward pressure on Bitcoin's price.
Over the past week, Bitcoin's value dropped nearly 9%, from $71,655 to $65,228. However, it has shown a modest recovery, trading at $66,222 when writing.
Cryptocurrency trader Willy Woo noted that longtime Bitcoin holders, or "original gangsters" (OGs), are actively selling, a recurring pattern in every bull market. Woo pointed out that these OGs possess more BTC than all spot Bitcoin ETFs combined, underscoring their market impact.
Despite the sell-off, large players are still buying Bitcoin. Martinez noted that within 48 hours this week, whales withdrew roughly $1 billion worth of Bitcoin (14,140 BTC) from crypto exchanges, indicating ongoing interest from major investors.
Bitcoin Price Prediction Technical Perspective
The last weekly candle closed solid red and failed to regain the peak, declaring fresh bearish pressure on the asset price and signaling that the next candle can be another red one.
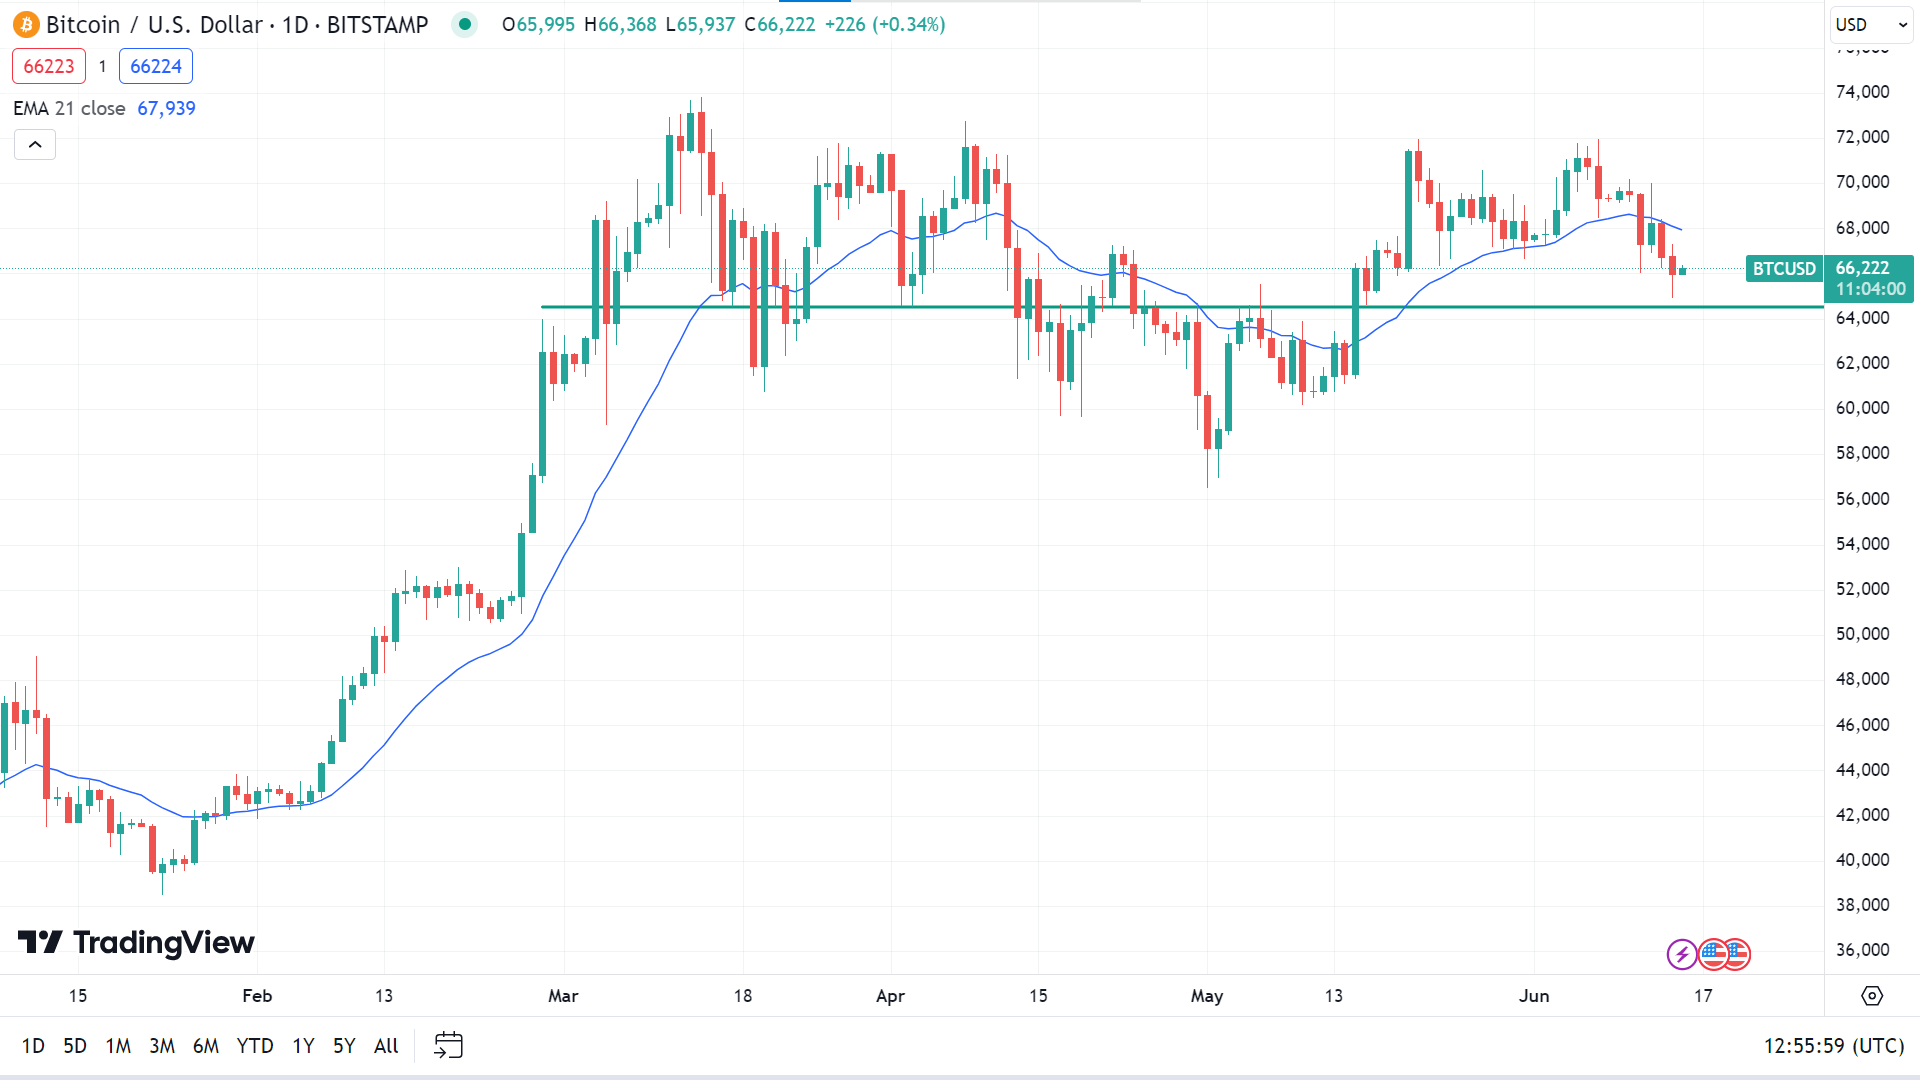
On the daily chart, the price drops below the EMA 21 line, reflecting solid selling pressure on the asset price. This indicates that the price can drop to the nearest support of $64,518, followed by the next support of $61,381.
However, if the price exceeds the EMA 21 line on the upside, it can regain the primary resistance of $70,055, followed by the next resistance near $73,216.
Ethereum (ETHUSD)
Fundamental Perspective
The recent announcement of a spot Ethereum ETF (Exchange Traded Fund) in the struggling cryptocurrency market has sparked renewed optimism among investors and institutions. On June 15, 2024, Bloomberg ETF expert Eric Balchunas highlighted that the spot Ethereum ETF might begin trading in the U.S. as early as July 2, 2024.
Balchunas mentioned that the SEC’s feedback on the ETF applicants’ S-1 registration filings was minimal, suggesting a quick turnaround. This implies the possibility that the SEC will finalize approvals before July 4, 2024. However, some uncertainty remains as the SEC’s Division of Corporation Finance still needs to review the applications. The light feedback indicates a faster-than-expected process. Although the SEC approved several 19b-4 filings to list spot Ethereum ETFs on U.S. exchanges on May 23, 2024, these ETFs cannot trade until their S-1 forms receive final approval.
SEC Chair Gary Gensler indicated that these ETFs might start trading within the next three months, by the end of September, depending on how quickly applicants address any feedback from the SEC.
Following this update, Ethereum whales and investors accumulate Ethereum and other Ether-based tokens. An on-chain analytic firm, Lookonchain, reported that a wallet linked to Amber Group withdrew 2,638 ETH worth $9.2 million and 987,053 UNI tokens worth $10.6 million from Binance. This accumulation might influence other whales, suggesting it could be an opportune time to add tokens before a market rebound.
Ethereum has been trading for nearly $3,560, with a 0.6% gain in the last 24 hours. Over the past week, Ethereum is down 4%, but it has risen 22% in the last 30 days.
Ethereum Price Prediction Technical Perspective
The last weekly candle was finished with a red body and lower wick, indicating three consecutive losing weeks, signaling that the next candle can be another red one.
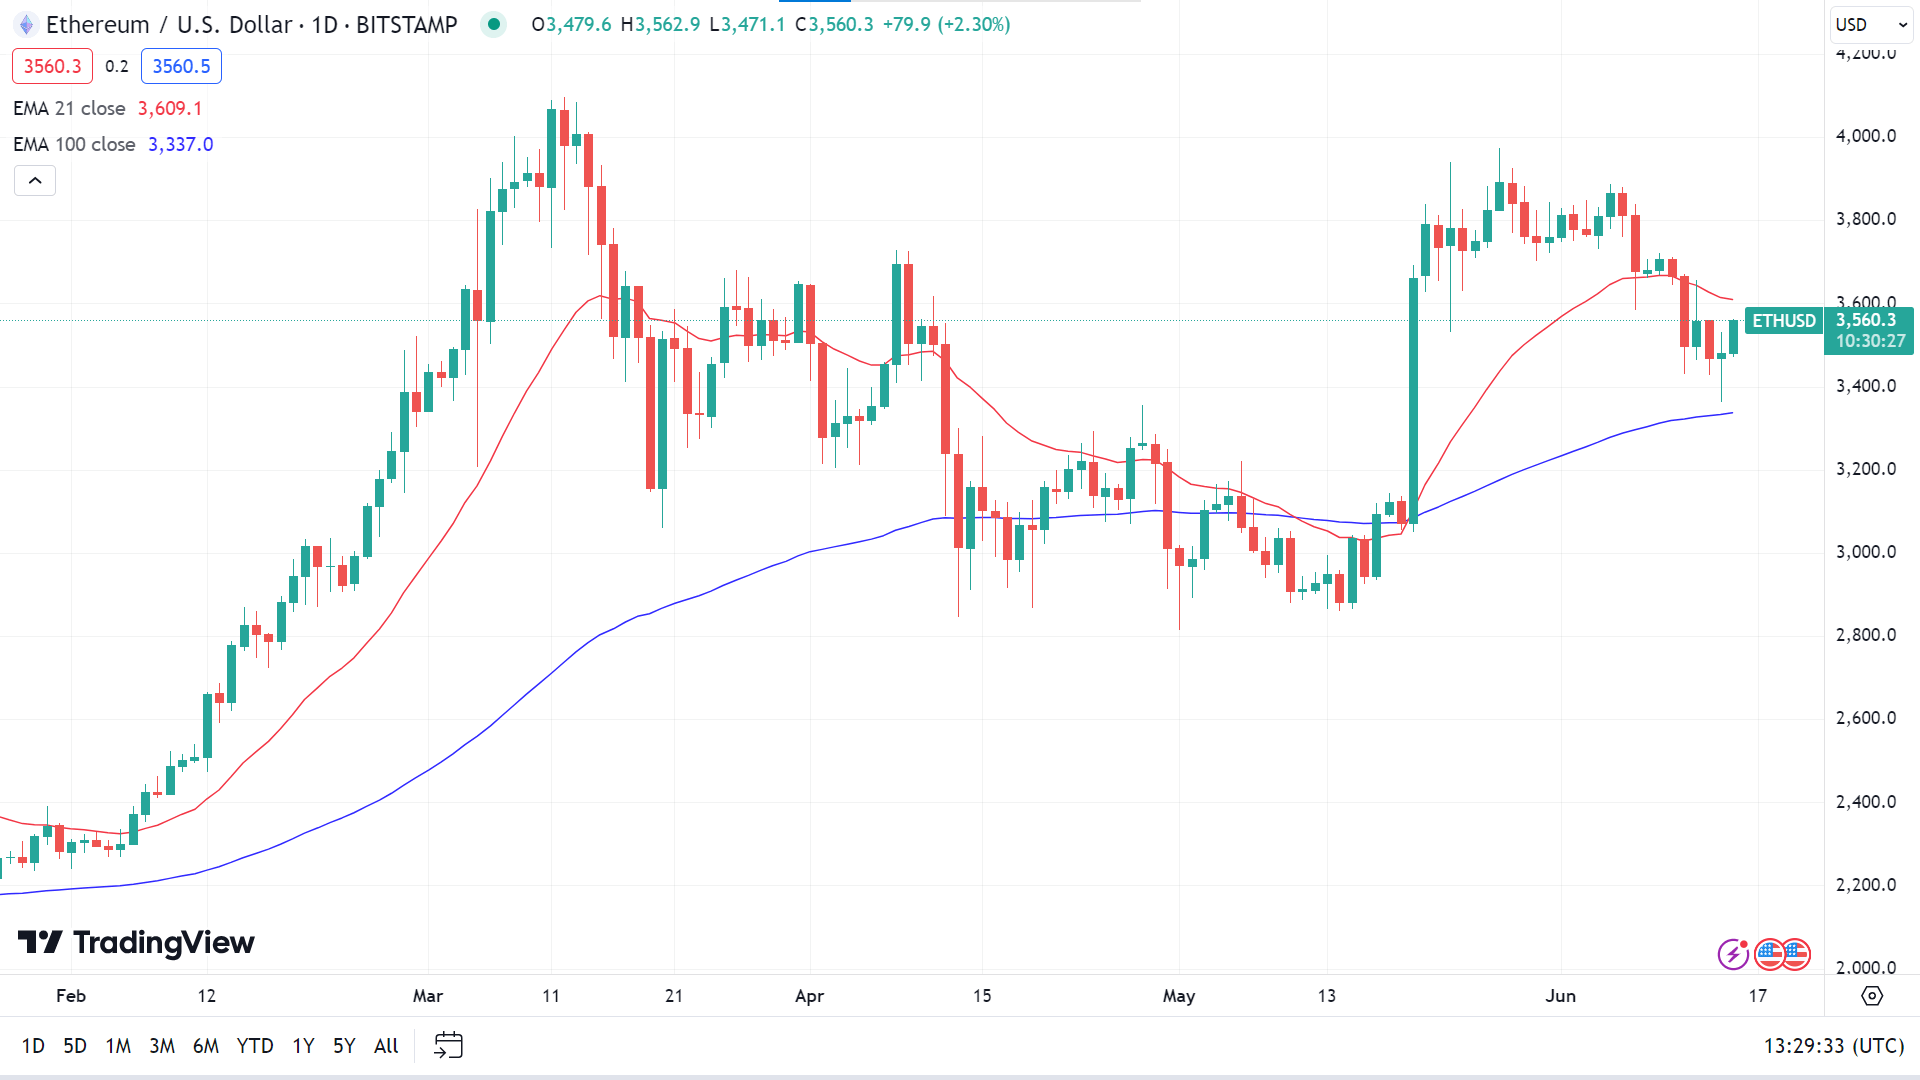
The price floats between the EMA 21 and EMA 100 lines, reflecting consolidation and indecision. If it reaches above the EMA 21 line, it will indicate that the price may head toward the recent peak near $3869.10, followed by the next resistance near $4084.70.
On the other hand, if the price declines below the EMA 100 line, it can decline to the primary support of $3073.30, followed by the next support near $2890.30.
Gold (XAUUSD)
Fundamental Perspective
Gold (XAU/USD) experienced modest gains this week, supported by safe-haven flows and softer US inflation data. With no significant macroeconomic releases on the horizon, investors are now focusing on technical developments in XAU/USD and comments from Federal Reserve officials.
After a sharp decline last Friday due to strong US labour market data, Gold corrected higher on Monday. Modest gains continued on Tuesday as markets adopted a cautious stance.
The Bureau of Labor Statistics reported on Wednesday that the US Consumer Price Index (CPI) dipped to 3.3% year-over-year in May, down from 3.4% in April. The core CPI, excluding volatile food and energy prices, rose 3.4%, slightly below expectations. This data lifted Gold above $2,340 as the USD weakened.
The Fed kept its policy rate steady at 5.25%-5.5% and revised its projections, suggesting only one rate cut in 2024, down from three. This hawkish stance supported the USD, causing Gold to retreat from its daily highs.
Fed Chair Jerome Powell emphasized the need for consistent "good data" before considering a policy shift. Despite mixed US economic data, gold lost traction on Thursday as the USD regained strength.
Despite mixed US data on Thursday, Gold regained momentum on Friday amid a risk-averse market and European capital outflows from the Euro due to political concerns. Investors now await upcoming economic data from China and the comments of US and Fed officials to gauge the next moves for Gold.
Gold Price Prediction Technical Perspective
On the weekly chart, the last candle closed solid green after three consecutive losing weeks, reflecting bulls may come back after, and the next candle can be another green one.
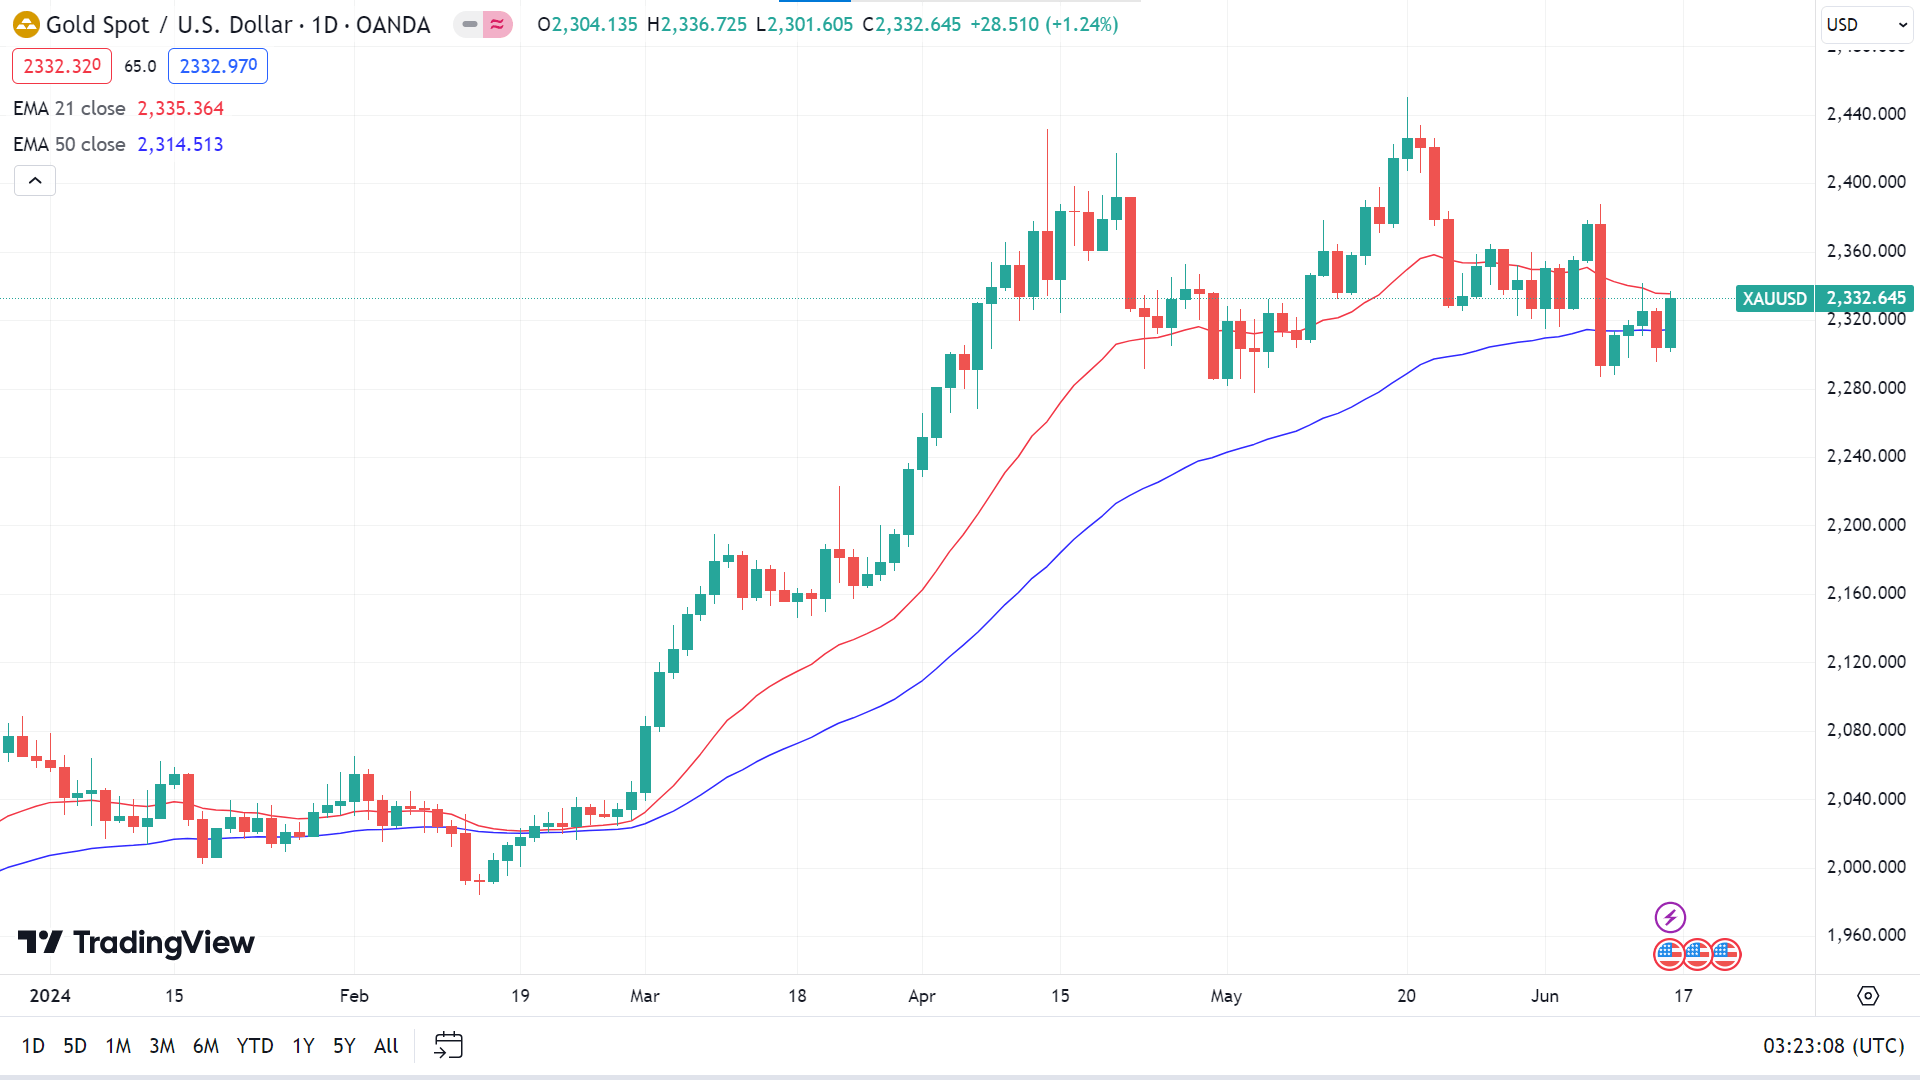
The price is just below the EMA 21, signalling short-term bearish pressure and above the EMA 50 line, supporting the bullish trend on the daily chart. So, the price surpasses the EMA 21 line on the upside, indicating bullish domination. It may reach the peak of $2387.78, followed by the next resistance near $2450.12.
On the negative side, the price gets below the EMA 50 line, which will signal seller domination on the asset price, and the price may drop to the primary support of $2277.34. Any breakout of that level can trigger the price to reach the next support level near $2222.91.
Tesla Stock (TSLA)
Fundamental Perspective
Elon Musk recently displayed vitality on stage, dancing and animatedly discussing a future with billions of humanoid robots, envisioning Tesla’s valuation soaring to $30 trillion. This spirited return came after shareholders voted to reauthorize his $48 billion pay package, reversing a Delaware judge's earlier decision that had thrown Tesla into turmoil.
"We're headed for a wild future," Musk proclaimed during the two-hour shareholder meeting in Austin, Texas. His optimism, however, contrasts with investor concerns over declining first-quarter car sales and rising competition from China. Despite years of promises, fully driverless car technology still needs to be discovered.
"Admittedly, I'm a little optimistic sometimes," Musk said with a laugh, acknowledging his self-awareness. Yet, his enthusiasm followed months of tension, including threats to divert his best ideas elsewhere if not granted 25% of Tesla's shares. Such ultimatums can undermine relationships, much like threatening divorce in a moment of anger.
This tension has also manifested in two lawsuits filed in Delaware last week, accusing Musk and the Tesla board of wrongdoing, partly due to his efforts to create a separate AI company that might compete with Tesla. While Tesla hasn't responded to these claims, Musk suggests his startup, xAI, could ultimately benefit Tesla.
Tesla Stock Forecast Technical Perspective
The last weekly candle closed as a doji, posting four consecutive green doji candles, which reflects the price moving sideways and needing to be more precise. So, the next candle can be either green or red.
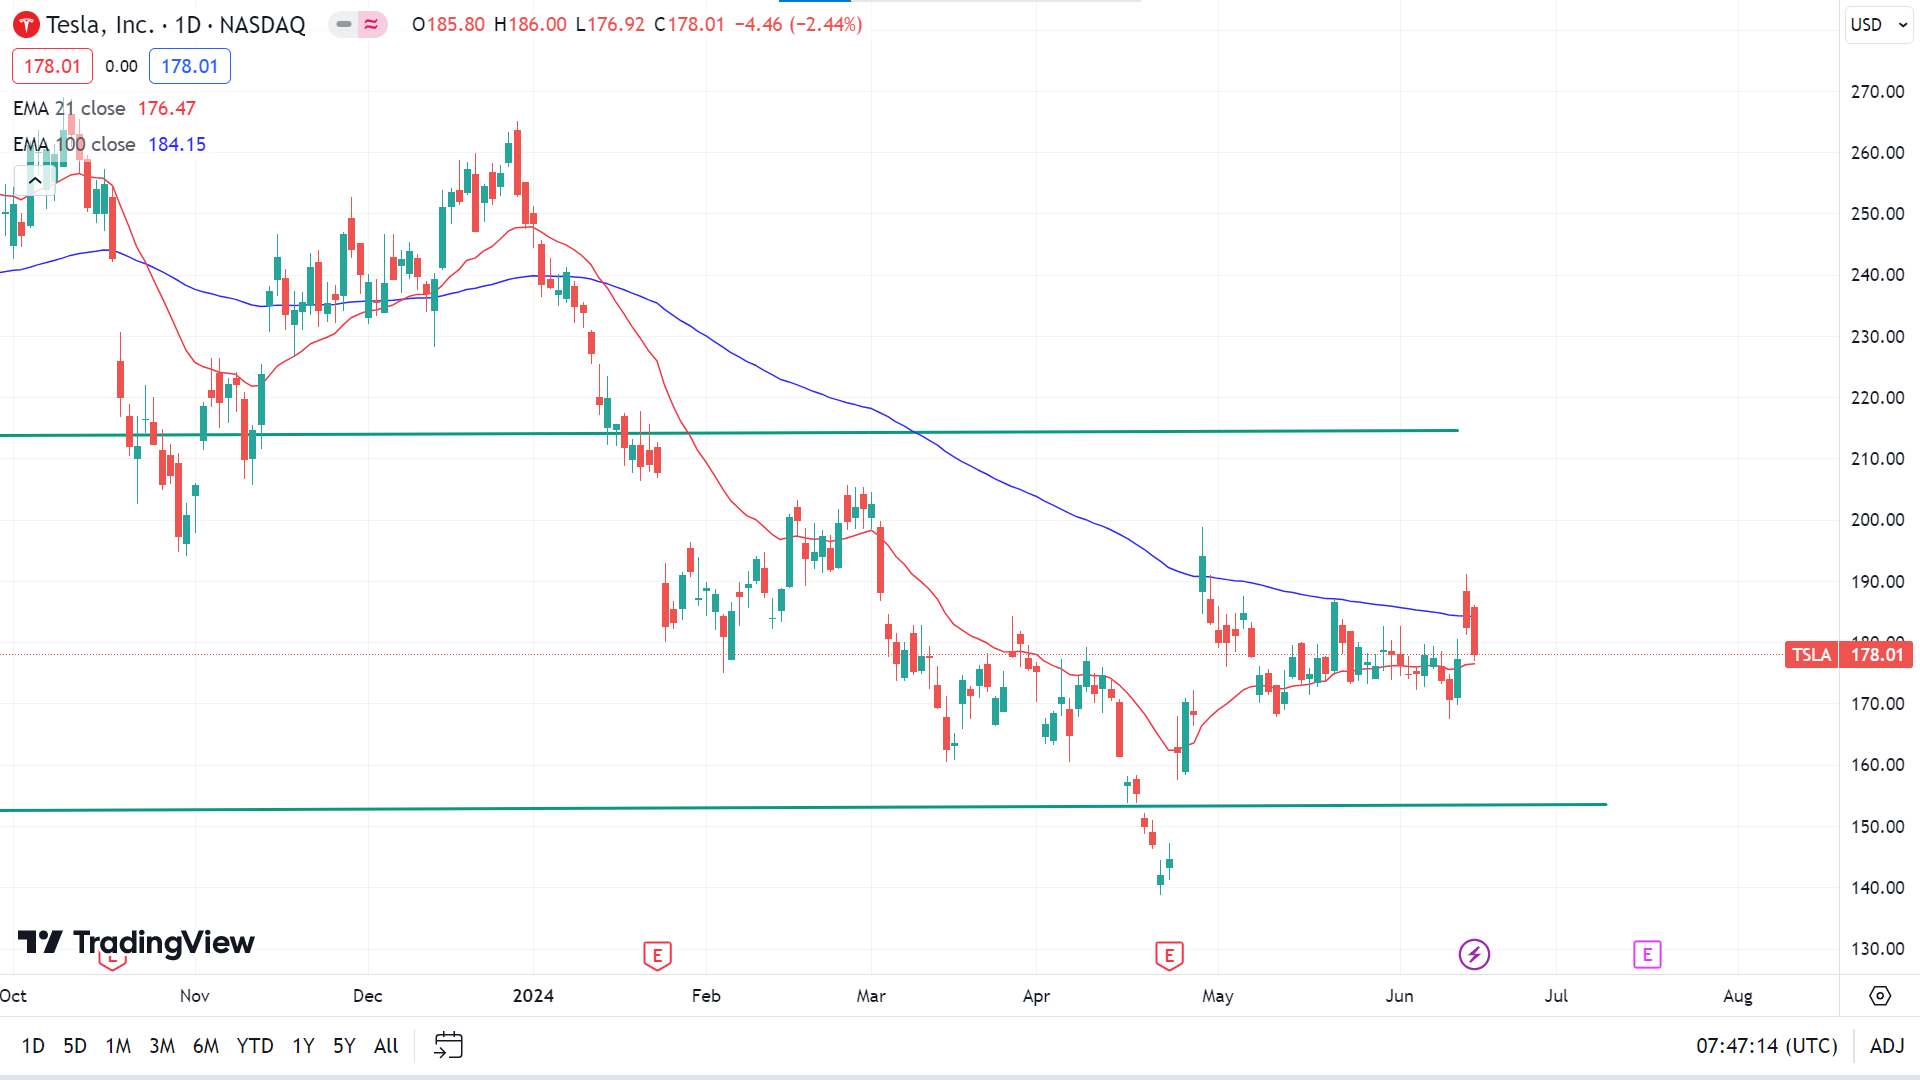
On the daily chart, the price is moving above the EMA 21 line and below the EMA 100 line, showing consolidation. With significant bullish pressure, the price will reach above the EMA 100, enabling room for the price to reach the nearest resistance of $185.36, followed by the next resistance near $190.04.
On the negative side, if the price declines below the EMA 21 line, it can drop to the primary support of $170.23. Meanwhile, the next support is nearly $165.55.
Nvidia Stock (NVDA)
Fundamental Perspective
The semiconductor rally continues its unstoppable ascent, driven by the rapid growth of artificial intelligence. It has propelled the U.S. chipmaking industry to a combined valuation of $6.3 trillion.
Nvidia Corp. (NVDA) recently surpassed a $3 trillion valuation, representing nearly half of the U.S. semiconductor industry’s worth. The company is now competing for the title of the world’s largest company alongside giants such as Microsoft Corp. (MSFT) and Apple Inc. (AAPL).
George Smith, portfolio strategist for LPL Financial, said, “Given NVDA's dominance in the nascent AI space, it may be only a matter of time before NVDA surpasses MSFT to become the most valuable company in the world”. Smith suggests that the NVDA rally will likely continue as tech-related ETFs are expected to increase their exposure to the chipmaker during their next rebalancing.
Nvidia Stock Forecast Technical Perspective
The last weekly candle closed solid green, posting several consecutive gaining weeks reflecting intense bullish pressure on the asset price. The next candle might be another green one.
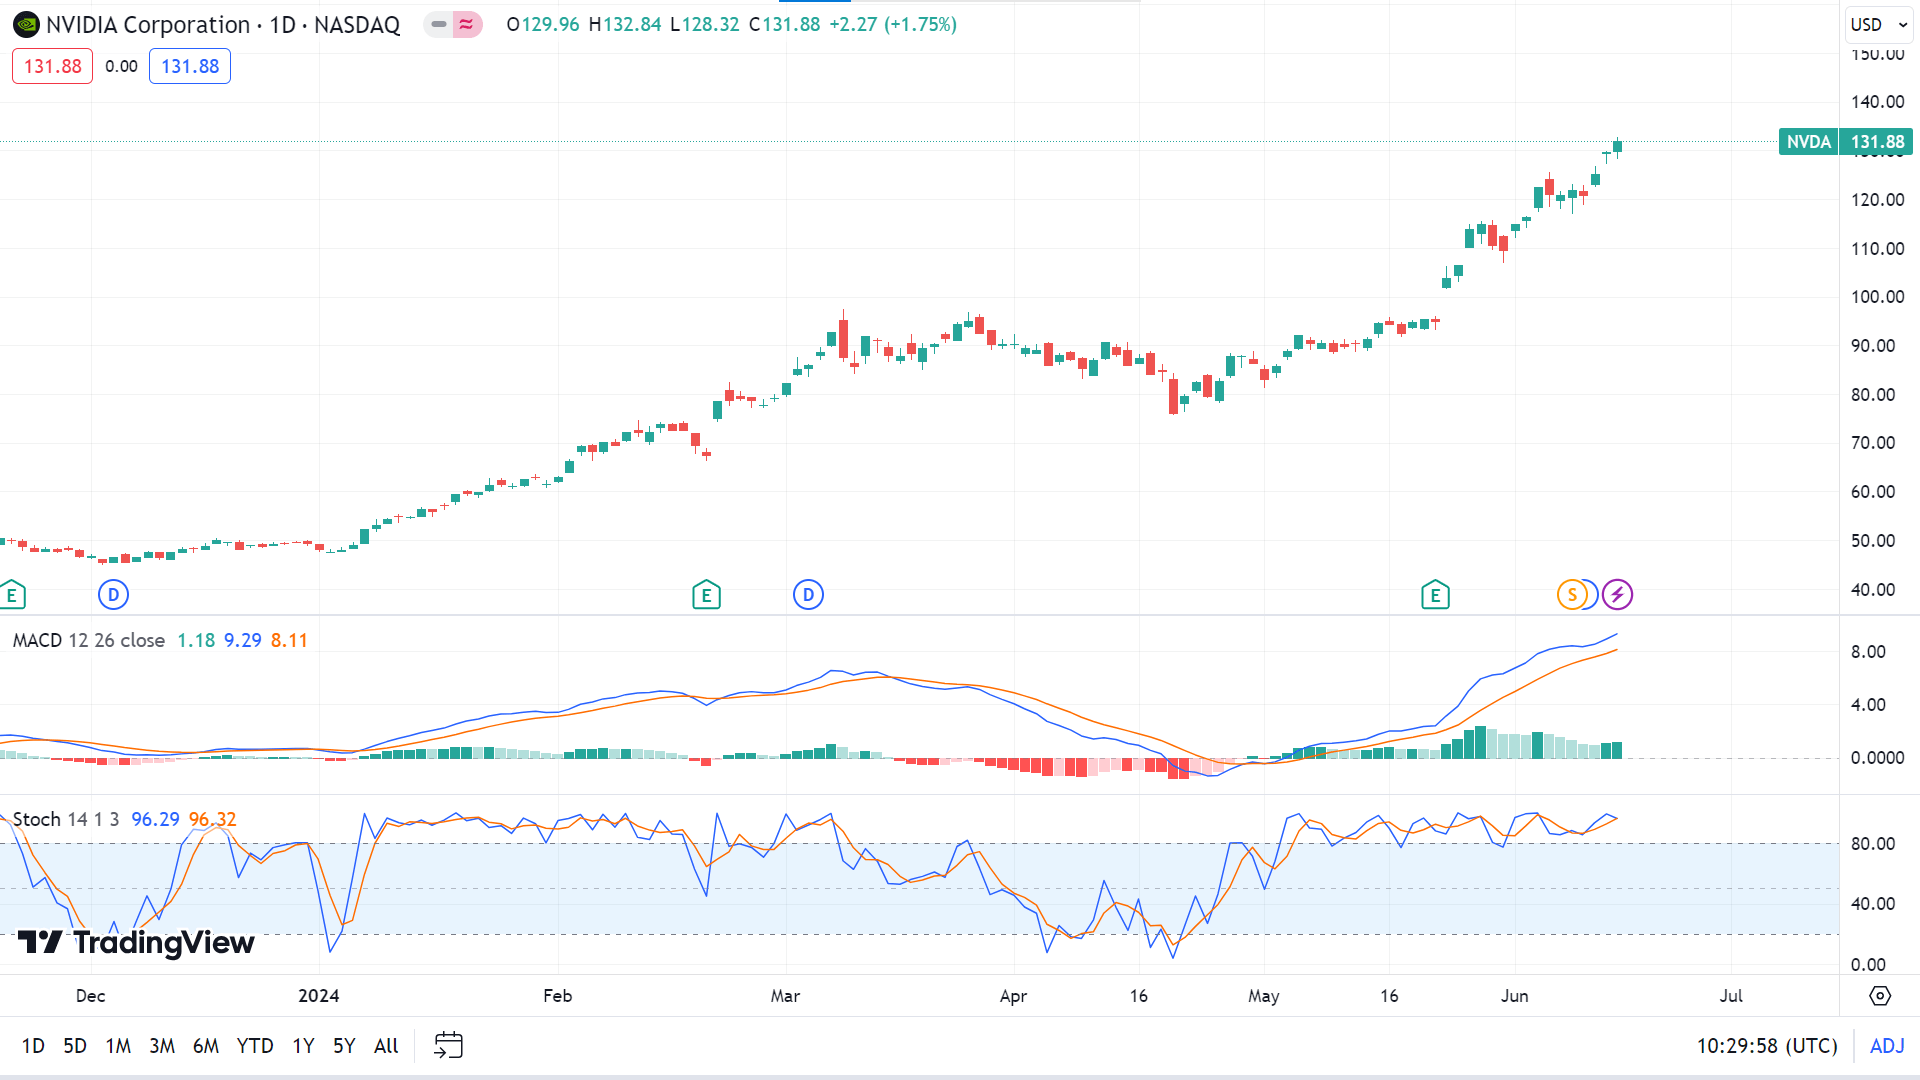
As the MACD indicator window suggests on the daily chart, the price is moving on a solid uptrend. However, the Stochastic indicator reading shows neutral as the signal lines come closer to the overbought territory. So, according to the MACD indicator reading, the price may head toward a new peak of $136.80 or more.
Meanwhile, any pause on the current bullish trend may trigger the price to decline toward the current support of $125.03, while the next support is $120.94.
WTI Crude Oil (USOUSD)
Fundamental Perspective
West Texas Intermediate (WTI) Oil prices climbed to around $77.80 per barrel during Friday's Asian session, buoyed by optimistic projections for crude demand through the end of the year. Reuters reported that the Energy Information Administration (EIA) has increased its 2024 global Oil demand growth forecast to 1.10 million barrels per day (bpd), up from the previous estimate of 900,000 bpd. Similarly, the Organization of the Petroleum Exporting Countries (OPEC) upheld its positive outlook for 2024, anticipating heightened travel and tourism in the year's second half.
Russia's energy ministry announced on Thursday that its May Oil production exceeded the quotas set by the OPEC+ alliance. The ministry acknowledged this overproduction and stated that corrective measures would be implemented in June to align with the agreed production levels.
Meanwhile, as widely expected, the Federal Open Market Committee (FOMC) kept its benchmark lending rate steady at 5.25%–5.50% during its June meeting. Elevated interest rates could potentially curb economic growth, thereby affecting Oil demand.
The US Dollar Index (DXY), which measures the dollar against six major currencies, increased to around 105.30. When writing, the yields on 2-year and 10-year US Treasury bonds stood at 4.71% and 4.26%, respectively. A stronger US Dollar makes Oil more expensive for international buyers, thus dampening demand.
Oil Prices Forecast Technical Perspective
On the weekly chart, the last candle finished solid green after posting consecutive losing candles, declaring the price may recover the loss and indicating the next candle might be another green one.
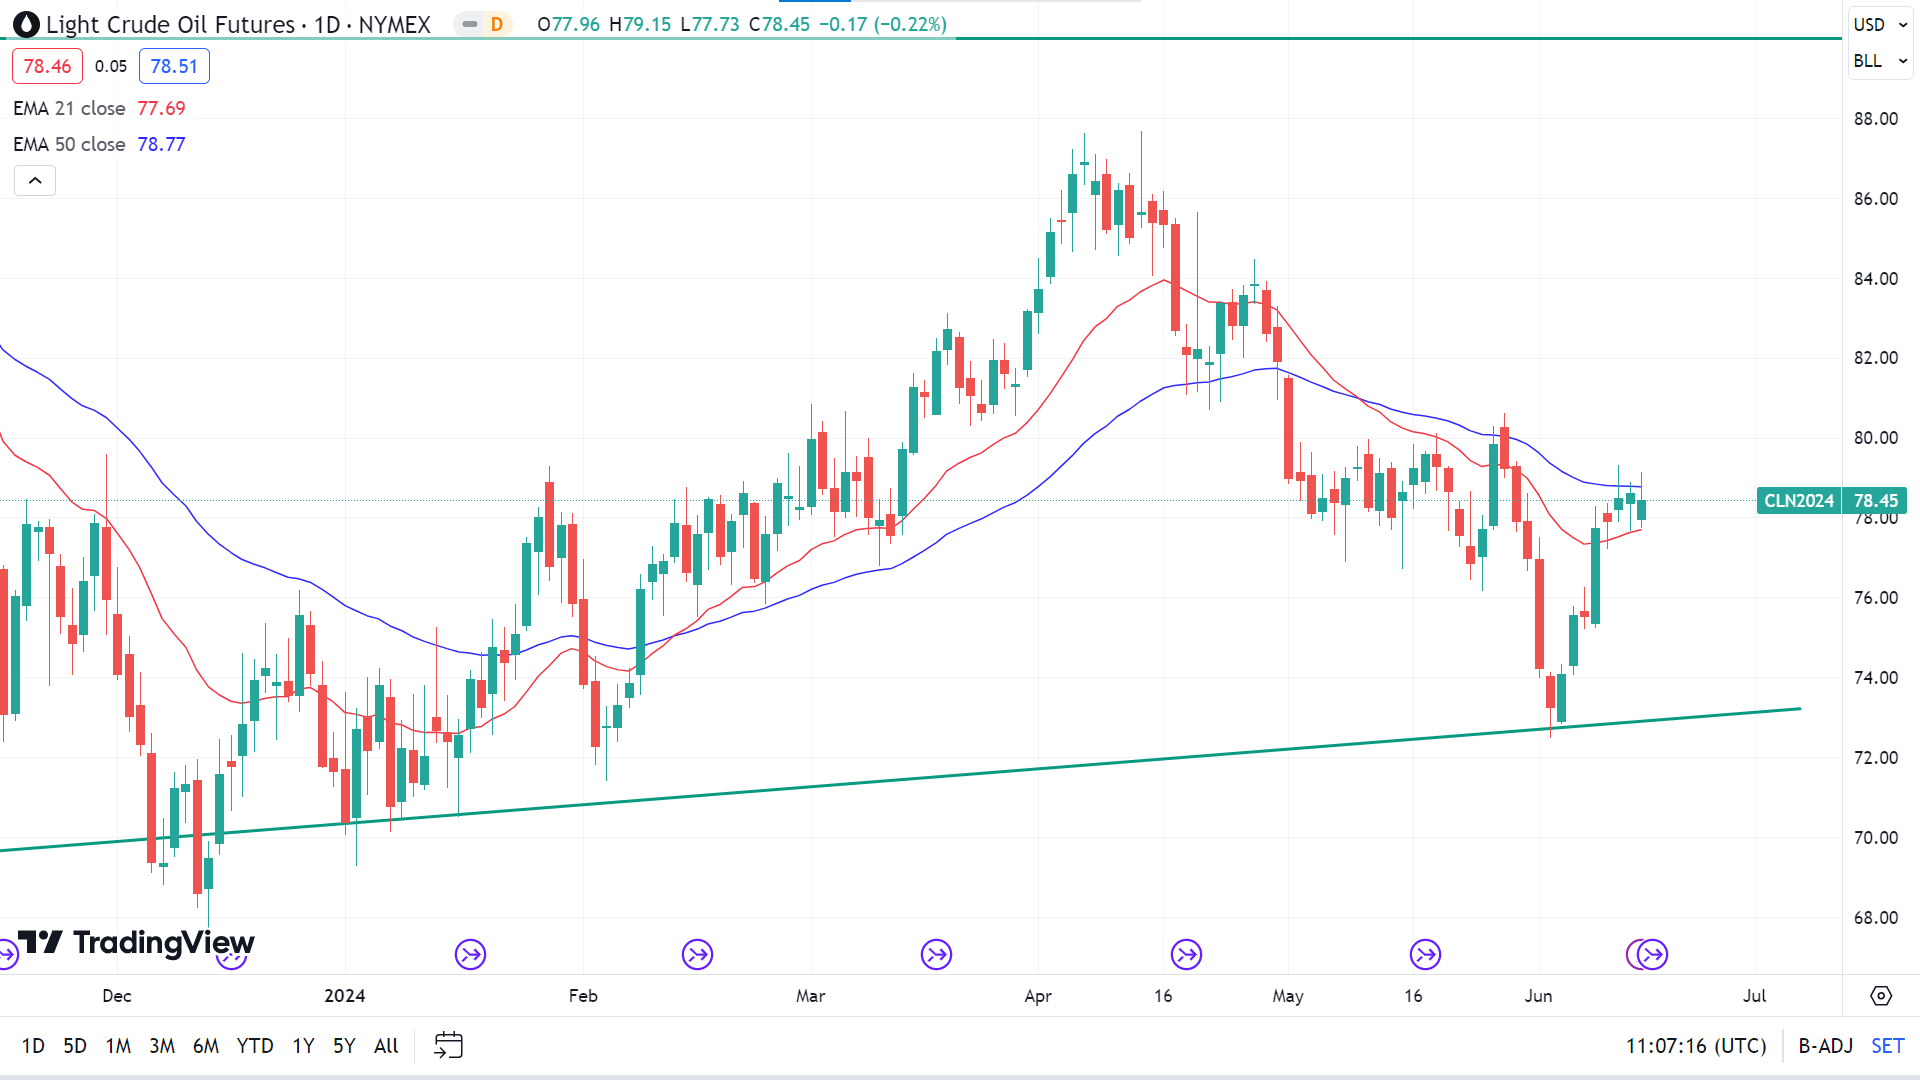
On the daily chart, the price may face some resistance at the EMA 50 while staying above the EMA 21 line, leaving buyers hopeful. Any reading above the EMA 50 might trigger the price to the previous peak of $80.62, followed by the next resistance near $84.86.
However, if the price declines below the EMA 21 line, it might send the price to the primary support of $76.17. Meanwhile, the next support is nearly $72.82.