
EURUSD
Fundamental Perspective
This week, the EURUSD pair remained within familiar levels, influenced by a lack of significant macroeconomic data and comments from Federal Reserve officials. American policymakers continued to temper expectations for interest rate cuts, fostering a risk-averse market environment. Concurrently, European Central Bank representatives reiterated their intention to reduce interest rates in June, though a July cut is not guaranteed.
Germany's Harmonized Index of Consumer Prices (HICP) rose by 0.2% month-on-month and 2.8% year-on-year, while the Eurozone's HICP increased to 2.6%. In the US, the April Personal Consumption Expenditures Price Index showed a 0.3% monthly rise, with annual inflation steady at 2.7%.
As the June ECB meeting approaches, markets anticipate a 25 basis point rate cut, which could initially push the Euro down by about 100 pips against the US Dollar. The focus will then shift to ECB President Christine Lagarde's statements and the Governing Council's outlook for the future. Meanwhile, a busy US economic calendar will provide further direction, culminating in the upcoming Nonfarm Payrolls report. Key releases include the April JOLTS Jobs Openings report, the May ADP survey on private job creation, Challenger Job Cuts, and weekly unemployment figures. These data points will shape market expectations ahead of the Fed meeting on June 12.
EURUSD Forecast Technical Perspective
In the weekly chart, the last candle finished as a doji, reflecting indecision after rallying from the yearly low by posting several consecutive positive weeks. The next candle might be another green one, as candlestick patterns still support a trend continuation.
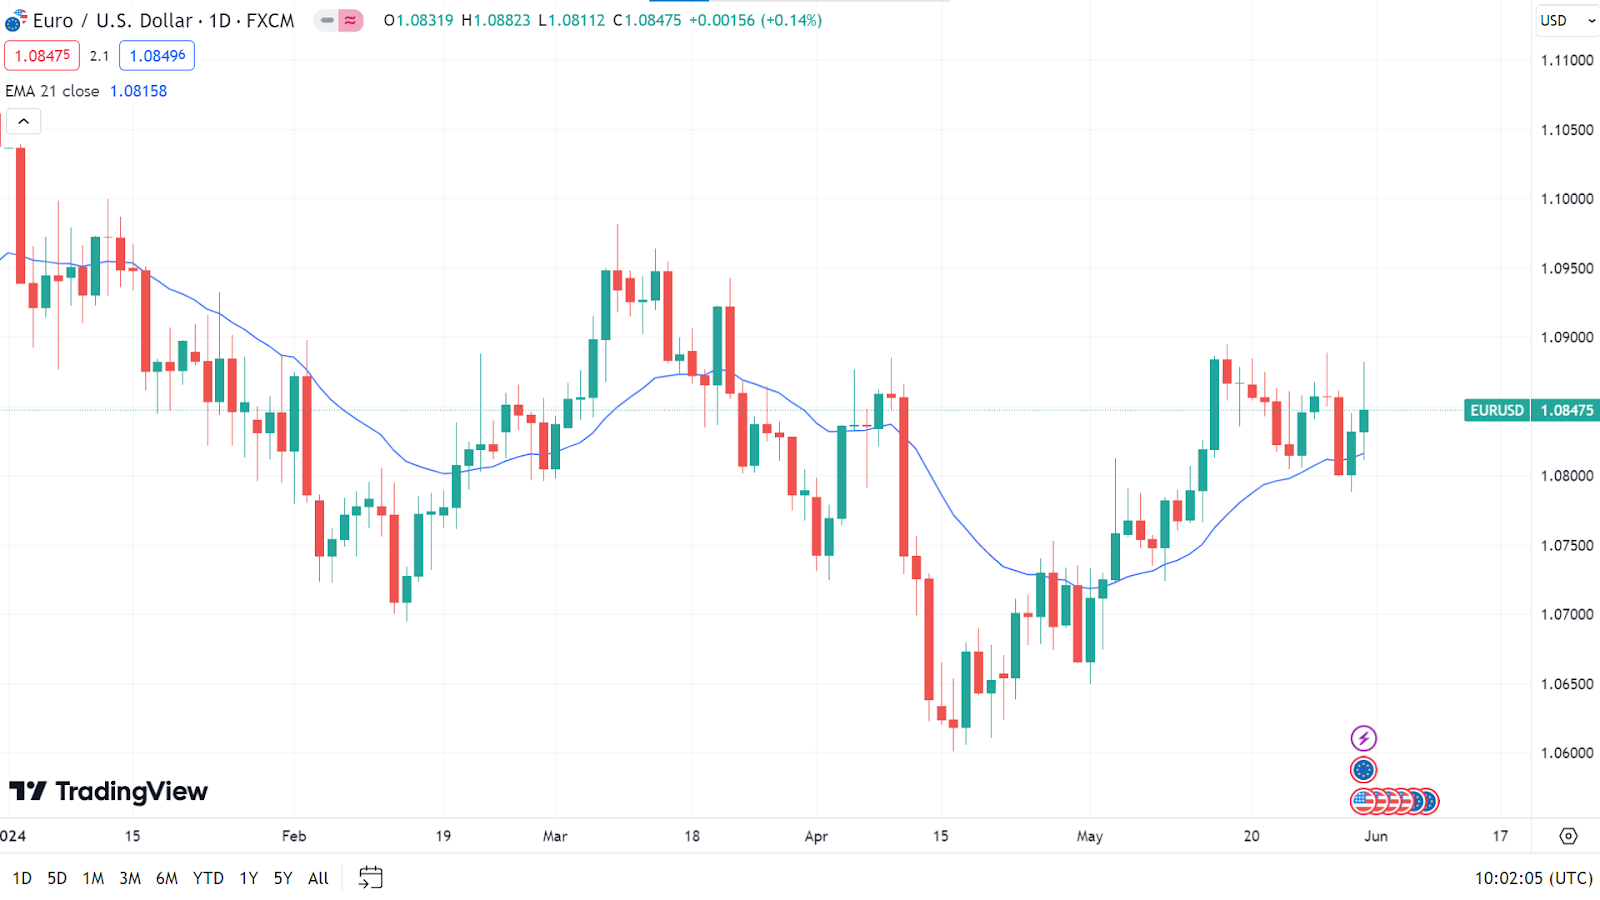
The daily chart's price remains above the EMA 21 line, indicating positive pressure toward the nearest resistance of 1.0894, followed by the next resistance of 1.0981.
Meanwhile, any price drop below the EMA 21 line can trigger the price to decline at the primary support of 1.0788 before reaching the 1.0674 support line.
GBPJPY
Fundamental Perspective
The Bank of England, known for its effectiveness, acts as the government's bank and lender of last resort, issuing currency and overseeing monetary policy, including interest rates. Meanwhile, the Bank of Japan (BoJ) sets the country's interest rates at very low rates for years. It also introduced a negative rate in January 2016 to combat deflation and boost consumer prices, which have declined for two decades.
Prime Minister Rishi Sunak leads the UK government, while Prime Minister Fumio Kishida, who took office in October 2021 after Yoshihide Suga, heads Japan. Both leaders are pivotal in shaping their countries' economic strategies and responding to global economic issues.
The UK GDP, representing the total market value of all final goods and services produced domestically, is a crucial indicator of economic activity. It reflects the growth or contraction pace of the UK's economy. Generally, a high GDP reading or a figure that exceeds expectations is seen as positive for the British pound (GBP), while a low reading is viewed negatively.
GBPJPY Forecast Technical Perspective
The last weekly candle ended with a small green body, posting four consecutive gaining weeks, leaving optimism that the next candle might be another green one.
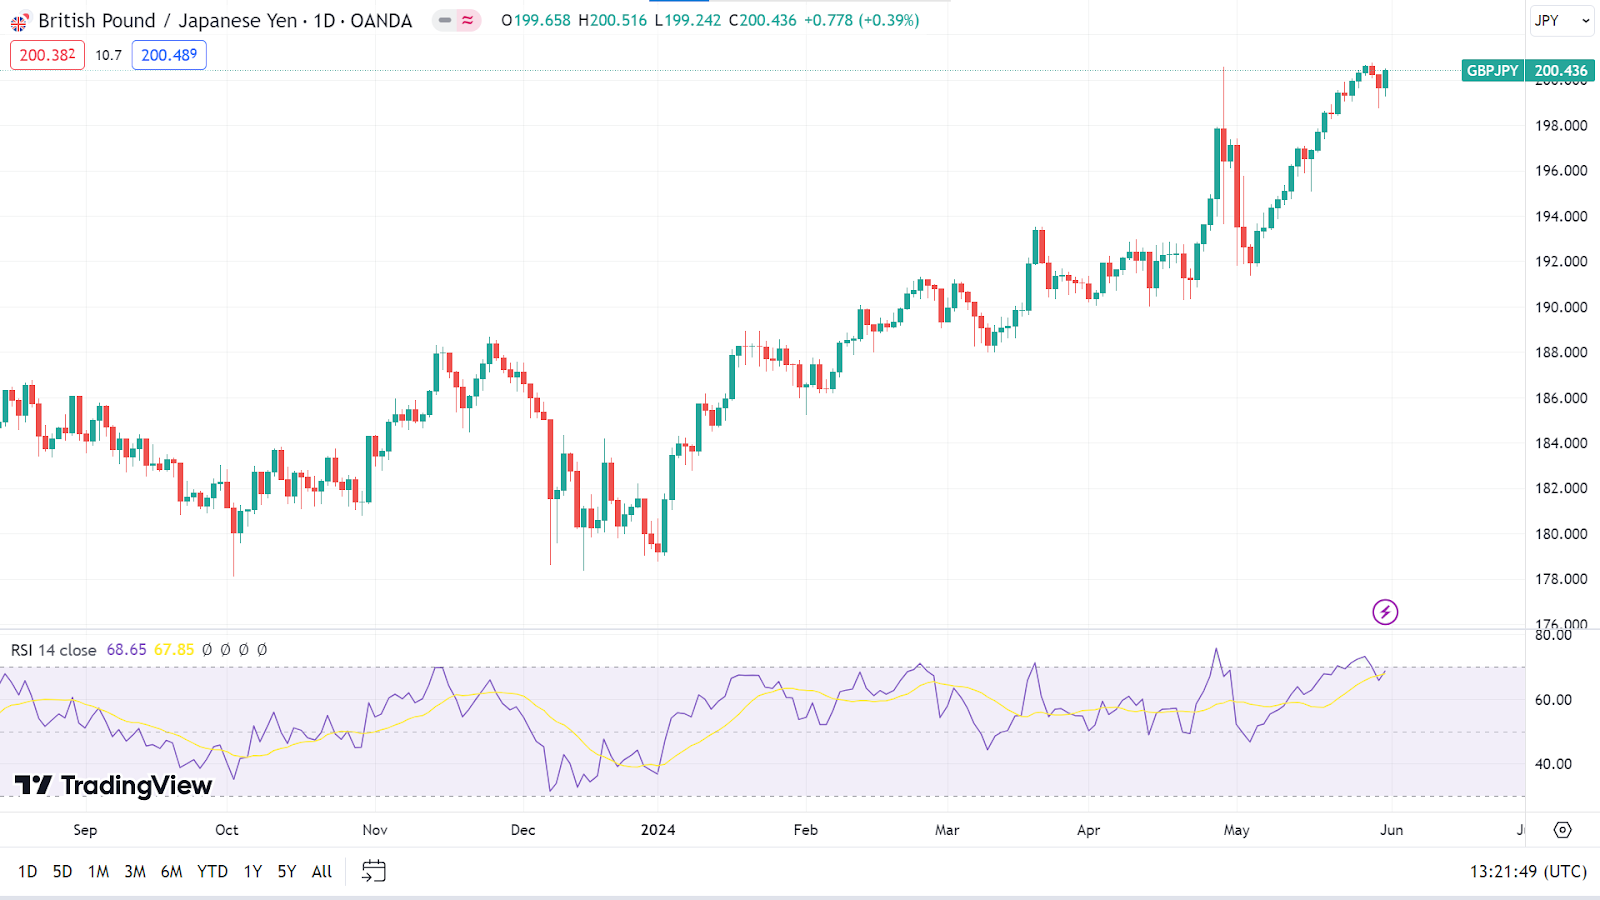
On the daily chart, the price is moving in a solid bullish trend, floating below the overbought level as the RSI indicator reading suggests. This indicates that the price may be seeking to reach the nearest resistance level, near 202.371, followed by the next resistance level, near 206.39.
Meanwhile, if the RSI indicator starts to slope down from this level, the price can retouch the nearest support of 198.75. Whereas the next possible support is near 196.00.
NASDAQ 100 (NAS100)
Fundamental Perspective
Wall Street's main indexes rose on Friday after data showed that inflation in the U.S. rose largely in line with expectations. Futures reversed early losses following a Commerce Department report indicating that the Personal Consumption Expenditure index, the Fed's preferred inflation gauge, increased by 0.3% in April. Annually, it stood at 2.7%, also meeting expectations, while the core PCE rose by 0.2% monthly, slightly below the expected 0.3%.
Rate-sensitive mega cap stocks such as Microsoft, Apple, and Nvidia gained as U.S. bond yields slipped post-data. According to the CME FedWatch tool, expectations for a September rate cut rose to over 50%, up from 48.7% before the data.
Despite a recent rally, Wall Street pulled back this week, with the Nasdaq on track for its first weekly losses in six weeks. A spike in Treasury yields, triggered by a weak debt auction and persistent inflation concerns, has pressured riskier assets.
As per the earnings calendar, key economic releases to look at are- GitLab Inc. (GTLB), CrowdStrike Holdings, Inc. (CRWD), lululemon athletica inc. (LULU), and Autodesk, Inc. (ADSK).
Technical Perspective
The last weekly candle was finished as a hammer candlestick with a red body and lower wick. After several consecutive weeks of gaining, a pause was declared in the current trend through the last candle, indicating the possibility that the upcoming candle could be another green one.
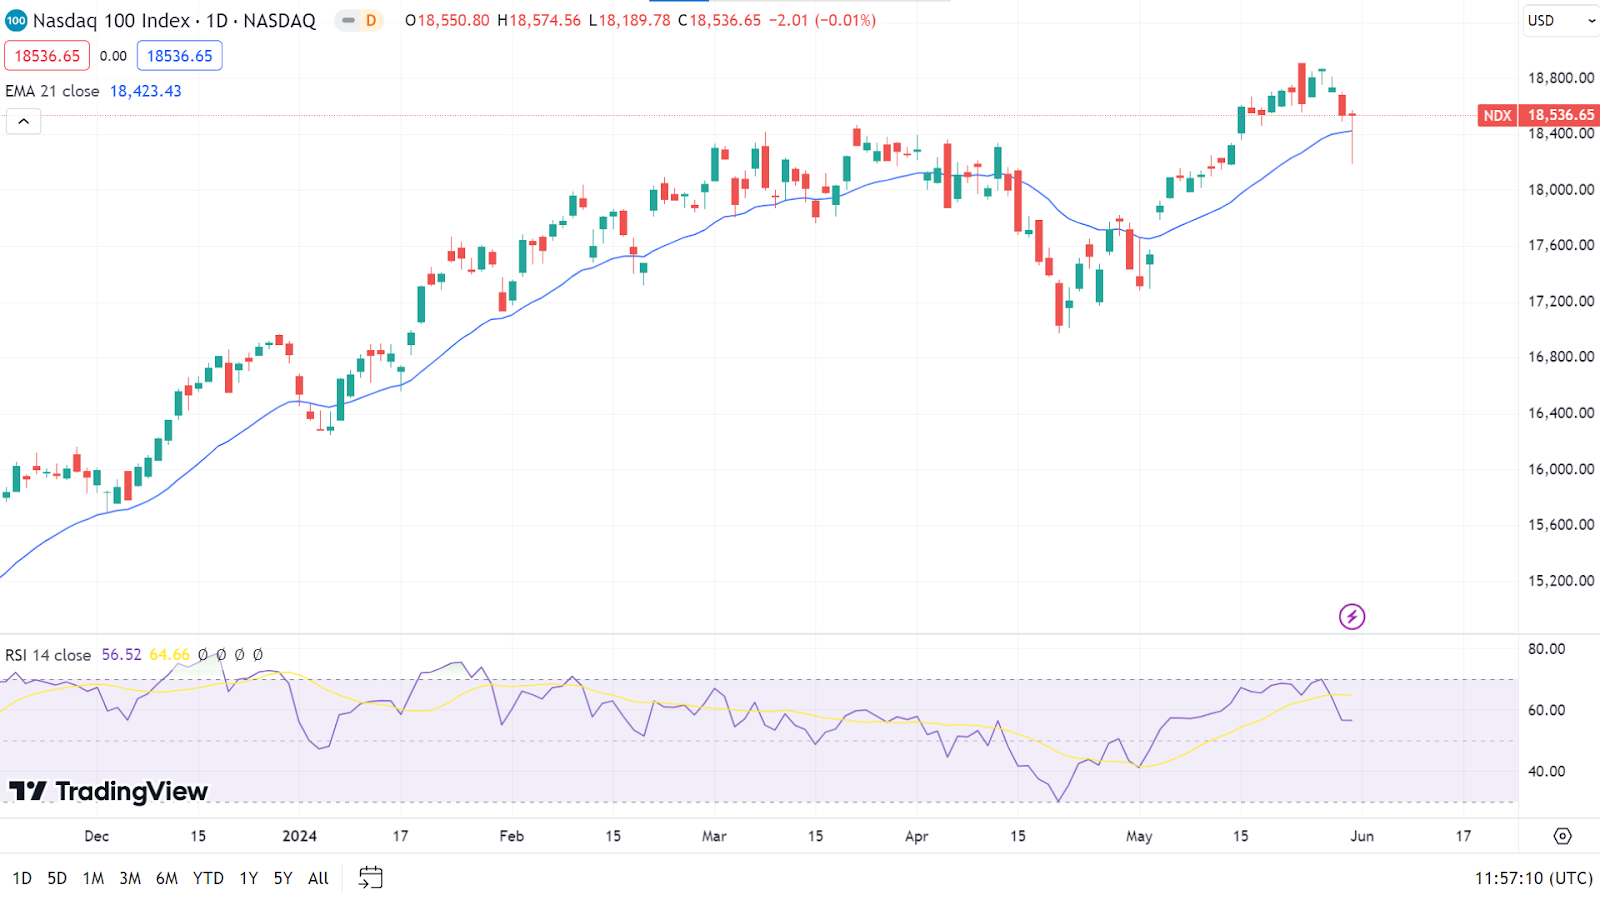
The price touched the EMA 21 line and bounced back when the RSI indicator reading was still floating in neutral territory, declaring positive pressure on the asset price. So, the price can regain its peak of 18,907.54 and beyond in the coming days.
However, if the price comes back below the EMA 21 line and the RSI signal line continues to slope downward, it can decline to the primary support of 17,775.80, followed by the next support level near 17,020.29.
S&P 500 (SPX500)
Fundamental Perspective
As measured by the S&P 500 index (SPX), the U.S. stock market has traded within a narrow range over the past ten days. The range peaks at all-time highs, with the closing high at 5,325 and the intraday high at 5,340, achieved about a week ago on different days. The range bottom is near 5,260, a previous high from last March that has recently acted as support. A clear breakout in either direction is expected to have significant follow-through.
Equity-only put-call ratios continue to decline, maintaining buy signals and indicating a bullish trend. The Cboe Volatility Index (VIX) has remained low while the S&P 500 remains range-bound. However, a downside breakout could change this, particularly if the VIX closes above its 200-day moving average.
Technical Perspective
The last weekly candle closed as a hammer with a red body and wick on the downside after a doji candle, suggesting buyers are still at the play.
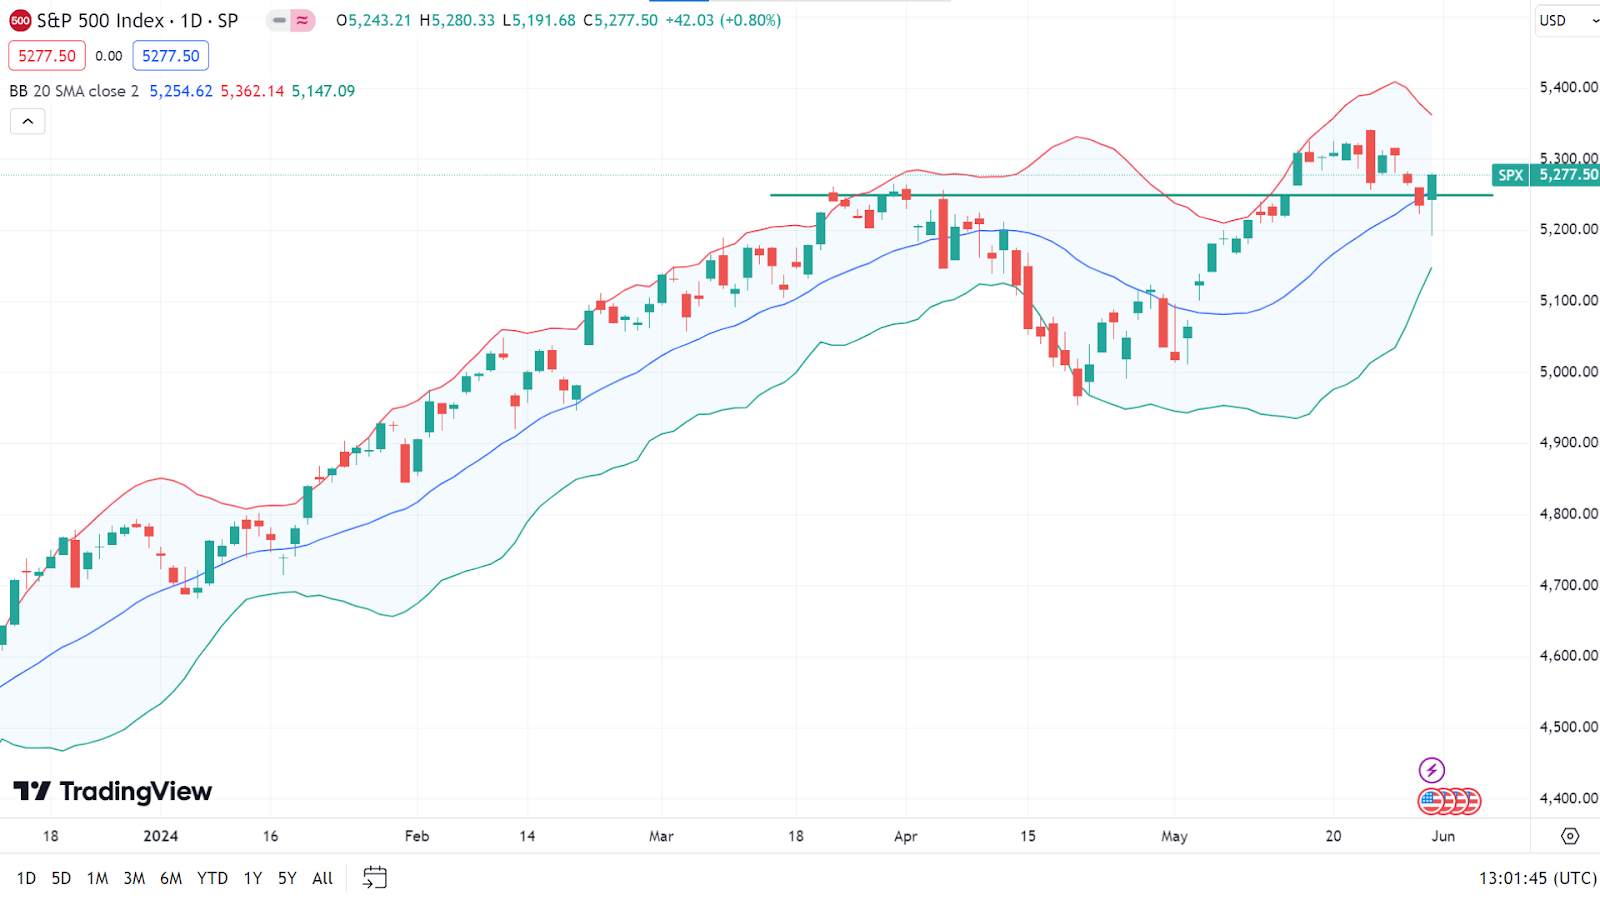
Applying the Bollinger Bands indicator at the daily chart, the price remains above the middle band, breaking above the previous resistance of $5250.00, declaring positive pressure. Therefore, the price might reach the ATH of $5341.88 and beyond that level in the upcoming days. The next possible resistance is near $5705.18.
Meanwhile, if the price retraces below the support of $5250.00, it can drop to the nearest support of $5143.69, followed by the next possible support of $5013.45.
Bitcoin (BTCUSD)
Fundamental Perspective
Bitcoin (BTCUSDT), the premier cryptocurrency, is witnessing a substantial inflow of capital from whale wallets, with around $1 billion worth of BTC added daily. This revelation, shared by Ki Young Ju, CEO of CryptoQuant, suggests that these significant accumulations likely signify custody by these entities.
Ju has drawn parallels between Bitcoin's present behavior and market activity in mid-2020, preceding the remarkable bull run in 2021. Bitcoin's price remained relatively stable during this period, while on-chain activity, notably over-the-counter (OTC) transactions involving institutional players, was notably elevated.
Despite Bitcoin's price showing limited movement in recent months, the realized cap for new whales, reflecting the total value at which large investors acquire Bitcoin, has shown significant growth.
This trend, reminiscent of Bitcoin's on-chain activity in 2020, may signal a potential repeat of the subsequent bull run that led to record highs in 2021. Analysts believe Bitcoin is approaching its final resistance point at $69,000 before potentially charting new territory. Additionally, recent reports suggest that Bitcoin's price could surge to $156,000 by May 2025, based on historical price action following its halving events.
Bitcoin Price Prediction Technical Perspective
The weekly candle, which finished with a small red body, reveals that bulls may lose power and reflects a slight pause in the current trend. If buyers keep pushing the price, the next candle can be another green one.
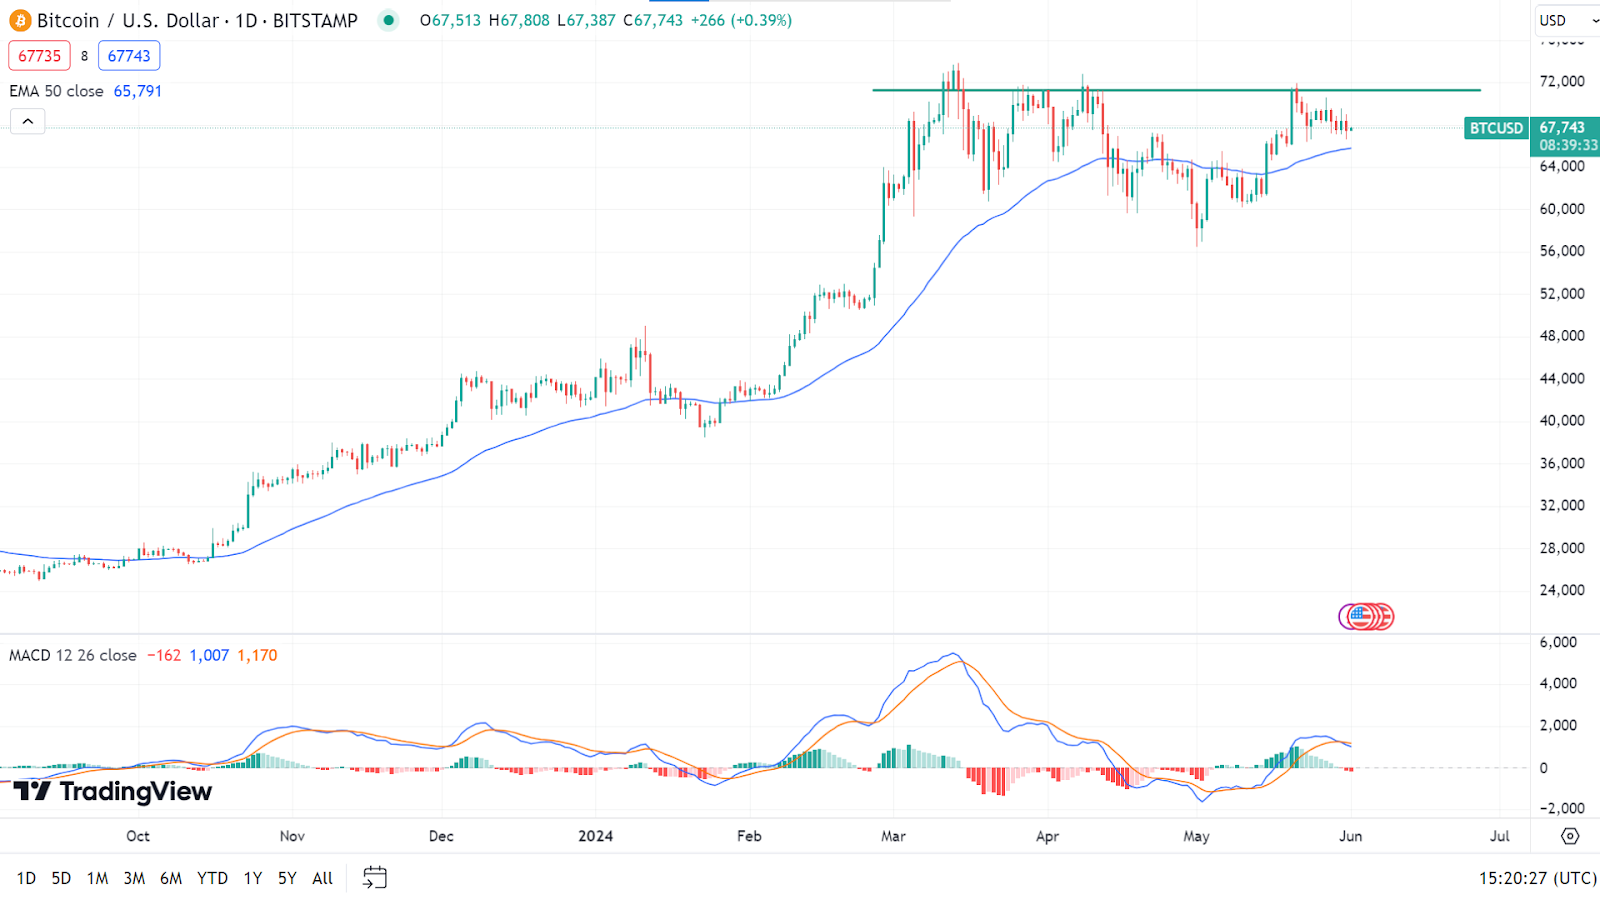
The price keeps hovering above the EMA 50 line on the daily chart, declaring an active bullish force, whereas the MACD indicator reading signals fresh bearish pressure. If the price remains above the EMA 50 line, it can regain the nearest resistance of $71275. Any breakout above can trigger the next resistance of $73,794, making a new ATH.
On the other hand, following the MACD indicator reading, if the price declines below the EMA 50 line, it can be an initiation to a decline to the nearest support of $60,768 or further beyond toward the next support near $56950.
Ethereum (ETHUSD)
Fundamental Perspective
Franklin Templeton, an American multinational investment firm, has filed an amended S-1 application for its proposed spot Ether (ETHUSD) exchange-traded fund (ETF), becoming the first applicant to disclose investor fees. According to the filing with the United States Securities and Exchange Commission (SEC) on May 31, Franklin Templeton stated that the sponsor fees would accrue daily at an annualized rate of 0.19% of the fund's net asset value.
Bloomberg ETF analyst Eric Balchunas highlighted this move as "the opening shot in the ETH ETF fee war," noting on X that the fee structure appears permanent, aligning with Franklin's spot Bitcoin ETF product. Sponsor fees, which compensate the fund manager for administrative expenses, are crucial as investors typically favor ETFs with lower fees.
Despite VanEck, Invesco, and Galaxy submitting amended S-1 applications on the same day, they still need to disclose sponsor fees, leaving other Ether ETF applicants yet to reveal their fee structures. S-1 applications, required by the SEC, provide comprehensive details about the company and the securities it intends to offer.
Balchunas noted that the "fee war is on hold for now" due to the absence of fee disclosures in the latest S-1 filings. Before the launch of spot Bitcoin ETFs in January, issuers frequently adjusted fees in their S-1 filings, sometimes waiving fees to enhance competitiveness. For example, Bitwise waived all fees on its spot Bitcoin ETF for the first six months of trading and the first $1 billion in assets.
Ethereum Price Prediction Technical Perspective
After a solid green candle, the last weekly candle closed as a doji, reflecting a pause in rapid buying and suggesting that the next candle could be another green one.
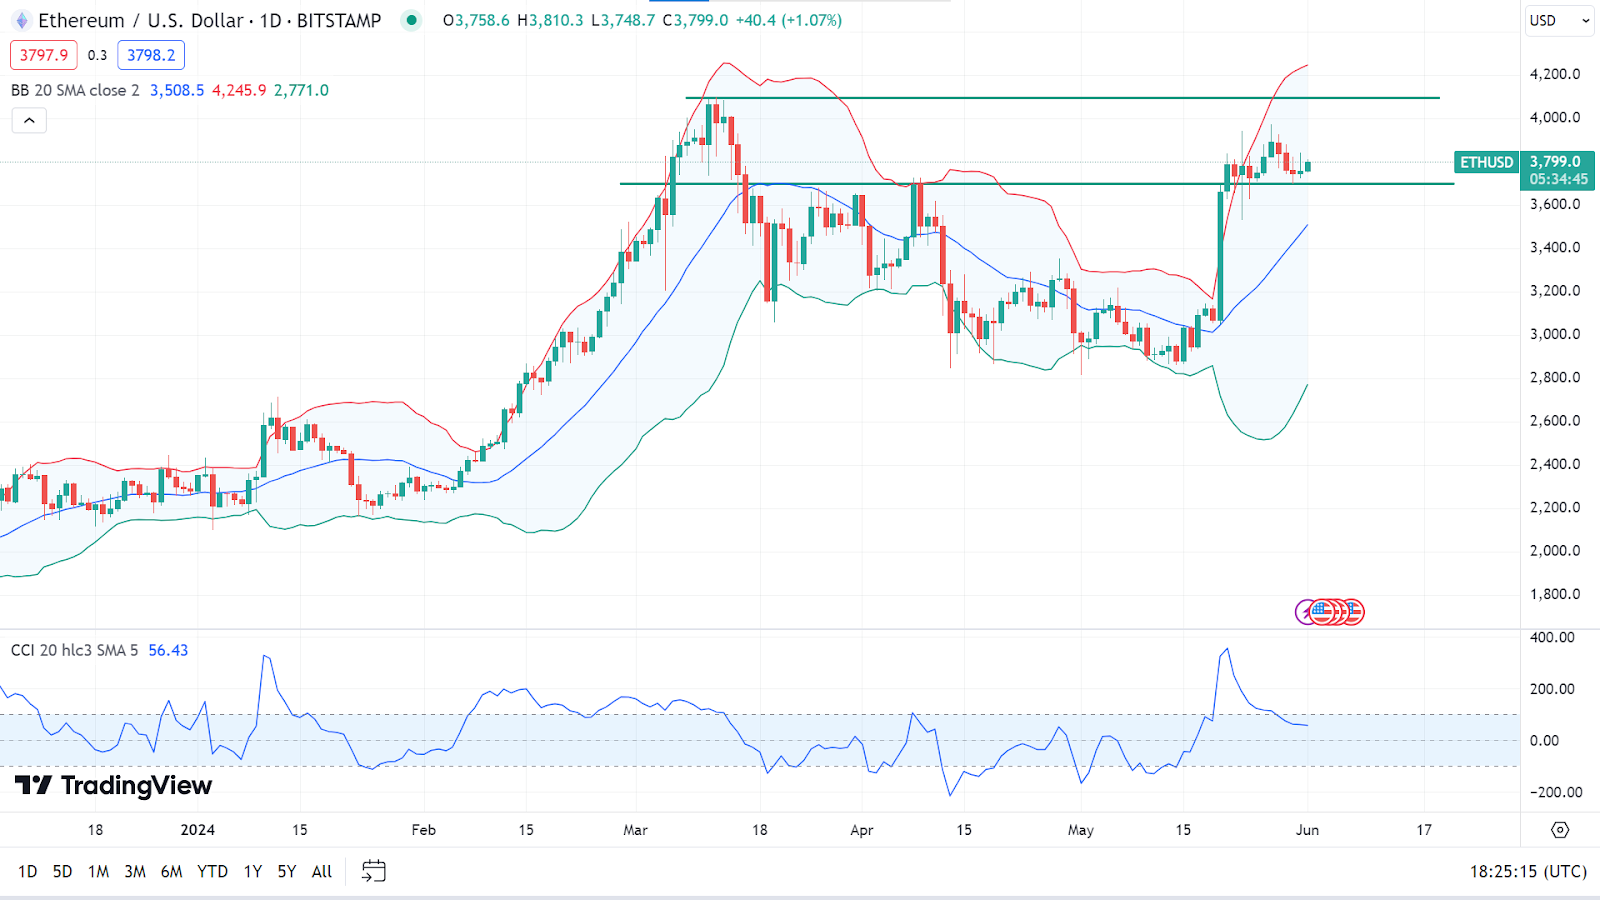
The price remains above the effective former resistance of $3701.7 on the daily chart and the upper channel of the Bollinger Bands indicator, declaring bullish pressure on the asset price when the CCI indicator reading remains neutral. So, as long as the price remains above that $3701.7 level and on the upper channel of the Bollinger bands indicator, it can regain the nearest resistance of $4095.0, and any breakout above can trigger the price to reach $4380.6.
In the meantime, if the price slides below the $3701.7 level, it can drop to the nearest support of $3503.3, followed by the next support near $3122.2.
Gold (XAUUSD)
Fundamental Perspective
From a fundamental perspective, XAU/USD is experiencing a dynamic period in the U.S. market. The U.S. personal consumption expenditures (PCE) price index for April aligned with market expectations, showing a month-over-month (MoM) increase of 0.3% and a year-over-year (YoY) rise of 2.7%. However, the core PCE price index slightly underperformed, with a MoM change of 0.2% against the forecasted 0.3%, while the YoY figure matched the estimate at 2.8%.
Personal spending fell short of the anticipated 0.3% increase, recording a 0.2% rise, whereas personal income met the MoM forecast of 0.3%. The Chicago Purchasing Managers' Index for May was notably below expectations, registering a reading of 35.4 compared to the forecasted 41.
Earlier in the week, U.S. initial jobless claims for the week ending May 24 slightly exceeded expectations, with a count of 219,000 versus the anticipated 218,000. However, continuing claims for the prior week were better than expected, totalling 1.791 million against a forecast of 1.8 million. Additionally, pending home sales for April significantly underperformed, showing a MoM decline of 7.7%, far below the expected -0.6%.
This series of mixed economic indicators highlights a period of uncertainty and volatility, influencing the trading dynamics of XAUUSD.
Gold Price Prediction Technical Perspective
The last candle on the weekly chart closed as a hammer with a small red body and long upper wick after a solid red candle, declaring seller domination on the asset price. The upcoming candle might be another red one until the current condition switches.
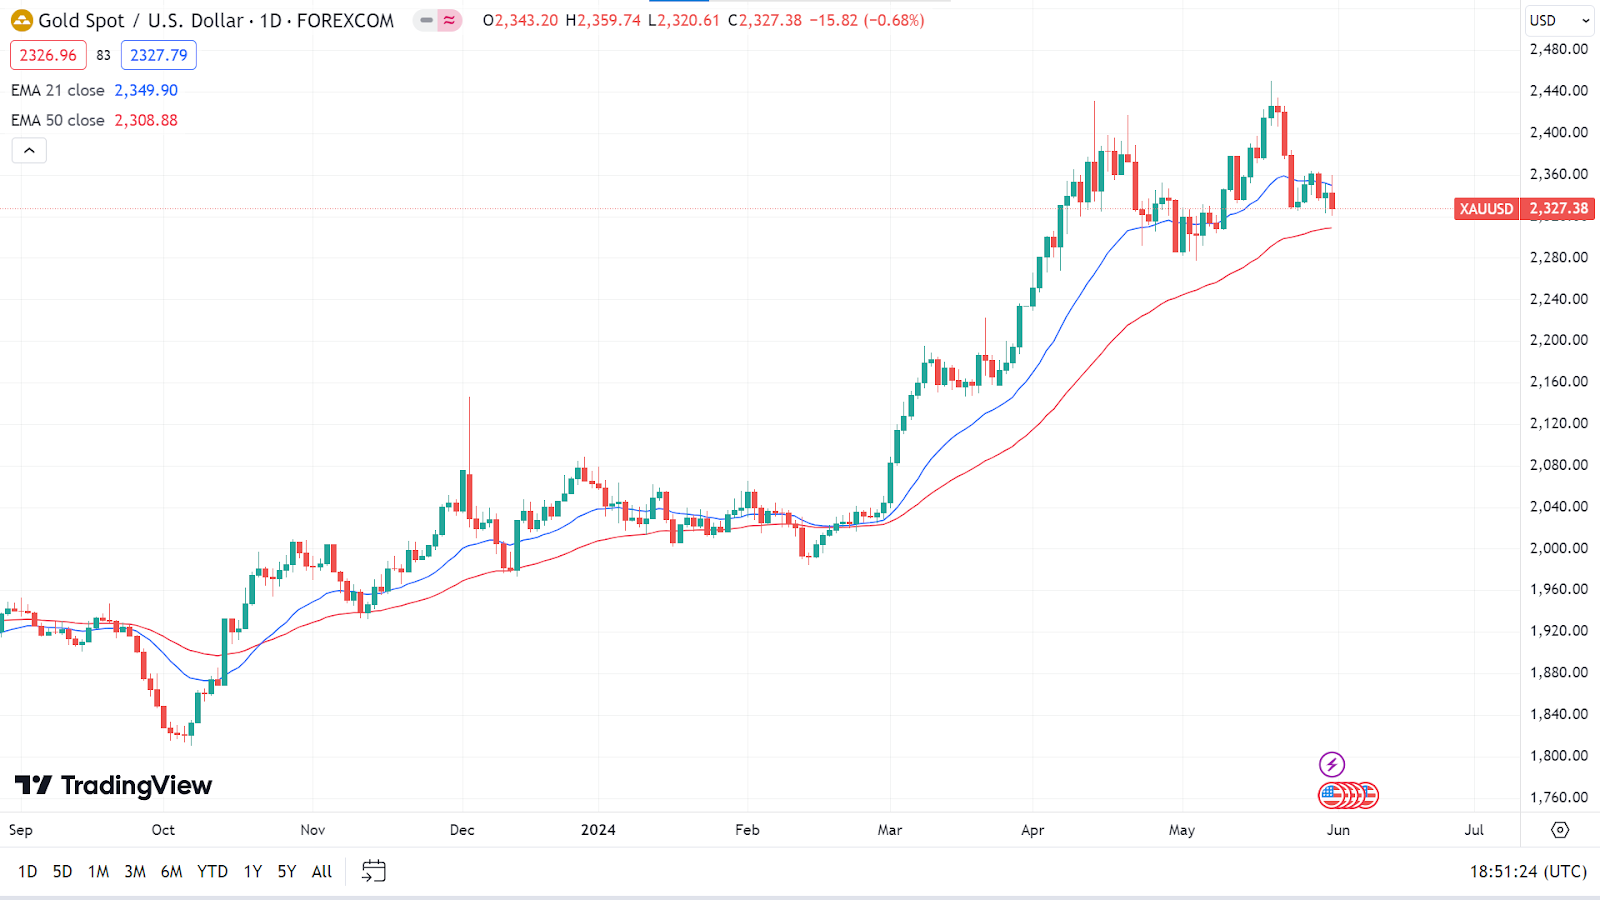
On the daily chart, the price moving below the EMA 21 line confirms the current short-term bearish pressure, whereas it remains above the EMA 50 line, supporting the long-term bullish trend. So, any breakout above the EMA 21 level can trigger the price to reach the nearest support of $2413.11 or beyond to create a new ATH.
Meanwhile, if the price declines below the EMA 50 line, the price might drop toward the primary support of $2285.21, followed by the next support near $2222.90.
Tesla Stock (TSLA)
Fundamental Perspective
A Tesla shareholder has filed a lawsuit accusing CEO Elon Musk of insider trading. The shareholder, Michael Perry, alleges he sold over $7.5 billion of shares in late 2022 before disappointing production and delivery numbers were disclosed. Perry filed the lawsuit in Delaware Chancery Court, claiming Tesla's stock plummeted after the fourth-quarter results were released on January 2, 2023, and that Musk "improperly benefited" by about $3 billion.
Perry contends that Musk breached his fiduciary duties by exploiting his position at Tesla, requesting the court to compel Musk to return the profits from these trades. According to the lawsuit, Musk sold the shares in November and December 2022, and Tesla's directors are also accused of failing in their fiduciary duties by permitting these sales.
The lawsuit alleges Musk, who had previously claimed strong demand for Tesla vehicles, became aware of the lower-than-expected numbers in mid-November through his access to real-time data and sold his shares before this information became public. Following the news of vehicle price discounts and the release of the disappointing numbers in January, Tesla's stock tumbled. This lawsuit adds to Musk's ongoing legal challenges, including opposition to his $56 billion pay package and a regulatory probe into his 2022 stock purchases of Twitter, now renamed X. Musk also has a longstanding feud with the U.S. Securities and Exchange Commission dating back to 2018 over a tweet claiming he had "funding secured" to take Tesla private.
Tesla Stock Forecast Technical Perspective
The last candle on the weekly chart closed with a small green body, declaring buyers are still interested. It also posted three consecutive gaining weeks, signaling that the next candle can be another green one.
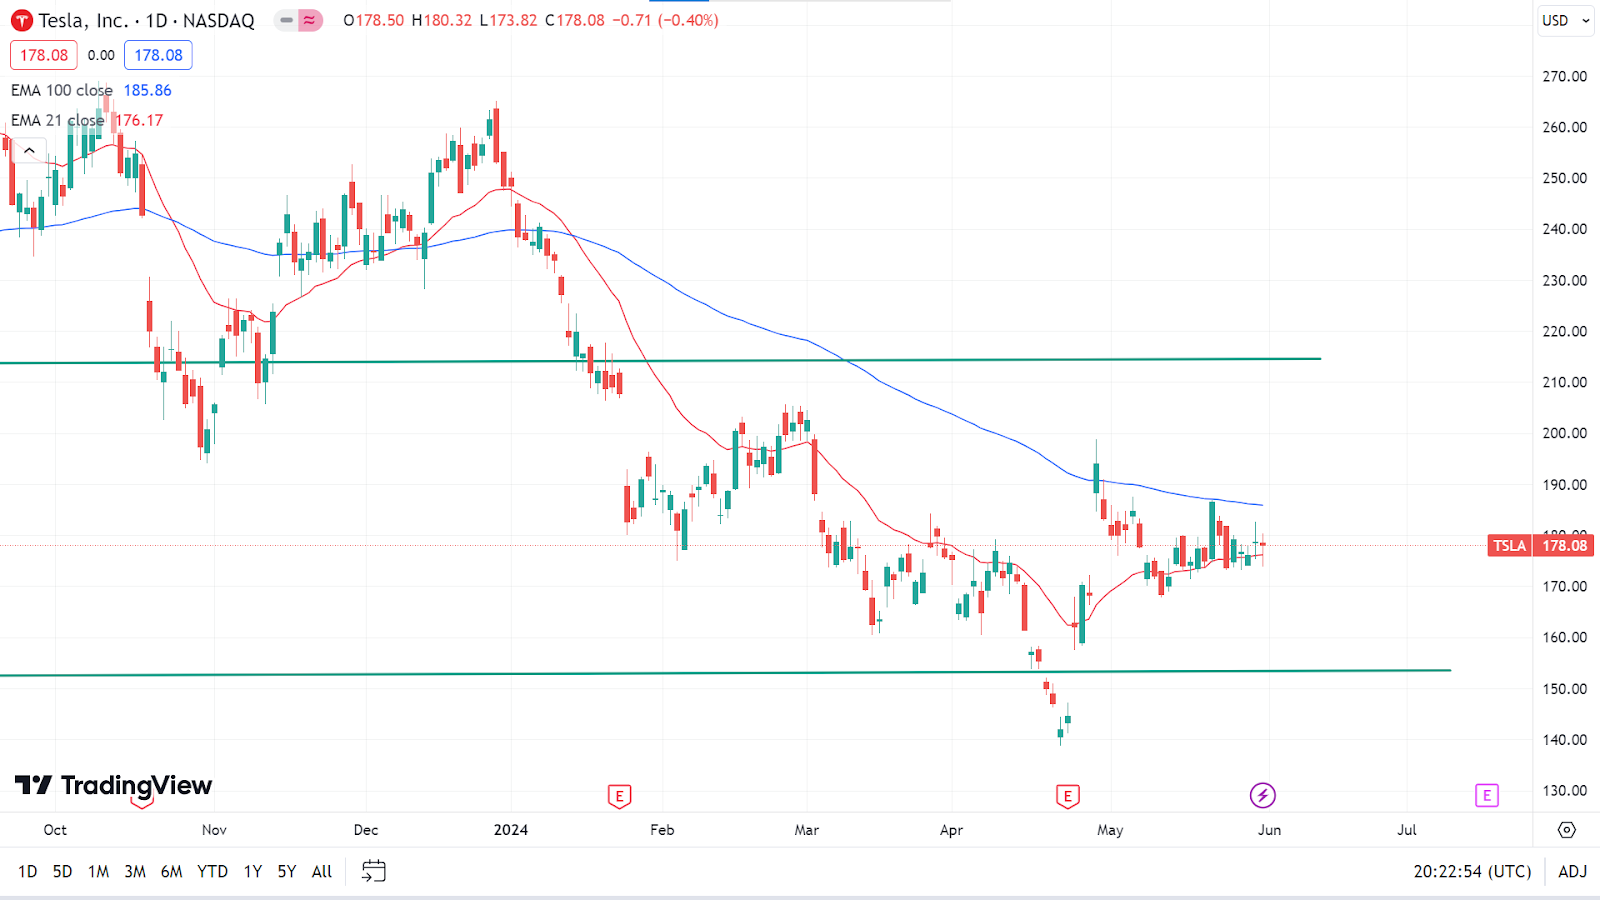
On the daily chart, the price floats between the EMA 21 and EMA 100 lines. Moving above the EMA 21 line declares short-term bullish pressure on the asset price, whereas the EMA 100 line acts as a resistance level. If the price exceeds the EMA 100 line, it can reach the nearest peak of $198.87, followed by the next resistance at $205.28.
Meanwhile, if the price drops below the EMA 21 line, it will open the door to reaching the primary support of $167.75, whereas the next support is near $162.96.
Nvidia Stock (NVDA)
Fundamental Perspective
Despite its recent successes, Nvidia (NASDAQ: NVDA) is now confronting a significant challenge. U.S. officials have delayed issuing licenses required for chipmakers to send large-scale AI accelerators to the Middle East, pending a “national security review of AI development in the region.” This development has negatively impacted NVDA stock and has raised concerns for competitors such as Advanced Micro Devices (NYSE: AMD). The situation creates uncertainty about the future of the chip making industry, especially amid fears of losing market share.
Investors may need to approach NVDA stock with caution as this issue evolves. Let's examine the broader implications for Nvidia and its peers.
There are many reasons to be optimistic about Nvidia's stock. The company recently outperformed Wall Street expectations in its Q1 earnings report, both in revenue and earnings per share (EPS). Additionally, Nvidia is preparing for a 10-for-1 stock split on June 10. These positive factors boosted NVDA stock last week. However, the stock is poised to end today in the red unless there is a quick recovery.
The uncertainty surrounding the Middle East licensing delay is significant, with many questions and few answers. Wall Street's aversion to uncertainty likely contributes to NVDA stock's decline, and detailed information may only emerge for a while. Investors must closely monitor developments to understand the potential long-term impact on Nvidia and the chipmaking sector.
Nvidia Stock Forecast Technical Perspective
On the weekly chart, the last candle closed as a Doji after a solid green candle, reflecting a bit of pause in the current bullish trend and indicating a possibility that the next candle might be another green one.
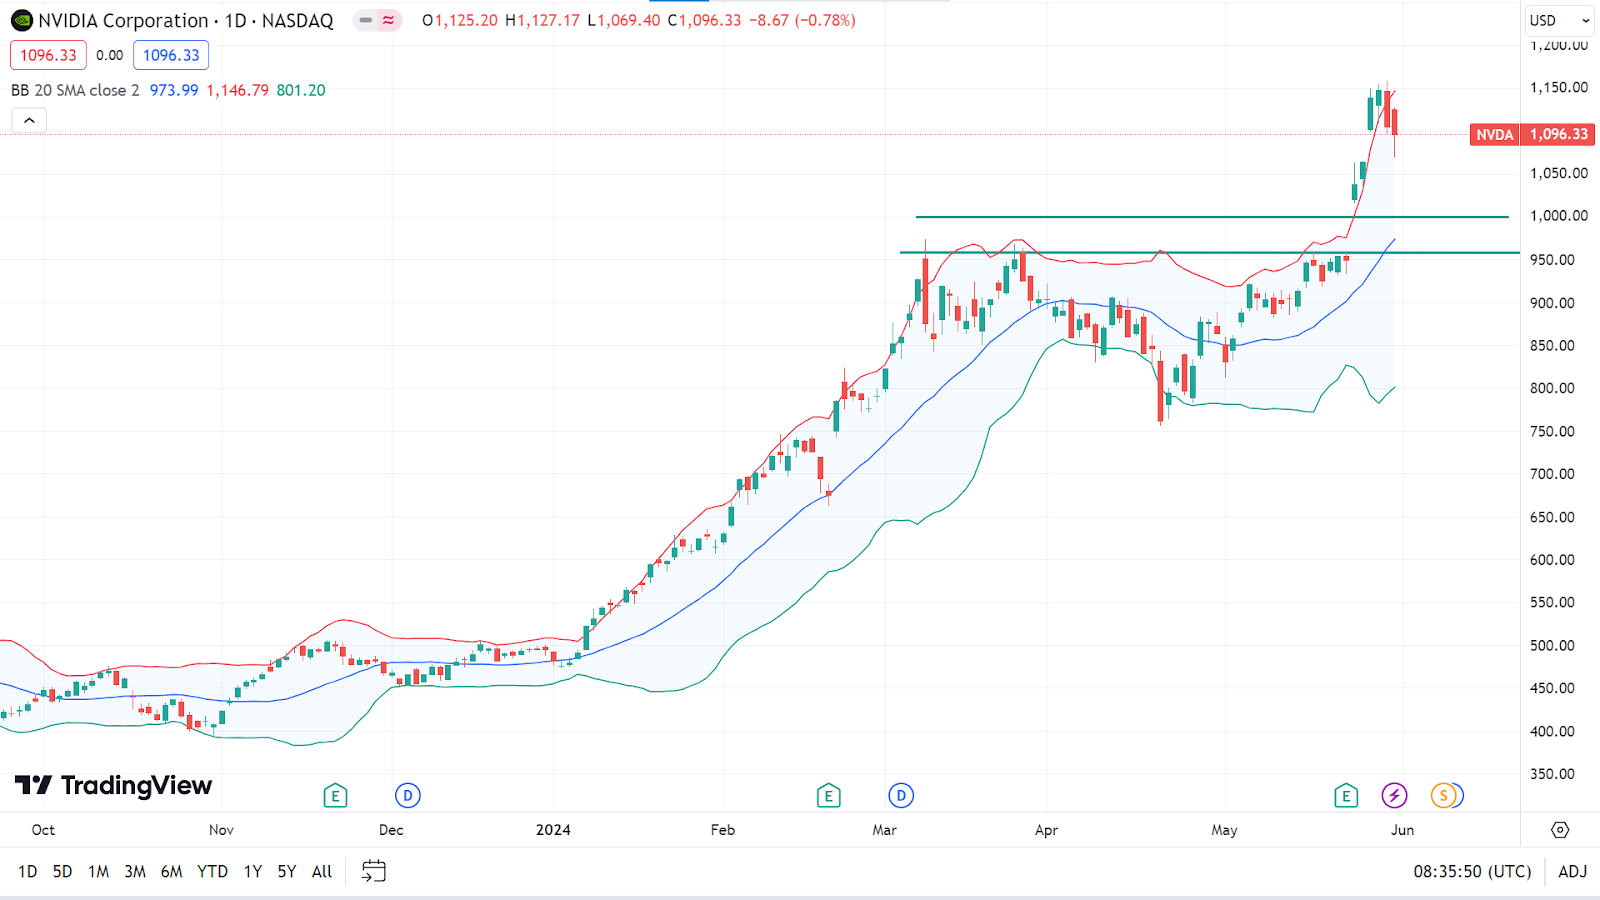
The price is moving closer to the upper band of the Bollinger Bands indicator, reflecting significant bullish pressure. In the coming days, it might regain its peak of $1158.19 or go further.
Meanwhile, the price in the upper band of the Bollinger Bands often suggests overbought, so any pause on the current bullish trend might trigger to reach the nearest support of $1000, followed by the next support near $958.09.
WTI Crude Oil (USOUSD)
Fundamental Perspective
West Texas Intermediate (WTI) US Crude Oil dropped to new weekly lows, falling below $77.00 per barrel. This decline marks the second consecutive month of losses, driven by concerns over global demand overshadowing rising US crude production. Despite sharp week-over-week contractions in US crude supplies reported by the American Petroleum Institute (API) and the Energy Information Administration (EIA), increased refinery inventories have pushed prices lower. An underwhelming lead-up to the Memorial Day driving season and lower heating oil demand due to a warmer winter has left refiners with excess supply.
OPEC+ is set to meet on Sunday to discuss its 2023 output restrictions. Expectations are to extend current production caps through 2025. However, given the continued rise in US crude production, skepticism remains about the effectiveness of these limits.
In the US, April's Personal Consumption Expenditures (PCE) Price Index unexpectedly eased, rising only 0.2% month-over-month versus the forecasted 0.3%, which coupled with a modest 0.2% increase in personal spending—below expectations and down from the previous 0.7%—failed to boost crude oil markets, suggesting a continued weak demand for WTI.
Oil Prices Forecast Technical Perspective
The last candle on the weekly chart closed as a hammer with an upper wick and red body, declaring selling pressure still active on the asset price, indicating the next candle can be another red one.
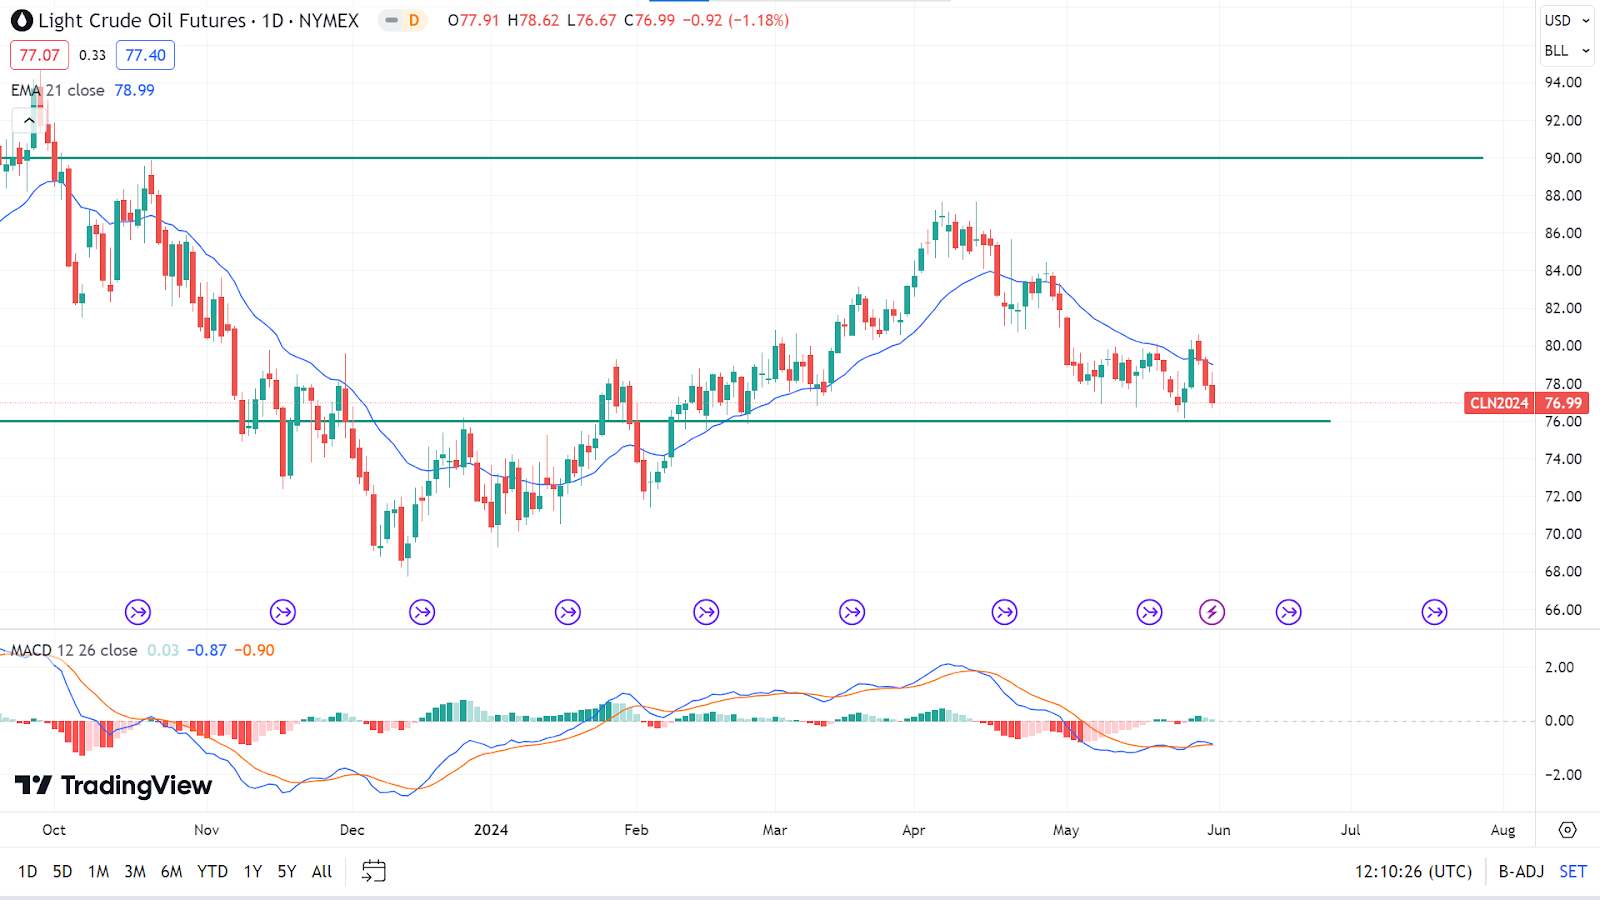
On the daily chart, the price is sliding smoothly below the EMA 21 line, declaring bearish pressure on the asset price. This leaves optimism that the price may head toward historical support of $76.00, and any break below can trigger the price to get to the next support near $72.63.
Meanwhile, if the price exceeds the EMA 21 line on the upside, it may initiate the price to reach the nearest resistance of $82.00, followed by the next resistance near $84.38.


