
EURUSD
Fundamental Perspective
The EURUSD pair has increased steadily for the fourth consecutive week, trading around 1.0860 and recovering about 250 pips from its mid-April low of 1.0600. This increase primarily reflects USD weakness rather than natural Euro strength, as the Eurozone's economic progress remains modest due to tight monetary conditions.
US inflation data revealed the April Consumer Price Index (CPI) meeting expectations, with the annual rate slightly declining to 3.4% from 3.5% in March. Core inflation also decreased to 3.6% from 3.8%, and the monthly CPI rose by 0.3%, down from 0.4%. The April Producer Price Index (PPI) also increased by 0.5% MoM, hinting at potential retail price pressures. Retail sales in April remained flat, missing the anticipated 0.4% increase, suggesting subdued consumer spending.
Meanwhile, the Eurozone confirmed its Q1 GDP growth at 0.3% QoQ, with the April Harmonized Index of Consumer Prices (HICP) aligning with preliminary estimates at a 2.4% YoY increase. Germany's April HICP also stood at 2.4% YoY, and the May ZEW Survey indicated an improvement in economic sentiment. Despite these developments, the Eurozone's economic progress still needs to be improved to drive a significant Euro rally.
In the coming week, market attention will focus on multiple Fed speakers and the release of the FOMC minutes, which may offer more insights into future monetary policy directions. Important reports include the HCOB preliminary estimates of May European PMIs, S&P Global US PMIs, Germany's Q1 GDP revision, and US April Durable Goods Orders.
EURUSD Forecast Technical Perspective
On the weekly chart, EURUSD posted the fifth bullish candle, and the last one ended solid green with small upper wicks, which declares a significant positive force on the asset price.
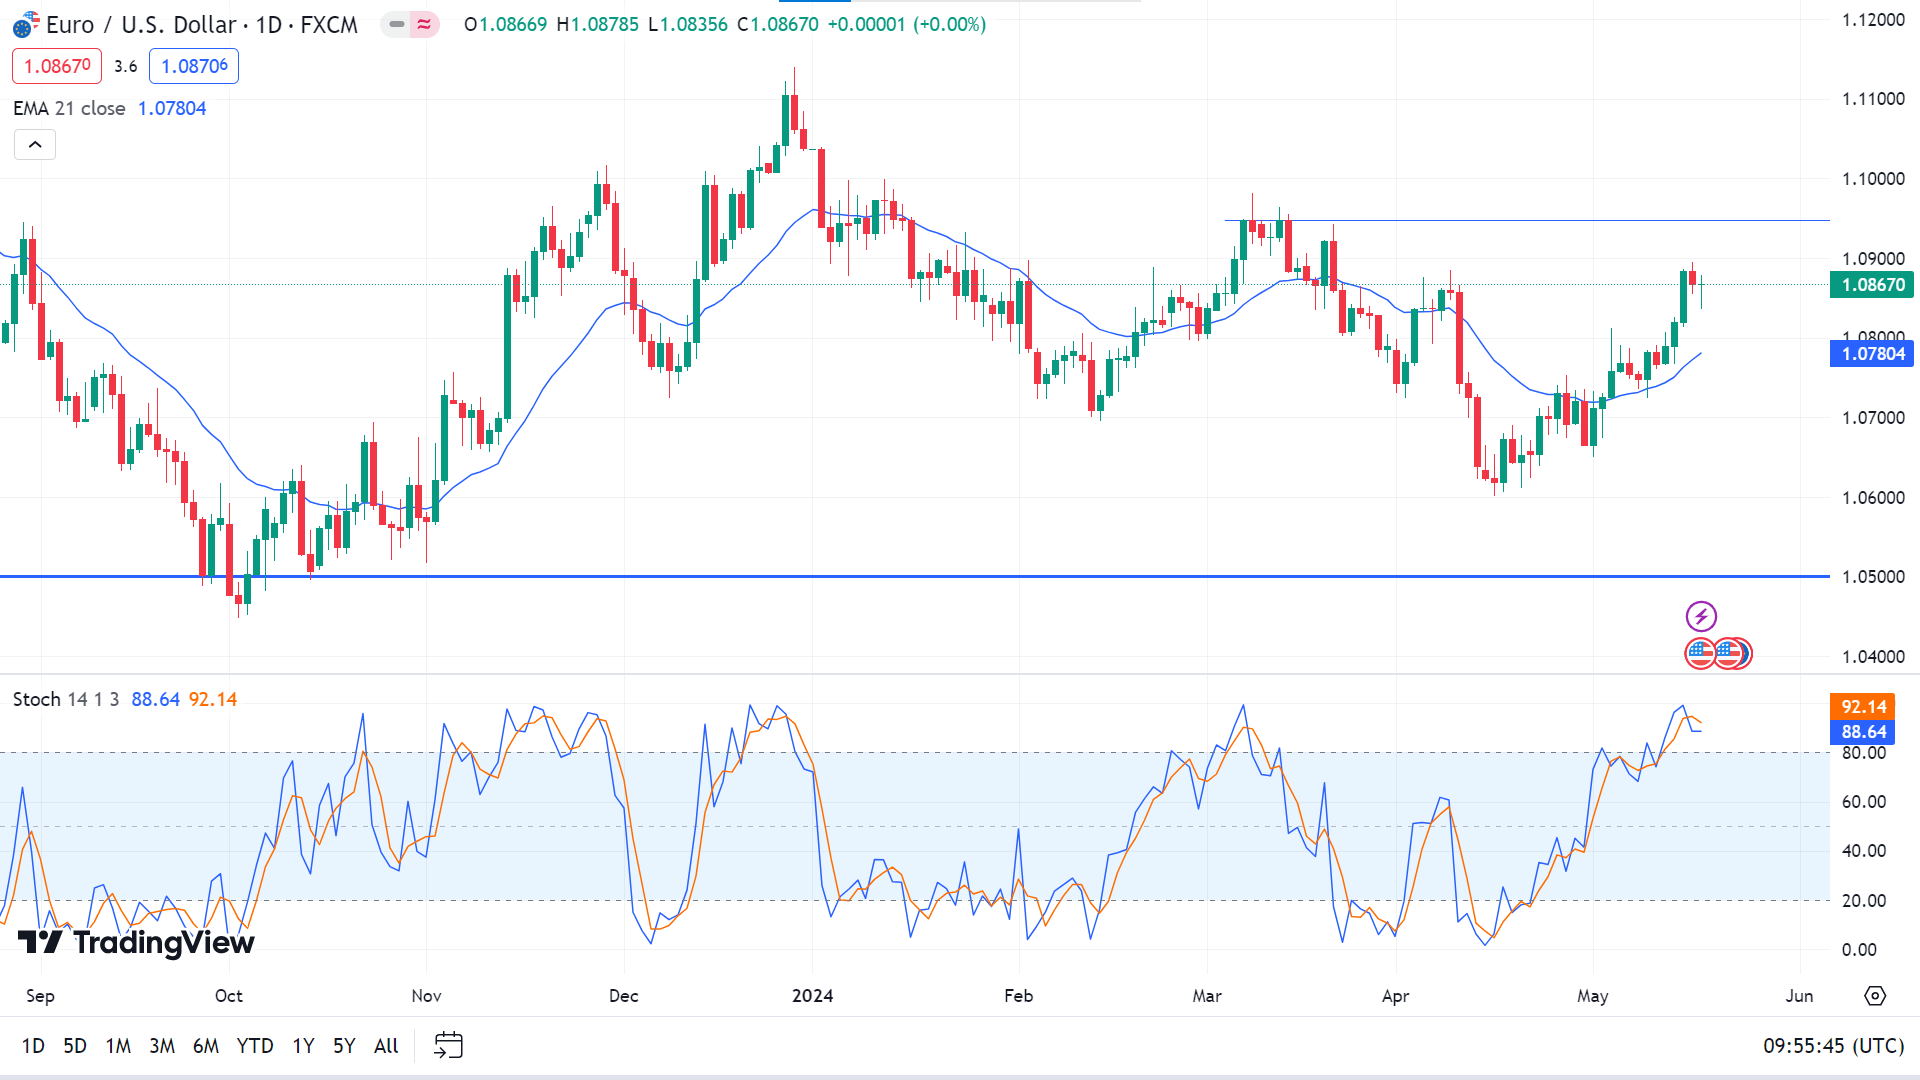
The daily chart's price remains above the EMA 21 line, declaring bullish pressure on the asset price. Meanwhile, the Stochastic signal lines remain in overbought territory. So, the price may head toward the nearest peak of 1.0950, whereas the next resistance is near 1.1105.
Meanwhile, the Stochastic signal lines create a bearish crossover at the overbought level, leaving hope for sellers. If the price retraces below the EMA 21 line and the Stochastic signal lines start sloping downward, it can drop to the primary support of 1.0700 level, followed by the next support near 1.0608.
GBPJPY
Fundamental Perspective
Optimism around the British pound has grown due to mixed results from the UK labor market, shifting focus to the upcoming Consumer Price Index (CPI) inflation figures, set for release on Wednesday. A continued decline in consumer prices could pressure the Bank of England (BoE) to consider reducing its policy rate over the summer, as suggested by recent BoE statements.
BoE Chief Economist Huw Pill indicated that the bank might contemplate lowering interest rates soon despite the historically tight job market. Conversely, BoE official Megan Greene advised caution, suggesting the bank should wait for more apparent evidence of decreasing inflation pressures. Currently, money markets see a 55% chance of a rate cut in June, reinforcing Governor Andrew Bailey's preference for rate reductions in the coming quarters amid improving inflation metrics.
In addition to inflation data, upcoming reports on advanced PMIs for the Manufacturing and Services sectors and UK Retail Sales will influence the pound's near-term movement.
In Japan, weak Q1 GDP data has complicated the Bank of Japan's (BoJ) monetary policy. The Japanese economy contracted by 0.5%, exceeding the expected 0.4% decline, presenting fresh challenges for the BoJ's agenda to tighten policy further.
GBPJPY Forecast Technical Perspective
The last weekly candle closed solid green, posting two consecutive gaining weeks and declaring significant bullish pressure on the asset price. The next candle might be another green one.
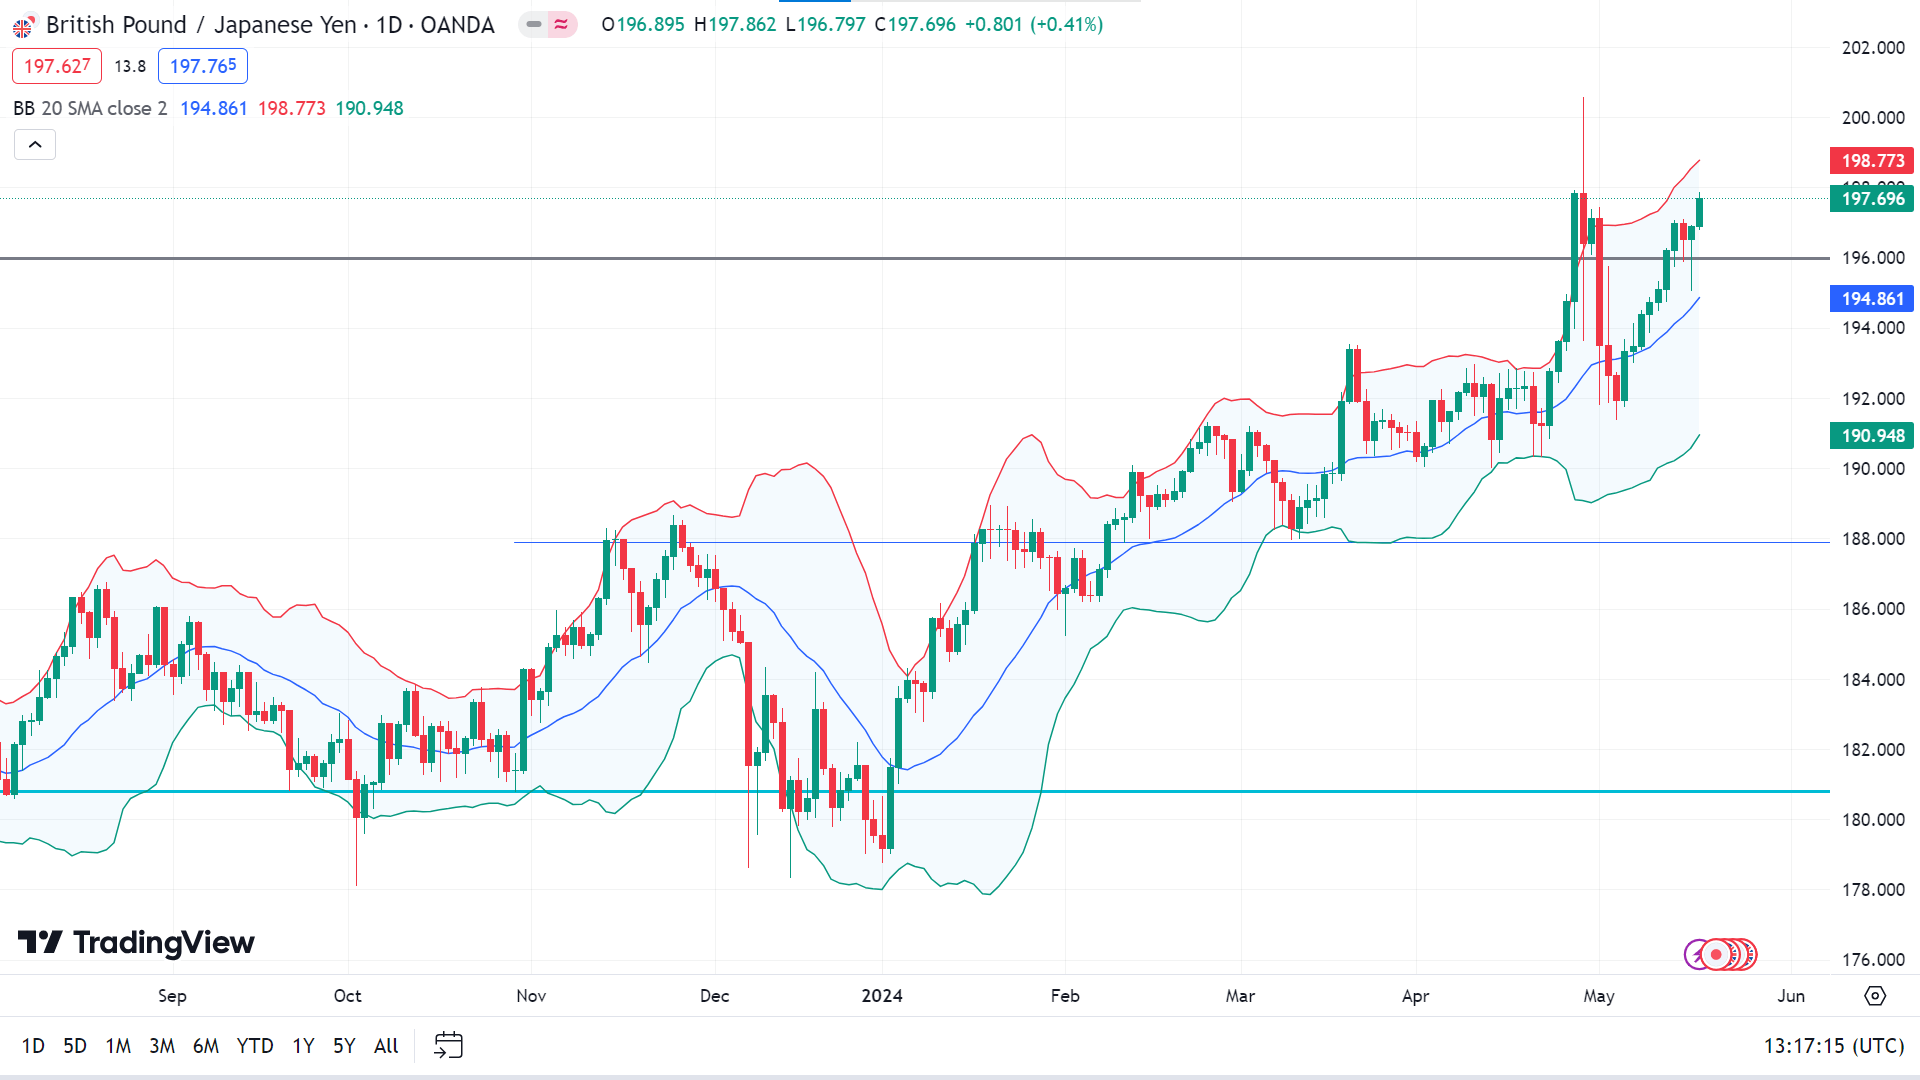
On the daily chart, the price is moving in the upper channel of the Bollinger Bands, indicating a bullish force on the asset price, which leaves hope for buyers. The price may head to the primary resistance of 200.00, and any breakout above can trigger the price to reach the next resistance, which is near 215.31.
Meanwhile, if the price can sustain the previous resistance, it can decline toward the primary support of 196.00. If the price breaks below that level, it can drop to the next support level near 193.50.
Nasdaq 100 (NAS100)
Fundamental Perspective
The Nasdaq 100 rally has paused following mixed US economic data and the anticipation of Federal Reserve remarks. After reaching a record high in the previous session, stocks are paring gains as investors digest jobless claims, home construction data, and the May Philly Fed index.
Jobless claims slightly exceeded expectations at 222K, down from 232K the previous week but above forecasts of 220K, following a significant rise in New York claims. Home construction rebounded, but the Philly Fed index was weaker than anticipated, presenting a mixed economic outlook.
Weaker-than-expected inflation and retail sales data have heightened expectations that the Federal Reserve might cut interest rates this year. However, New York Fed President John Williams tempered these hopes, stating that while inflation pressures are easing, more evidence is needed before considering rate cuts. Jamie Dimon also pointed to persistent economic pressures, suggesting that interest rates might remain high for longer.
Despite sticky inflation and a resilient economy raising doubts about further rate hikes, cooler-than-expected data has led the market to reassess expectations. The CME FedWatch Tool shows a 75% probability of a 25 basis point rate cut by September, with further cuts expected by year-end. Inflation remains well above the Fed's 2% target, indicating a cautious approach to potential rate cuts.
Technical Perspective
The price posted four consecutive losing weeks on the weekly chart, declaring sufficient bullish force on the asset price and signaling optimism that the next candle can be another green one.
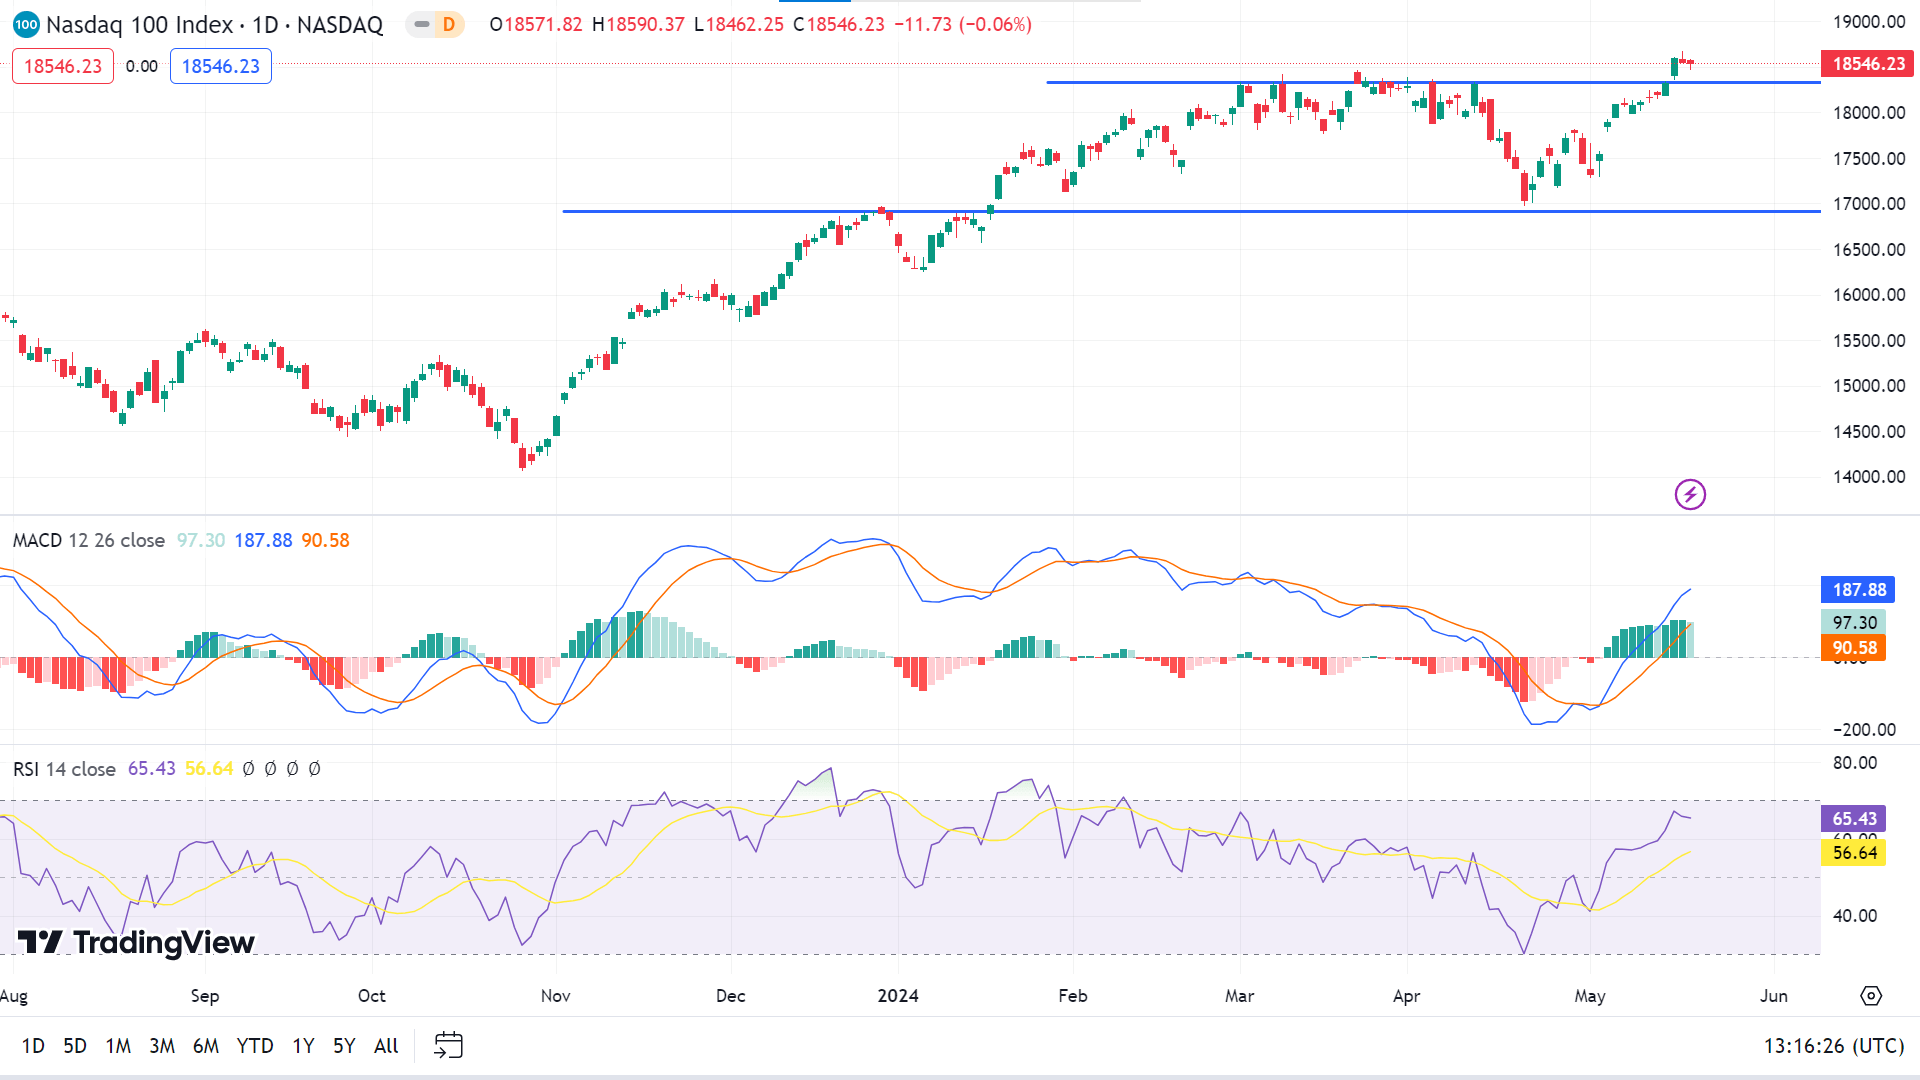
The MACD indicator shows positive strength on the daily chart through green histogram bars and upward-moving signal lines. When it breaks above the primary resistance near 19,000.00, the price may head toward 20,000.00.
Meanwhile, if the price declines below the 18,200.00 level again. In that case, it may reach the primary support of 16,920.00 as the RSI indicator reading remains neutral territory below the overbought level, leaving hope for the sellers.
S&P 500 (SPX500)
Fundamental Perspective
The US stock market has soared to new heights, with the S&P 500 reaching a record 5,325 points and the DJIA touching 40,000 points. This surge is fueled by investor euphoria following the release of unexpectedly low US inflation figures.
Inflation, a key driver of recent market volatility, has shown signs of stabilizing, fostering significant optimism. The April CPI increase was a modest 0.3% month-on-month, hinting at a possible return to a downward trend. Year-on-year, the CPI rose by 3.4% in April, down slightly from 3.5% in March. Since peaking at 9.1% in June 2022, the current deceleration is a welcome sign for investors.
The April inflation report marked the first year-on-year decline since January 2024, with a slower CPI rise, raising market hopes that the Federal Reserve might soon ease monetary conditions.
Technical Perspective
The weekly candle ended solid green, posting four consecutive winning weeks, leaving buyers with hope that the next candle might be another green one.
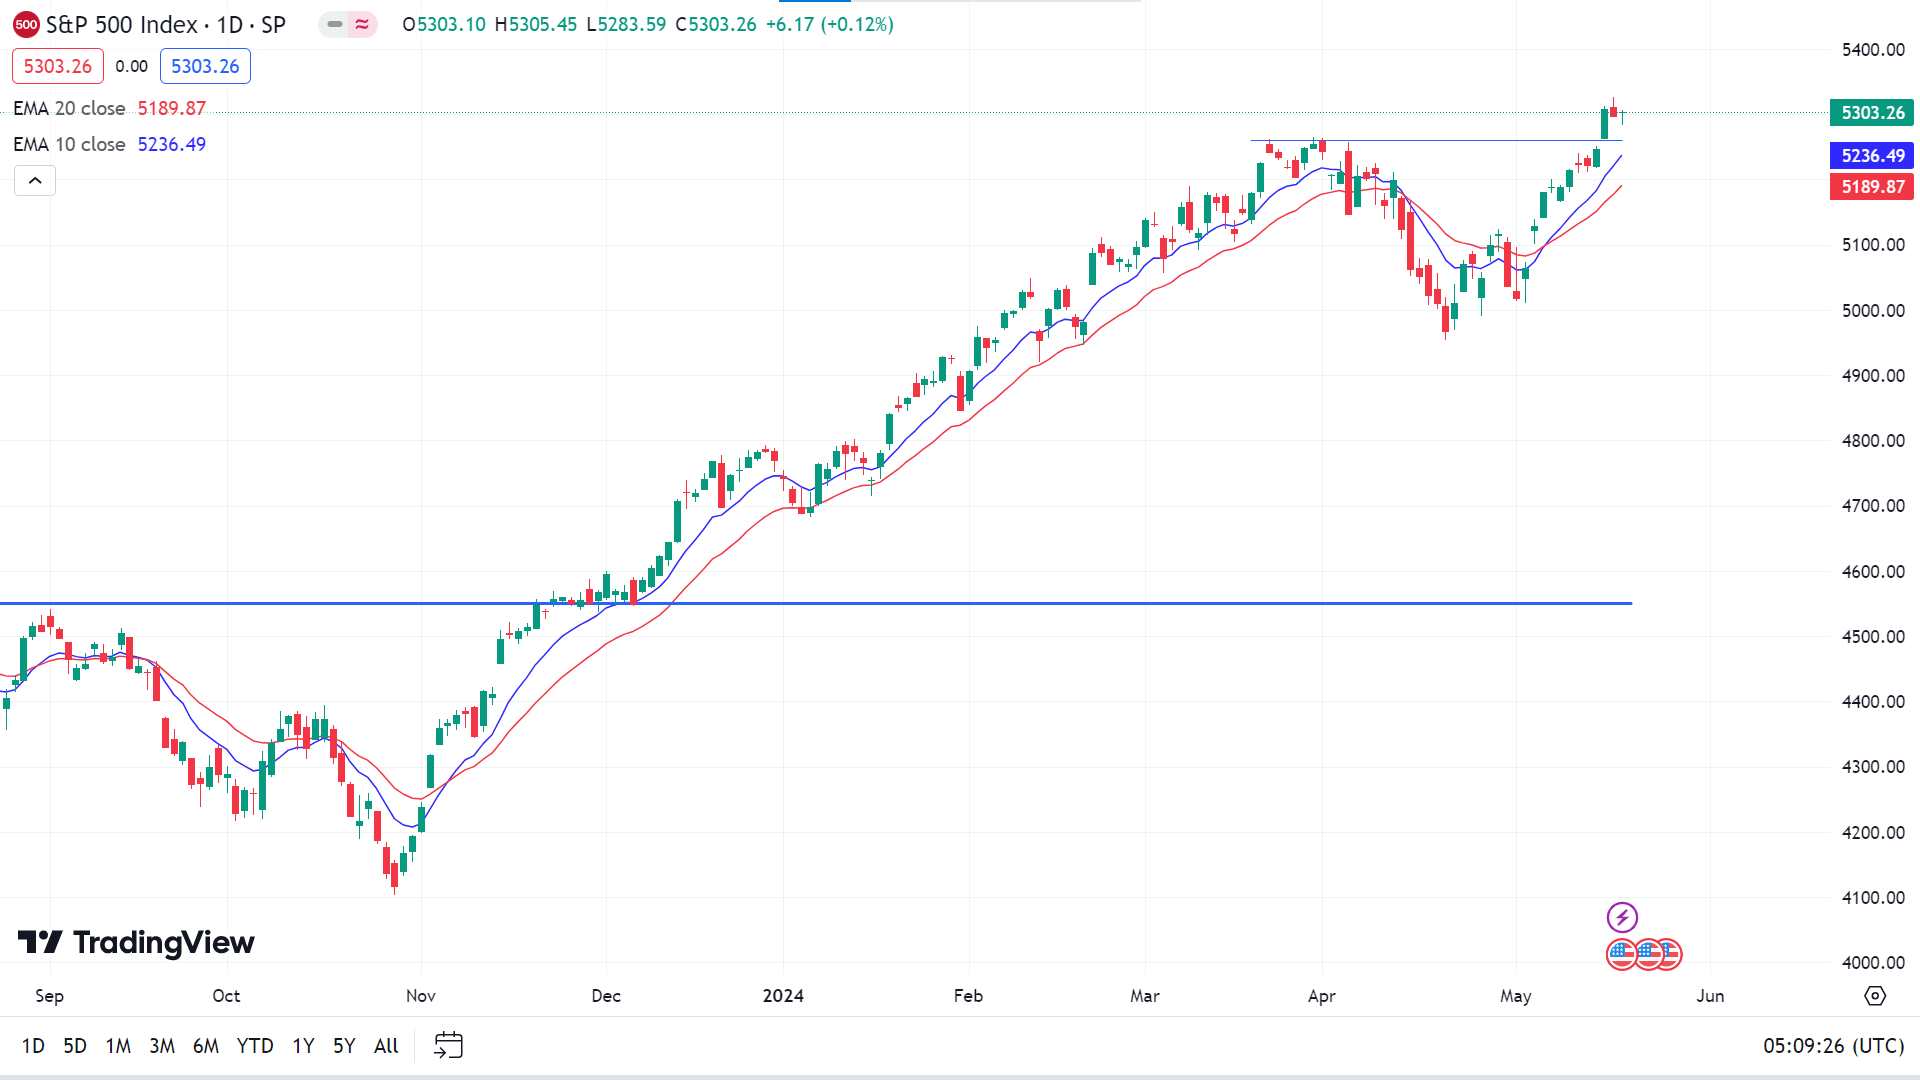
On the daily chart, the price is just floating above a peak of 5263.95, and EMA 10 crosses the EMA 20 line on the upside, declaring buyers' domination on the asset price. It signals that the price may head toward the current resistance near 52386.45, followed by the next resistance near 52448.75.
Meanwhile, if the price exceeds the current support of 5263.95, it can decline toward the current support of 5137.03, followed by the next support near 5093.01. Meanwhile, the EMA 10 line will also reach below the EMA 20 line, and both moving averages will slope downward.
Bitcoin (BTCUSD)
Fundamental Perspective
Gauging Bitcoin's health through on-chain metrics presents a promising picture. Sentiment reports a surge in active addresses on the Bitcoin blockchain, rising from 600K to 710K within four days. Concurrently, the amount of BTC held on exchanges has decreased from 810K to 788K, marking a 2.7% drop in just two days. This shift suggests increasing investor confidence as holders transfer their assets off centralized platforms, indicating a reluctance to sell.
Further bolstering this positive outlook, CryptoQuant’s Realized Price by Address Cohorts metric reveals significant accumulation by new whales—addresses acquiring over 1,000 BTC within six months. These new whales have been purchasing Bitcoin around the $60,000 level and now hold nearly 1.5 million BTC. In contrast, long-term whales, holding over 1,000 BTC for over six months, display a stable realized price of approximately $20,000.
These on-chain metrics suggest a bullish scenario for Bitcoin, bolstered by a cautiously optimistic technical outlook. However, investors face the choice of accumulating at the current price or waiting for a potentially better entry point.
QCP Capital, a Singapore-based crypto-asset trading firm, recently highlighted that Bitcoin's recent breakout and other risk assets were driven by the US Consumer Price Index (CPI) decline to 3.4% in April. The firm anticipates this momentum will propel Bitcoin's price to $74,000.
Bitcoin Price Prediction Technical Perspective
The weekly chart shows that the last candle ended solid green, declaring a significant bullish force on the asset price and signaling the next candle to be another green one.
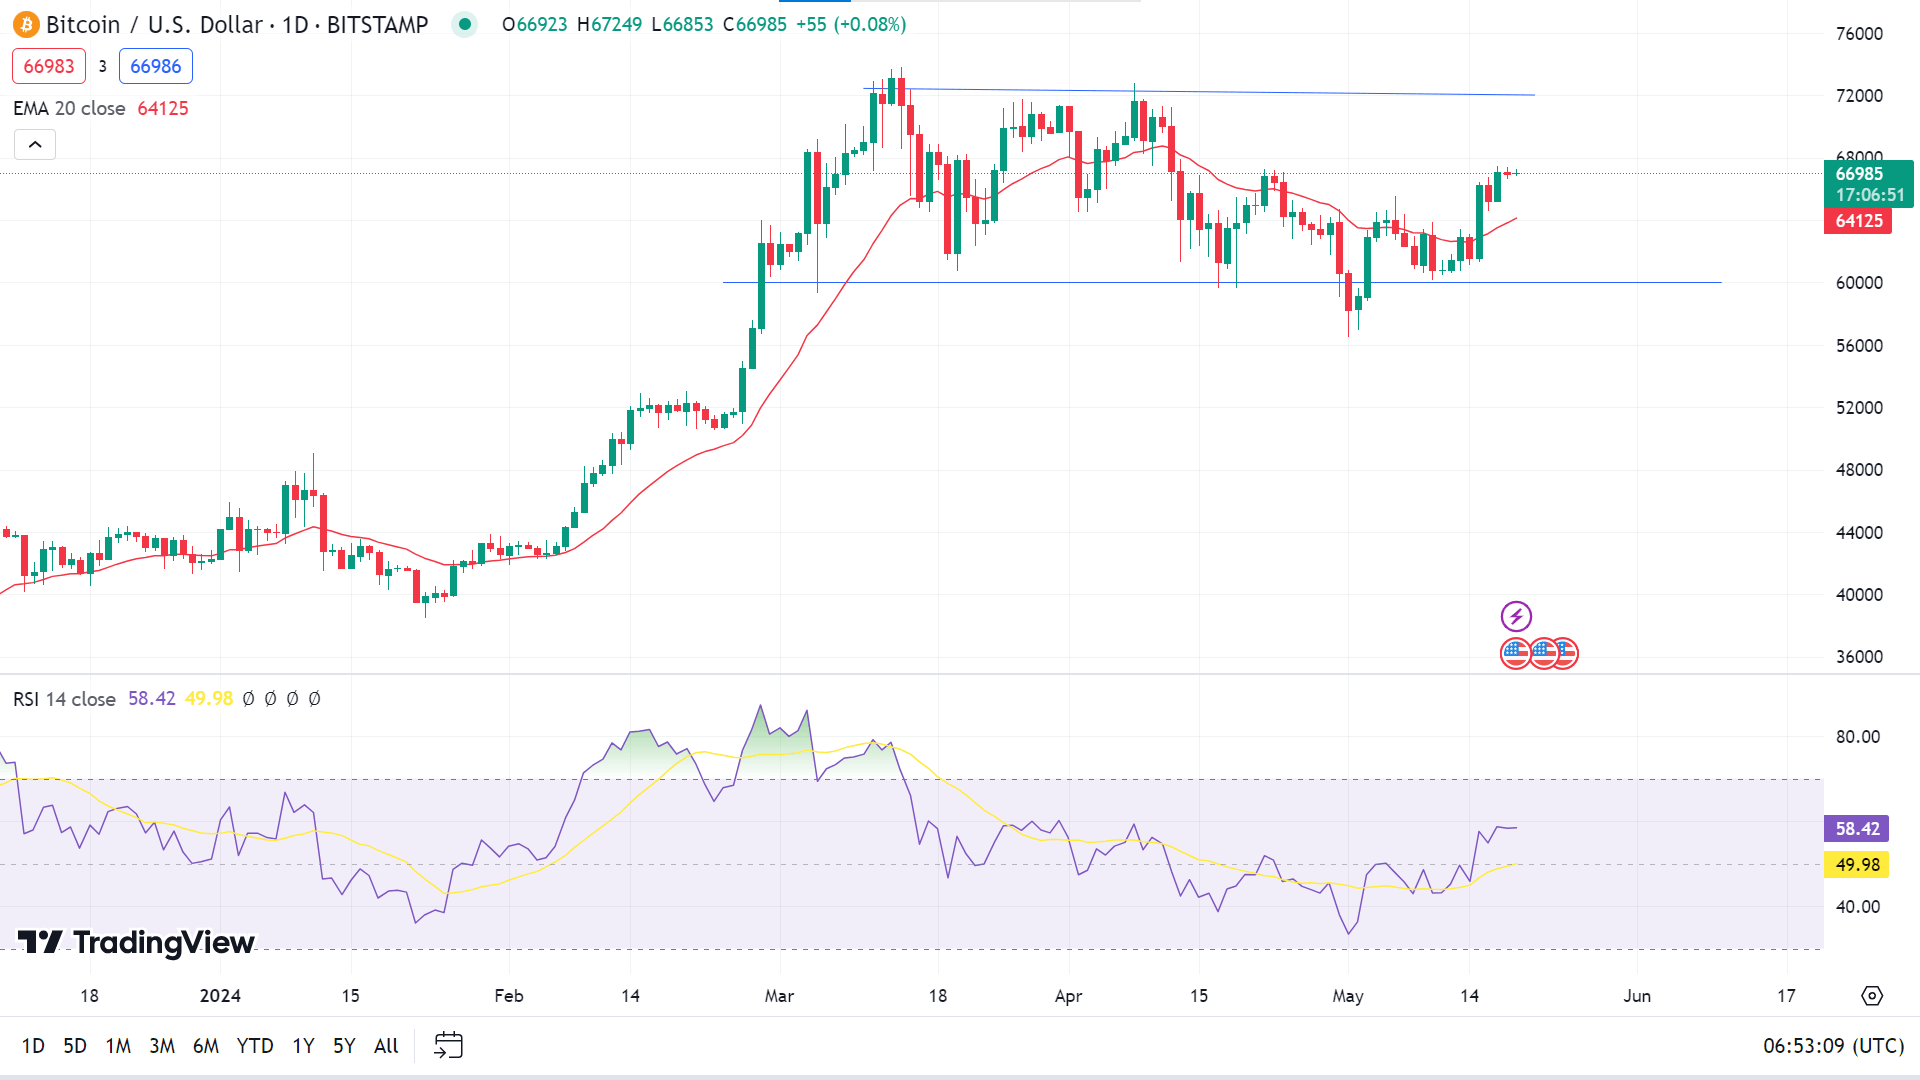
After months, the price reached above the EMA 20 line on the daily chart, and the RSI indicator reading remained above the 50 level, declaring a significant bullish force, hinting that the price may regain the recent peak of 72,756.00 or above.
However, if the RSI signal line starts sloping on the downside, the price can drop to the EMA 20 line at 64125.90 or to the next support at 60,000.00.
Ethereum (ETHUSD)
Fundamental Perspective
Ether (ETH) has underperformed the broader crypto market this year, yet its long-term potential remains strong, with significant upside surprises possible, according to a Coinbase (COIN) report. Despite a 29% year-to-date rise, Ether trails behind Bitcoin's (BTC) 50% surge and the CoinDesk 20 Index's (CD20) 28% advance.
Coinbase highlights Ether's potential for future gains, citing the absence of major supply-side pressures like token unlocks or miner sales. Analyst David Han notes that staking and layer 2 growth have become substantial, expanding sinks for ETH liquidity. Additionally, Ethereum's central role in decentralized finance (DeFi) is expected to remain secure due to the widespread adoption of the Ethereum Virtual Machine (EVM) and layer 2 innovations.
The EVM, Ethereum's native processing system, enables smart contract creation and interaction, while layer 2 solutions enhance scalability and efficiency. The potential approval of U.S. ether exchange-traded funds (ETFs) also holds considerable promise. Coinbase suggests the market might be underestimating the likelihood and timing of ETF approvals, which could lead to positive surprises. Even if the initial May 23, 2024, deadline is missed, litigation might reverse any rejection. In the meantime, structural demand and technological advancements are expected to sustain Ethereum's growth across multiple fronts.
Ethereum Price Prediction Technical Perspective
On the weekly chart, ETHUSD seems to have returned from the previous loss. The last candle was solid green, indicating that buyers are still active in pushing the price up. So, no wonder if the next candle comes another green one.
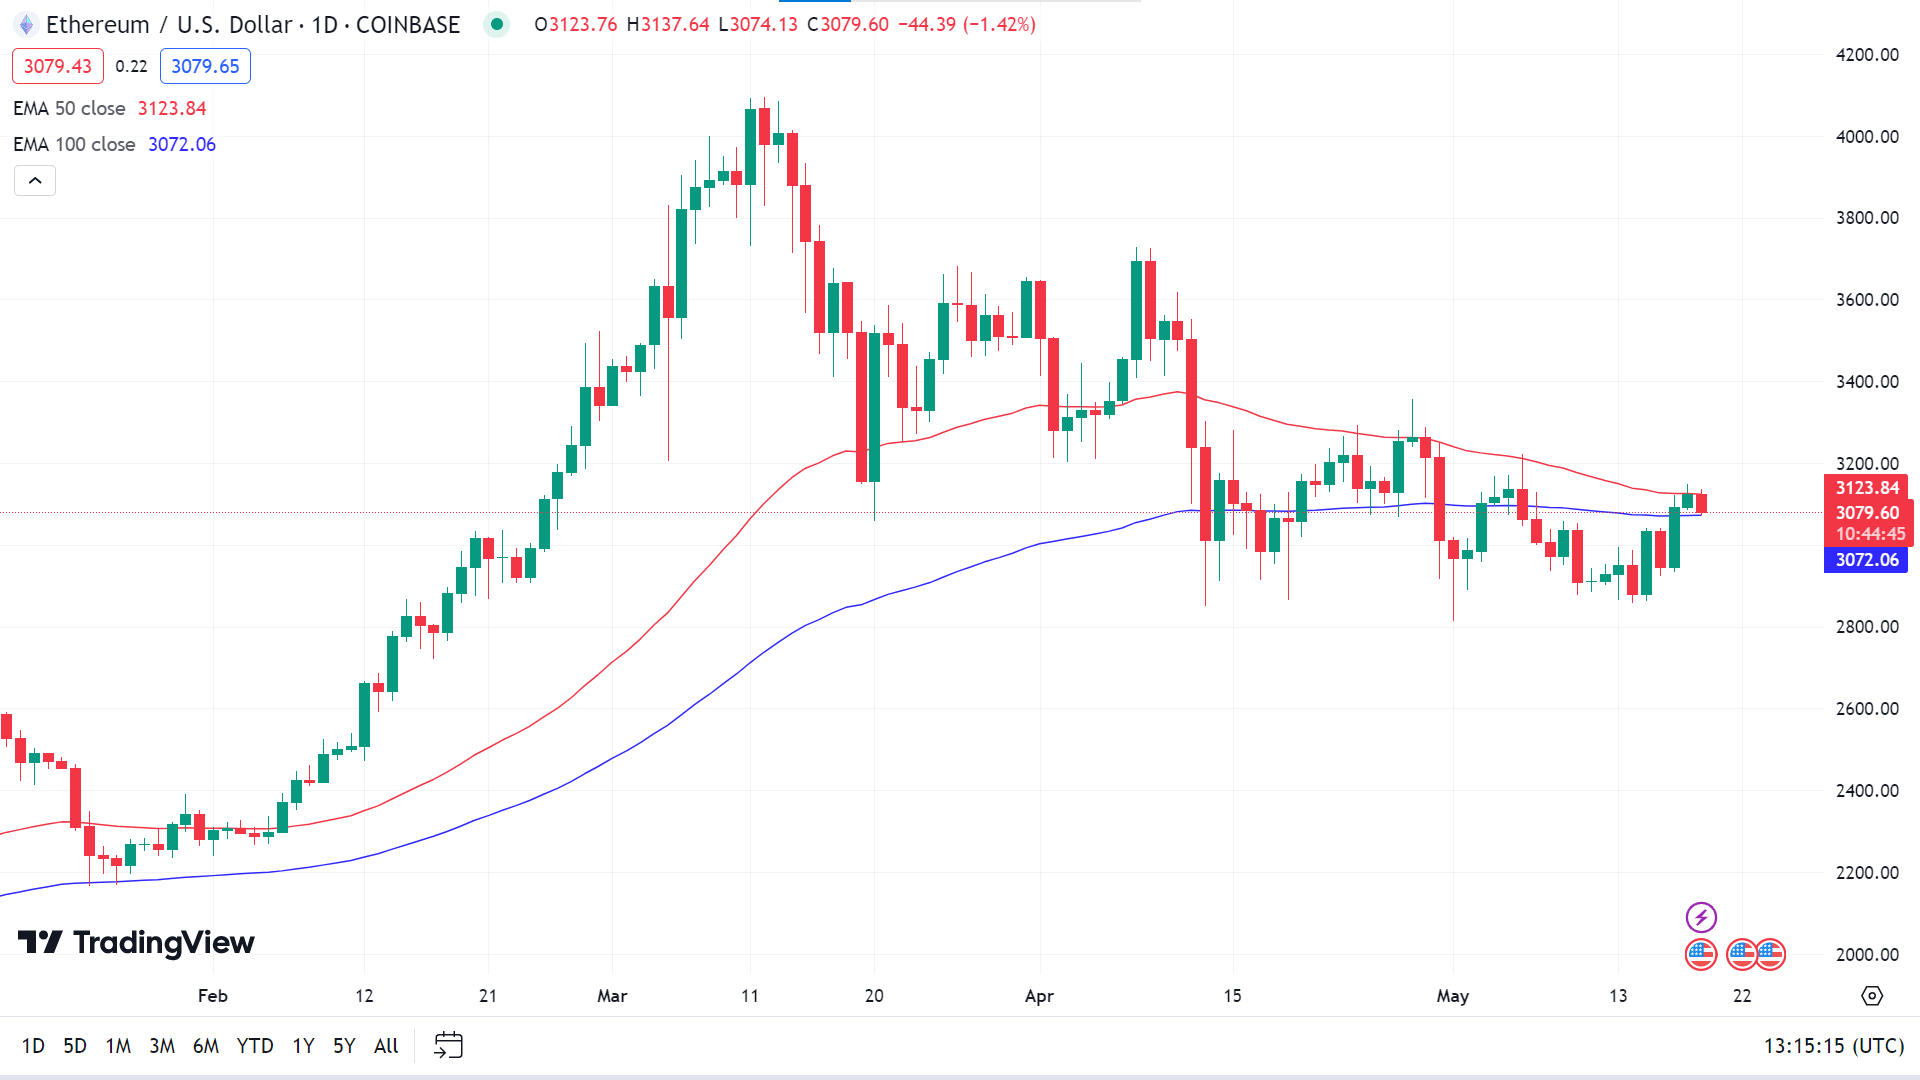
On the daily chart, the price floats just above the EMA 100 line, declaring bullish. There has been little push in the movement below the EMA 50 line, which acts as short-term resistance. If the price exceeds the EMA 50 line, it can regain the primary resistance of 3355.00, whereas the next resistance is near 3580.00.
Meanwhile, if the price reaches below the EMA 100 line, it can drop to the primary support of 2918.40 or further below.
Gold (XAUUSD)
Fundamental Perspective
Gold (XAUUSD) continued its upward momentum this week, climbing above $2,400 on Friday and posting nearly a 2% weekly gain. Investors remain focused on Federal Reserve (Fed) officials' comments and the forthcoming April 30-May 1 meeting minutes for cues on potential policy shifts.
At the start of the week, Gold faced bearish pressure, losing almost 1% on Monday due to technical corrections. However, Tuesday’s release of the Producer Price Index (PPI), which showed a 2.2% annual increase in April, weakened the US Dollar (USD) and bolstered Gold prices. Fed Chairman Jerome Powell noted the mixed nature of the PPI data, suggesting that restrictive policies might continue, which limited Gold’s immediate upside.
On Wednesday, the Consumer Price Index (CPI) revealed a slight dip in annual inflation to 3.4% in April, with core CPI inflation at 3.6%. This led to a 10-year US Treasury bond yield decline, pushing Gold higher. The US Retail Sales data remained stable, reflecting economic steadiness.
Fed officials' cautious remarks later in the week tempered expectations of imminent rate cuts, causing Gold to correct lower on Thursday. However, by Friday, boosted by week-end flows, Gold surged again, reaching its highest level in nearly a month. As investors await more Fed commentary and economic data next week, Gold's trajectory remains closely tied to evolving inflation trends and monetary policy signals.
Gold Price Prediction Technical Perspective
On the weekly chart, XAUUSD seems to continue moving up, posting two consecutive solid green candles, reflecting strong bullish pressure on the asset price. The next candle might be another green one.
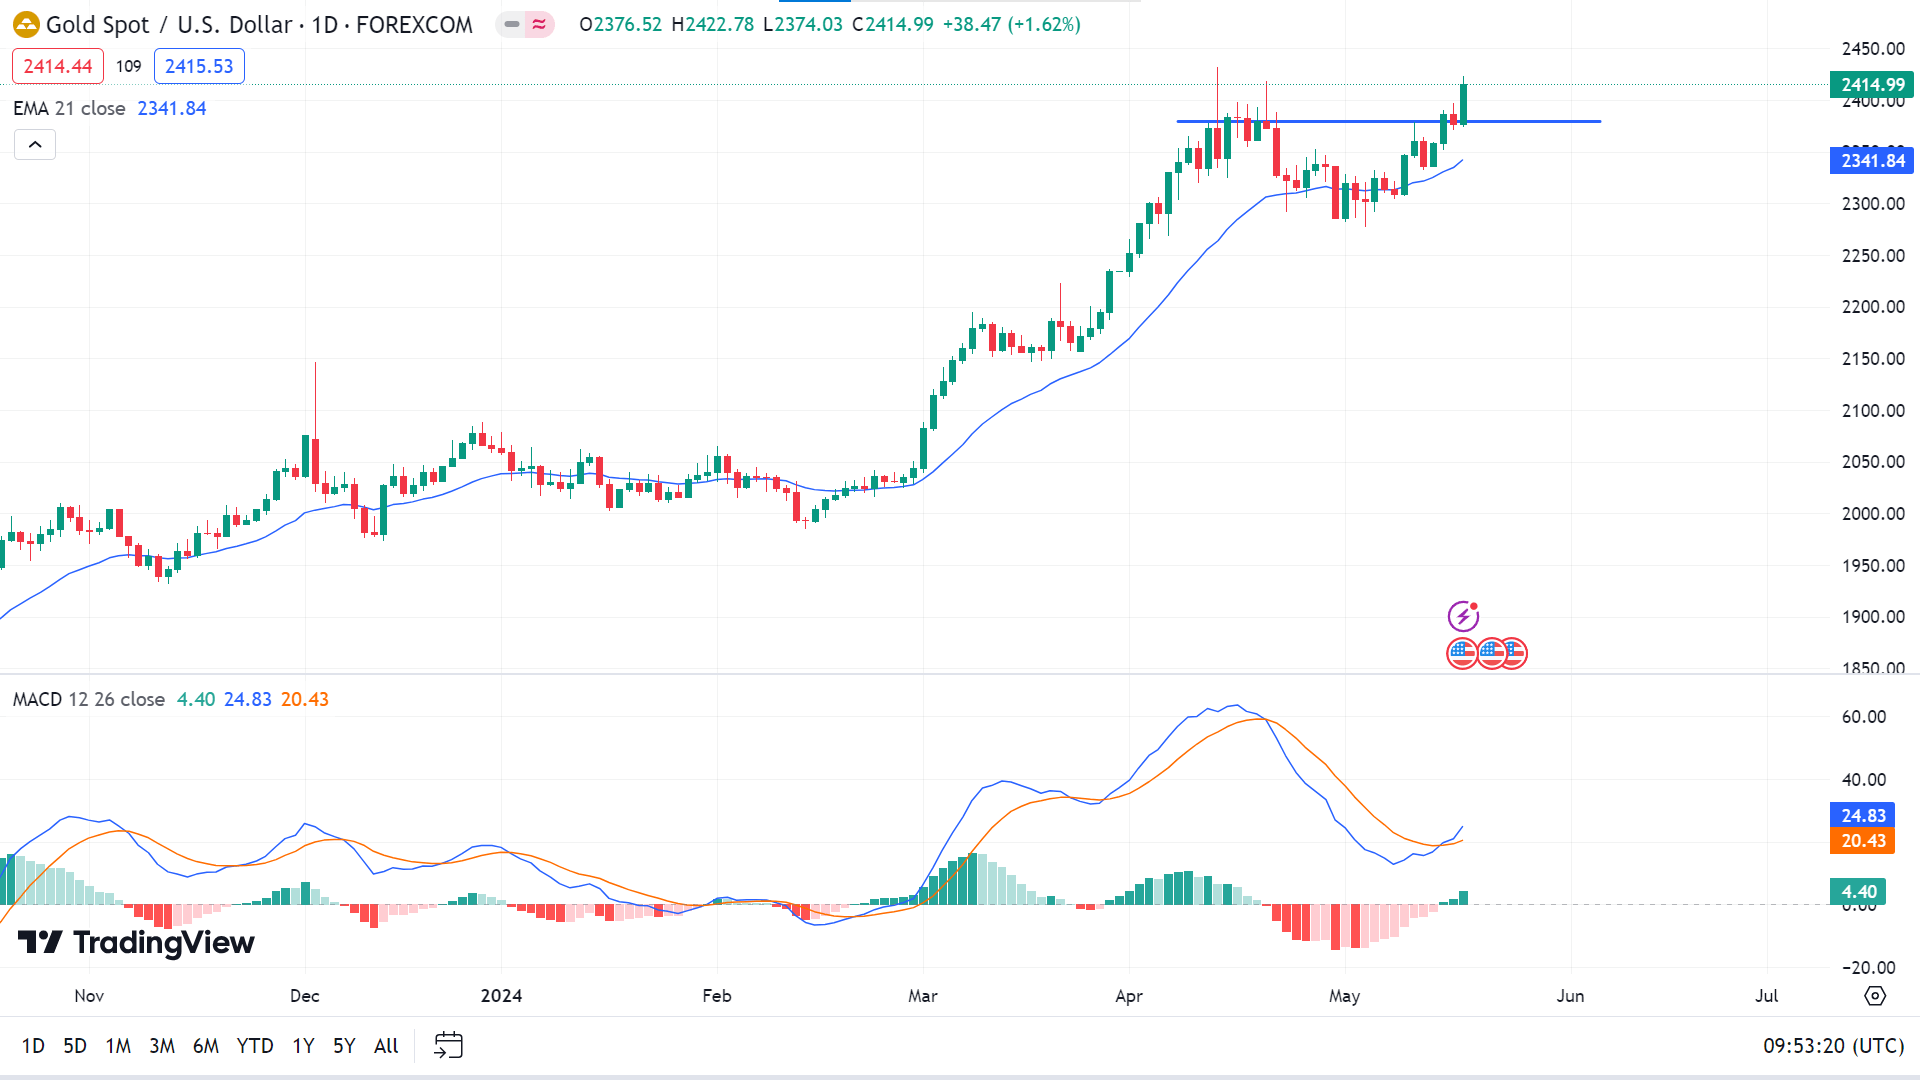
On the daily chart, XAUUSD surpasses the short-term resistance of 2380.00, remaining above the EMA 21 line. The MACD readings also support fresh, ideal bullish pressure. So, the price may head to find new resistance above the primary resistance of 2431.55.
Meanwhile, any decline below the primary support of 2380.00 can trigger the price to reach the support of 2341.84 at the EMA 21 line, followed by the next support near 2293.43. Meanwhile, the MACD reading will also follow the bearish movement.
Tesla Stock (TSLA)
Fundamental Perspective
Over the past year, Tesla has underperformed compared to the GX Autonomous & Electric Vehicles ETF (DRIV), which gained 6.5%. This lag is due to concerns about Tesla's ability to sustain EV sales growth, rising competition, and significant layoffs.
Recently, Tesla has rebounded, shedding its status as the worst-performing stock in the S&P 500. Following its April 23 earnings release, Tesla's shares surged over 13% in after-hours trading, despite a notable drop in net income. Investor sentiment improved due to the accelerated timeline for new affordable vehicles and agreements in China, boosting the stock's value.
For the fiscal year ending in December, analysts expect Tesla's EPS to decline by 27.3% to $1.89. Tesla's earnings surprise history is mixed, with the company beating or matching estimates in two of the last four quarters but missing in the other two.
Despite the recent rebound, the consensus on Tesla remains neutral. Of the 32 analysts covering the stock, eight rate it as "Strong Buy," two as "Moderate Buy," Despite trading above the mean price target of $176.45, the highest target of $310 suggests a 74.7% upside potential.
Tesla Stock Forecast Technical Perspective
The last weekly candle closed green after two consecutive losing weeks, leaving hope for buyers for the next week.
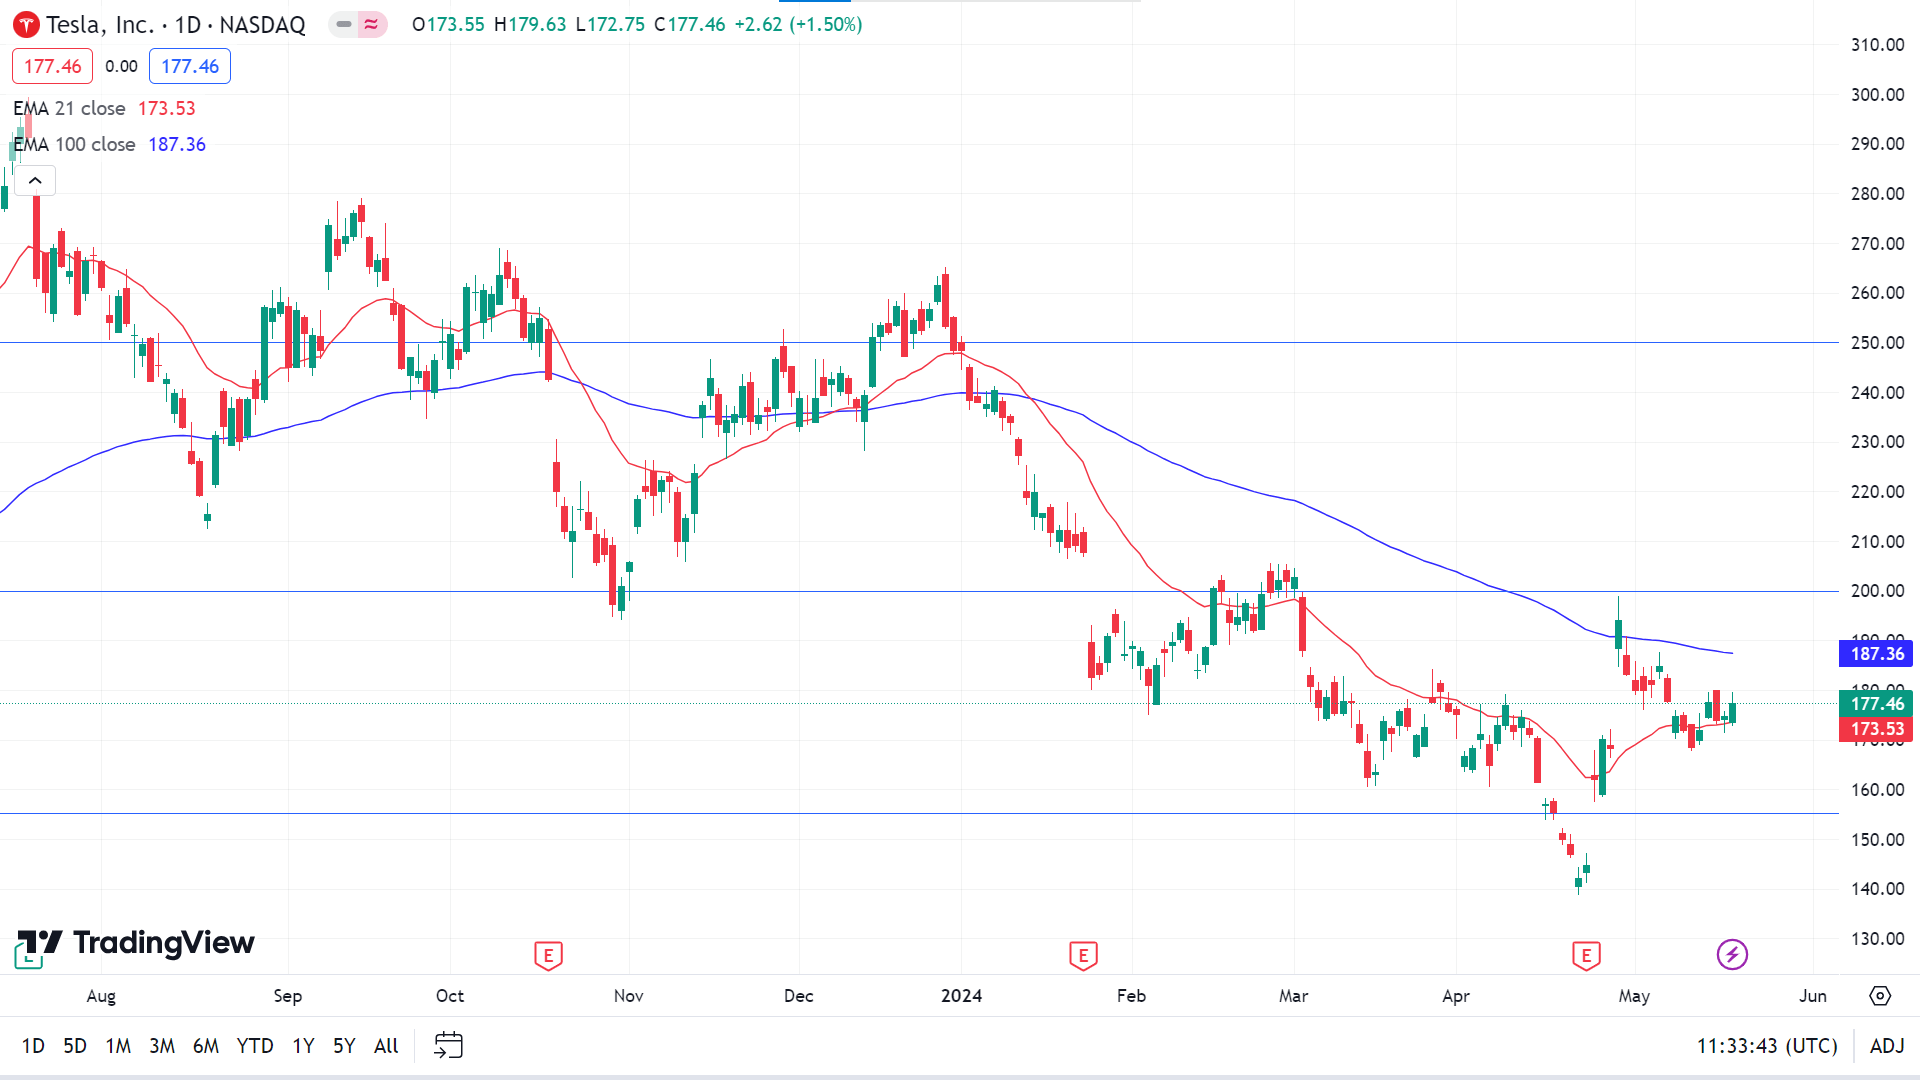
The price floating above the EMA 21 line reflects an active, positive force on the asset price; hunting the price may reach the primary resistance of $187.36, followed by the next resistance near $200.
Meanwhile, any price decline below the EMA 21 line will enable sell opportunities, which can trigger the price to reach the nearest support near $155.16, followed by the next support near $138.80.
Nvidia Stock (NVDA)
Fundamental Perspective
Santa Clara-based Nvidia Corporation (NVDA), a leader in the semiconductor industry, commands a market cap of $2.3 trillion. Celebrated for its high-speed graphics processing units (GPUs), Nvidia serves sectors such as gaming, data centers, and automotive markets. In mid-March, it showcased Project Groot for humanoid robots, updated its Isaac platform, and launched Jetson Thor, highlighting its prowess in robotics and artificial intelligence (AI).
Nvidia's stock has outshone the broader market over the past 52 weeks, soaring 206.5% compared to the S&P 500 Index's (SPX) 27.5% gain. In 2024 alone, NVDA shares surged 86.7%, in contrast to the SPX's 11.2% year-to-date increase. This remarkable performance is attributed to Nvidia's dominance in AI chips and robust demand across various industries, reinforced by positive analyst forecasts. Nvidia has firmly established itself as a major beneficiary of the AI boom.
However, on May 7, NVDA stock dropped 10.7% after Stanley Druckenmiller reduced his stake, citing market recognition. Viewing this as a buying opportunity, investors quickly rallied, leading to a close session with only a 1.7% decline.
Analysts expect NVDA to report a 92.2% EPS growth to $22.76 for the current fiscal year ending in January. Nvidia has a strong earnings surprise history, consistently surpassing consensus estimates, with recent quarters reflecting booming AI business.
Nvidia Stock Forecast Technical Perspective
On the weekly chart, NVDA delivered four consecutive weekly, with a green candle with wicks on both sides. The long upper wick reflects weak buying till the closing of the last week, leaving confusion that the next candle can be either green or red.
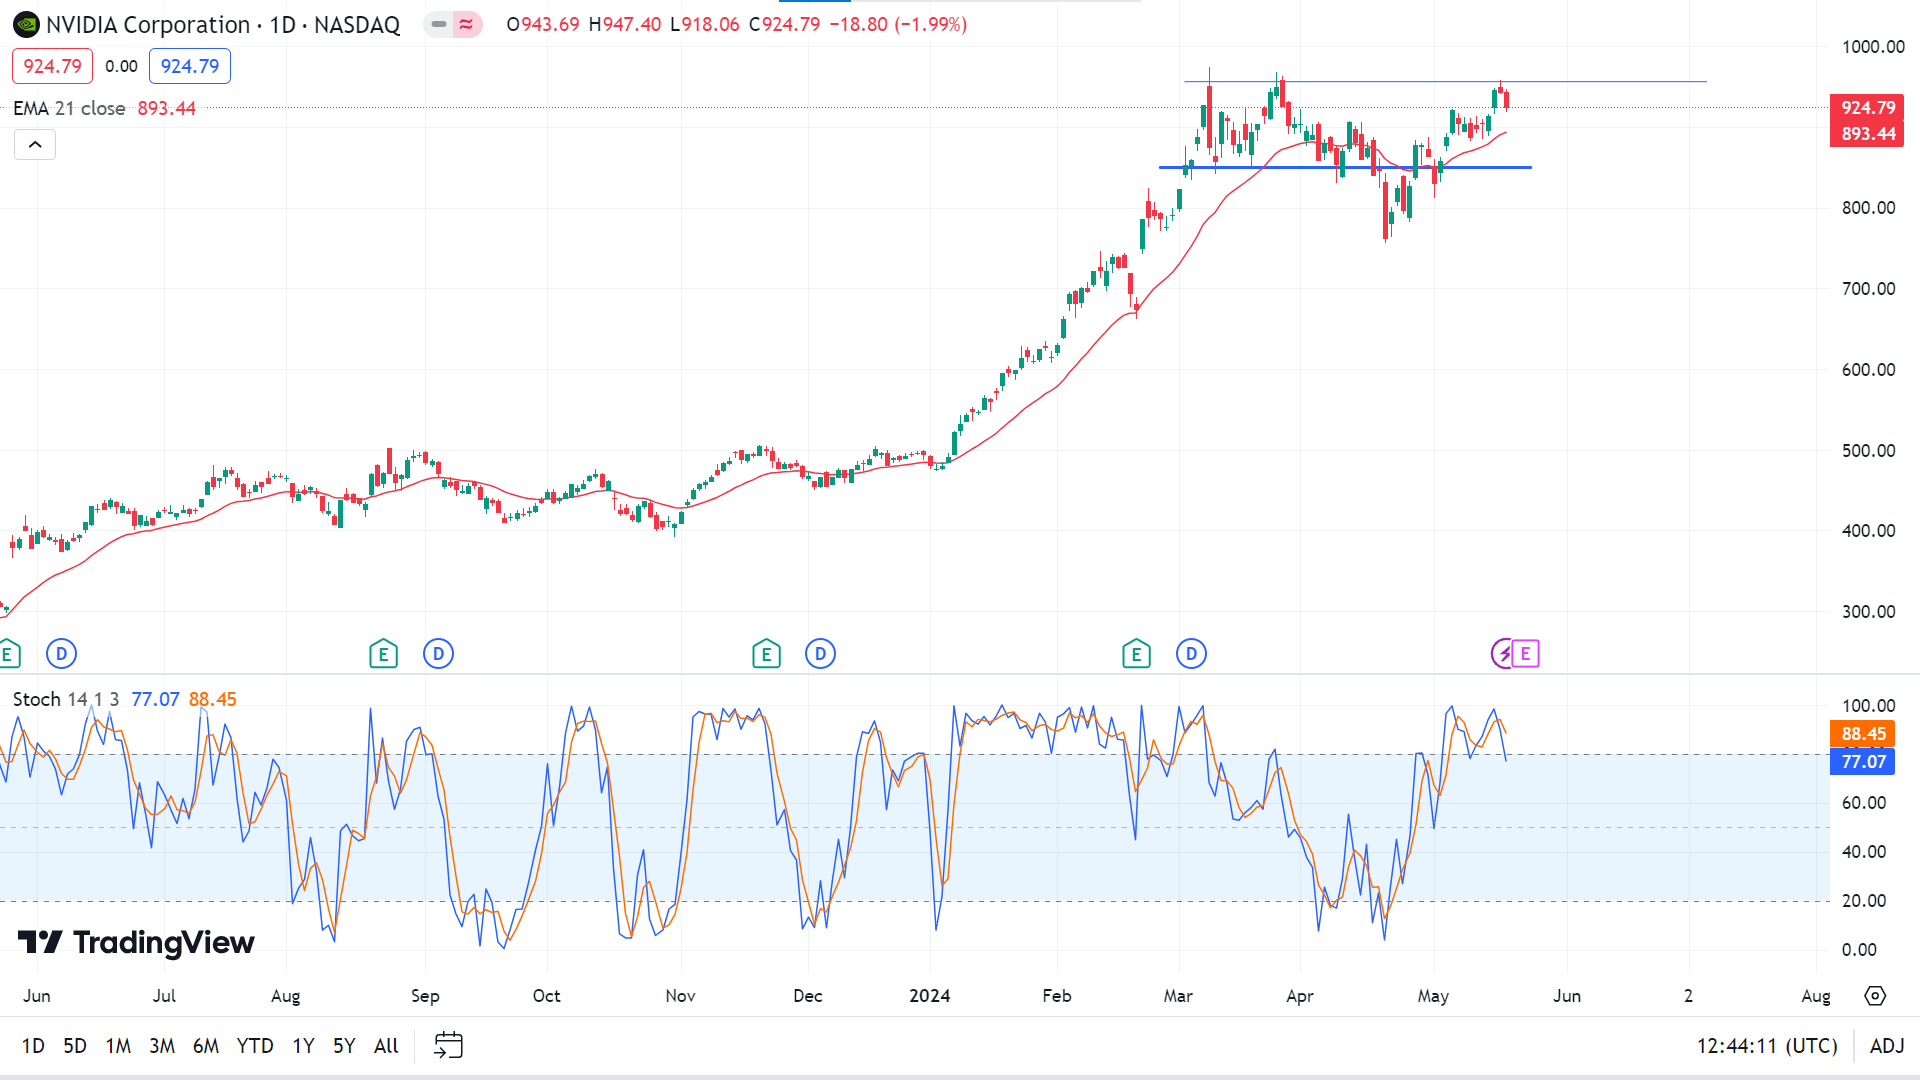
The price is floating above the EMA 21 line, indicating active bullish pressure, and just below a previous resistance of 956.18. Meanwhile, the Stochastic indicator creates a bearish crossover at the overbought level. Any breakout above 956.18 can trigger the price to reach the predicted level of 1000.00 or above.
Meanwhile, any correction below the EMA 21 line can trigger the price to drop to the nearest support of 850.00, as the Stochastic indicator defines fresh sell activity. The next support is near 788.81.
WTI Crude Oil (USOUSD)
Fundamental Perspective
Crude oil prices are currently supported by the escalating Hamas-Israel conflict. Israel's military is preparing for significant operations in Rafah, Gaza, despite opposition from the Biden administration. Concerns are mounting that the conflict could extend to Hezbollah in Lebanon or escalate into a direct confrontation with Iran. Additionally, attacks on commercial shipping in the Red Sea by Iran-backed Houthi rebels are forcing ships to reroute around Africa, disrupting global oil supplies.
On the bearish side, the International Energy Agency (IEA) recently lowered its 2024 global fuel consumption forecast by 140,000 barrels per day (bpd) to 1.1 million bpd. Moreover, potential discord within OPEC+ looms as the UAE, Iraq, Algeria, and Kazakhstan seek to increase their output quotas while Saudi Arabia urges caution. The consensus is that OPEC+ will likely maintain current production cuts through the year's second half.
Higher-than-expected Russian crude output adds to the bearish outlook, with April production exceeding targets by 300,000 bpd. Conversely, reduced floating storage levels provide price support, with stationary tankers' crude oil falling 11% to a four-year low.
The latest EIA report shows US crude oil inventories 3.9% below the five-year seasonal average, gasoline inventories 1.2% below, and distillate inventories 7.1% below. US crude production held steady at 13.1 million bpd, just shy of the peak of 13.3 million bpd.
Oil Prices Forecast Technical Perspective
The last weekly candle finished green after a doji, with lower wicks reflecting buyers' dominance at the asset price. This left investors optimistic that the next candle could be another green one.
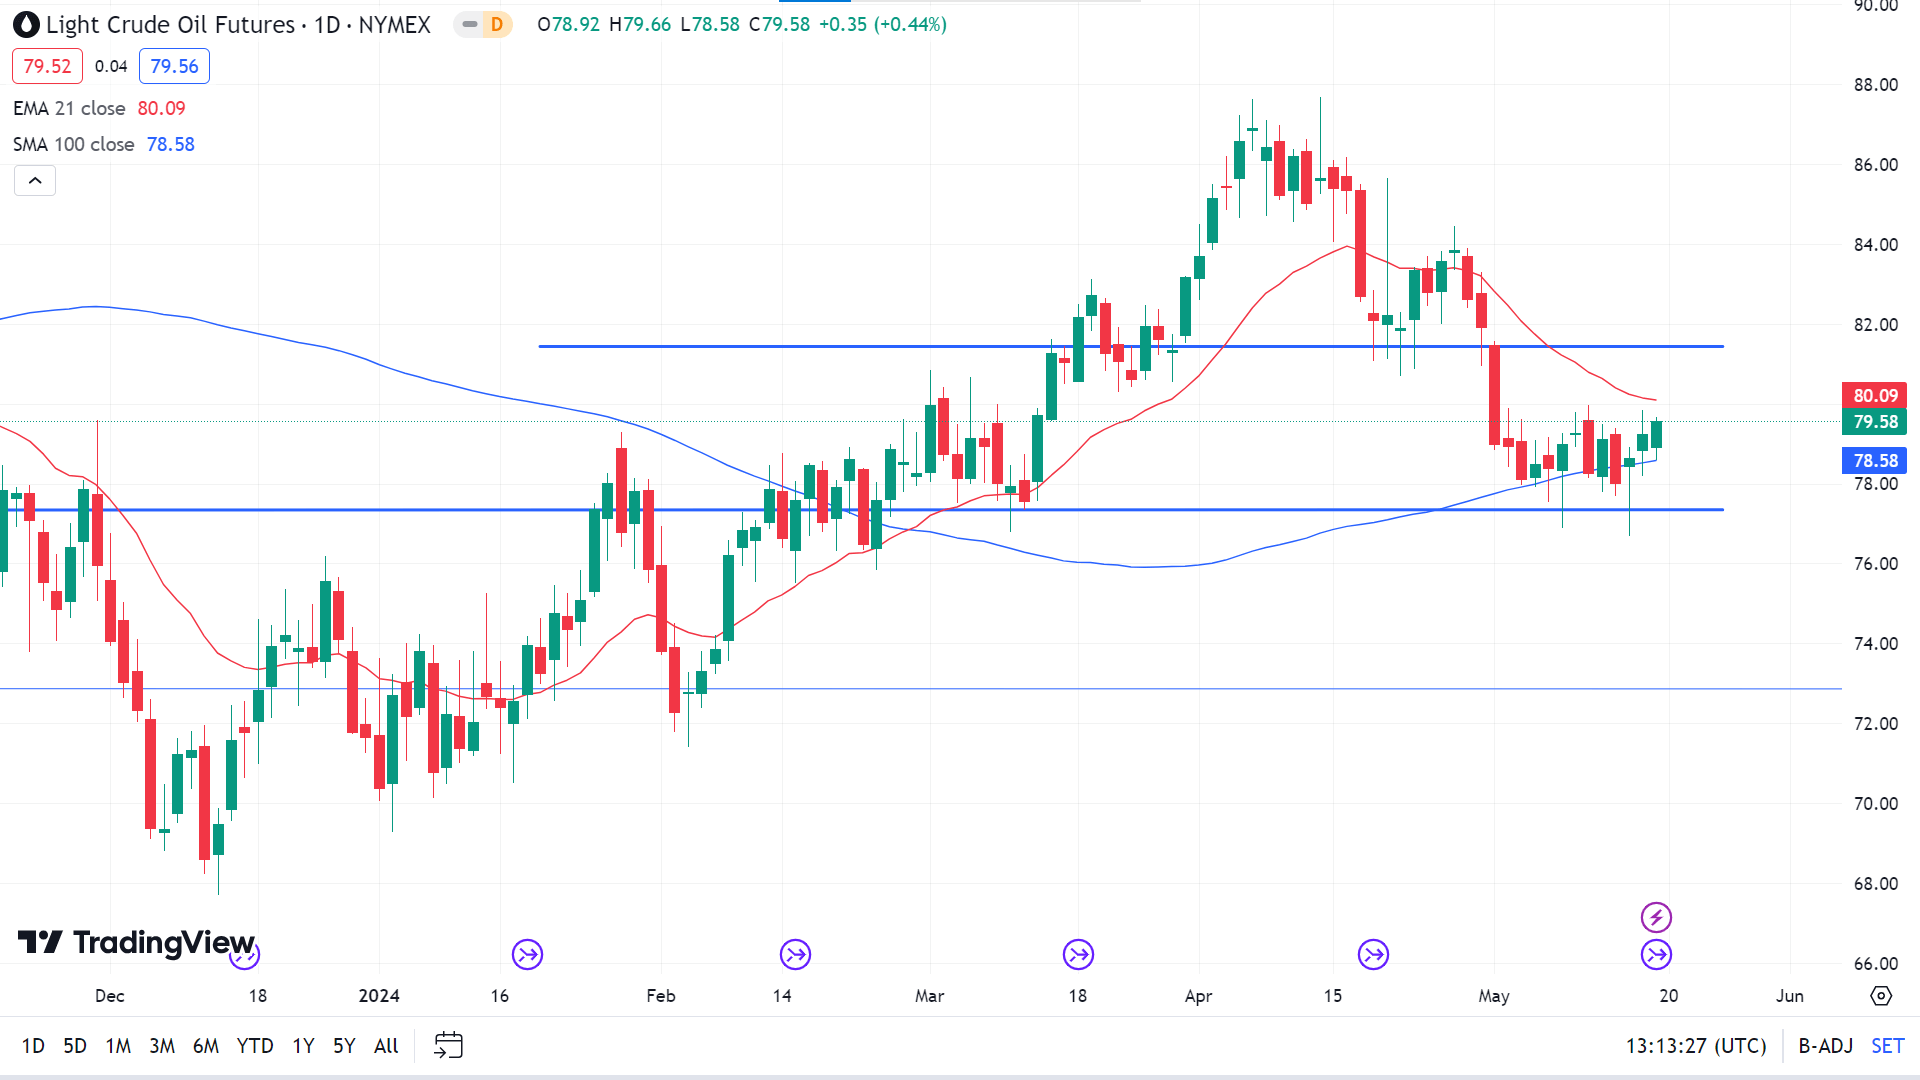
On the daily chart, the price floats above the SMA 100 line, indicating bullish pressure, whereas it remains just below the EMA 21 line, leaving hope for sellers. Any breakout above the EMA 21 line can trigger the price to reach the nearest resistance near 81.44, followed by the next resistance near 84.46.
Meanwhile, if the price exceeds the SMA 100 line on the downside, it can decline to the nearest support of 77.34, followed by the next support near 74.93.


