
EURUSD
Fundamental Perspective
The EUR/USD pair closed its third consecutive week with little movement, hovering below 1.0800, and has consistently encountered resistance near 1.0900. Despite various significant economic events, the pair must still find a clear direction, reflecting investor uncertainty about future economic conditions.
The European Central Bank (ECB) trimmed interest rates by 25 basis points, bringing the primary refinancing operations rate to 4.25% and the deposit facility to 3.75%. However, the ECB's stance was considered hawkish, as President Christine Lagarde hinted that further cuts might be delayed until September, contingent on forthcoming data. The ECB revised its GDP growth forecast for 2024, slightly down for 2025 and unchanged for 2026, while raising inflation projections to 2.5% for 2024 and 2.2% for 2025.
In the United States, employment data was pivotal. April job openings fell to 8.059 million, and the ADP report showed the private sector added 152,000 jobs in May, both figures below expectations. However, the nonfarm payrolls report surpassed forecasts with 272,000 new jobs, highlighting a tight labor market and persistent inflation. It diminished the prospects for Federal Reserve rate cuts, strengthening the US Dollar against the Euro. While policymakers have clarified their positions, further data is necessary to illuminate the future economic path.
EURUSD Forecast Technical Perspective
On the weekly chart, the last candle closed as a hammer with a red body and upper wick, reflecting bearish pressure on the asset price, especially after a doji. The next candle might be another red one, supporting the circumstances.
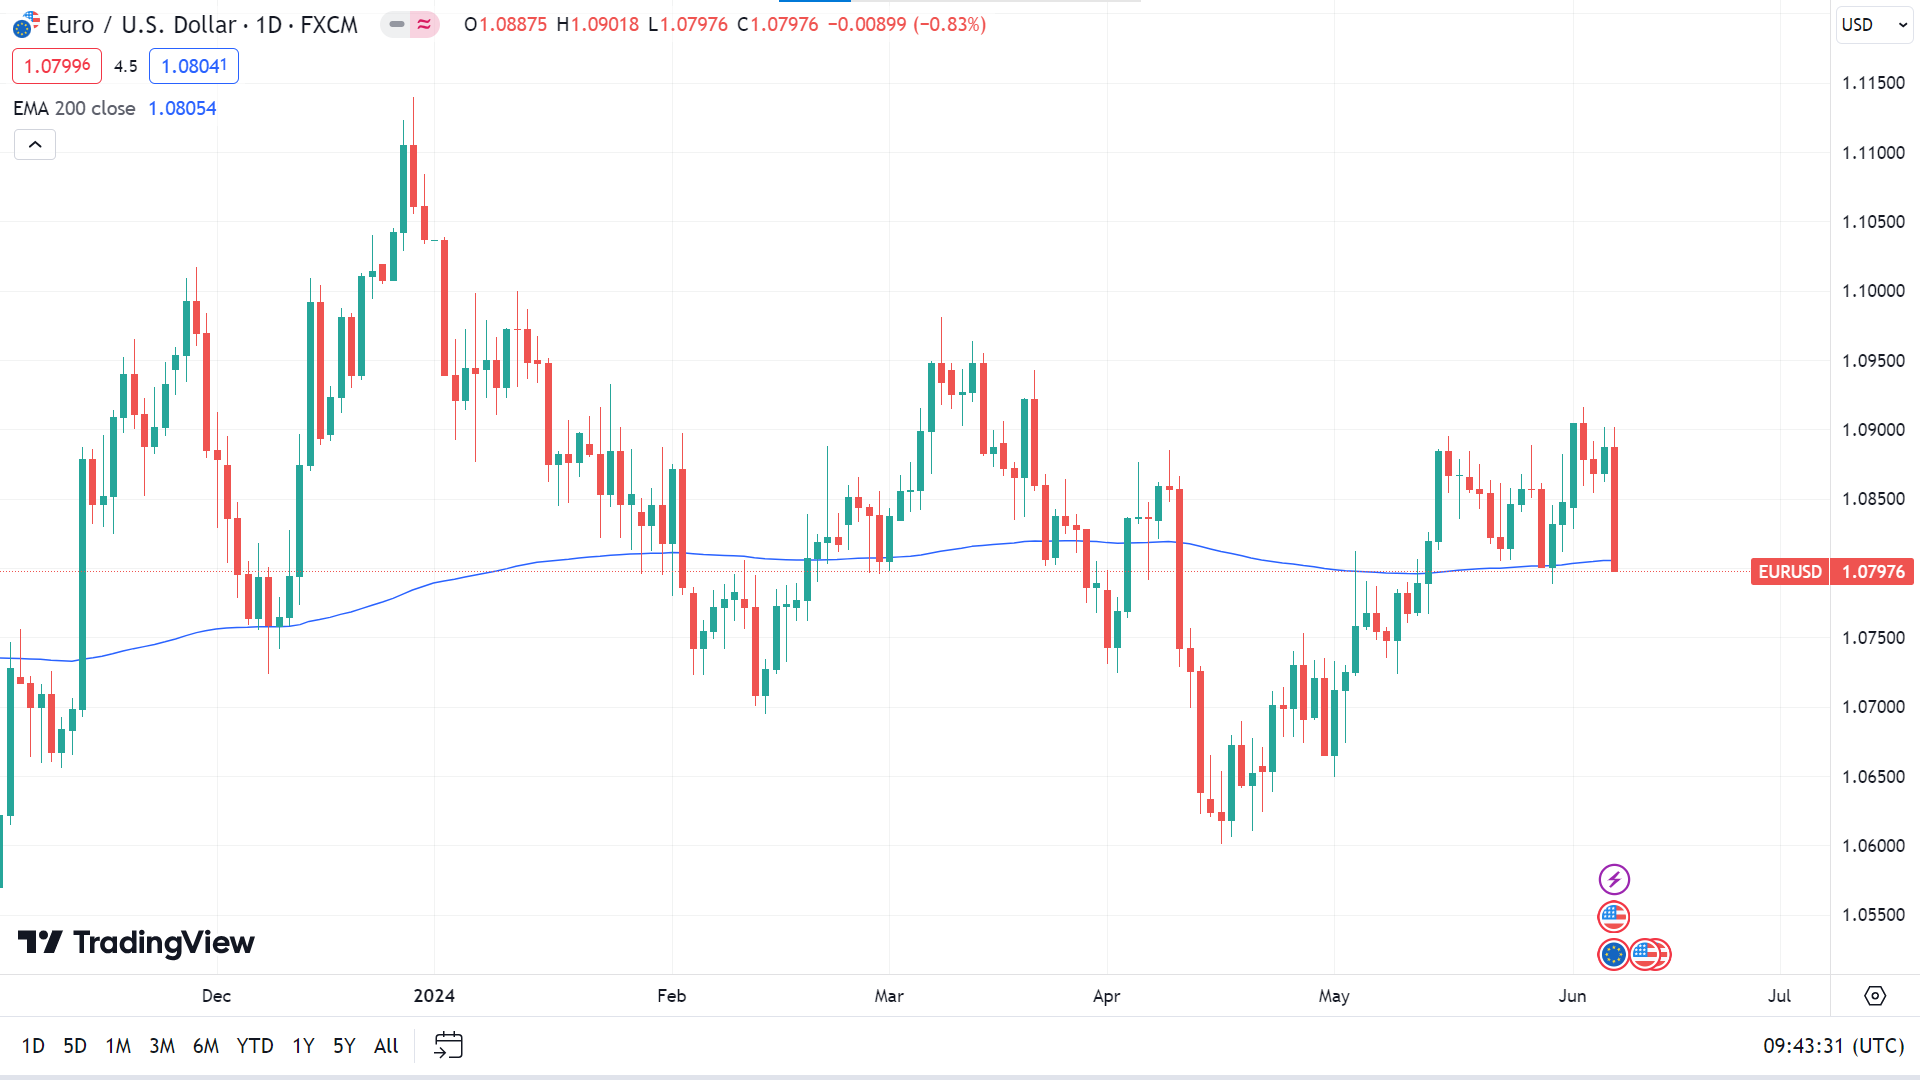
The price floats just below the EMA 200 line on the daily chart, reflecting fresh bearish pressure. It indicates the next move toward the nearest support of 1.0705, followed by the next support near 1.0608.
Meanwhile, if the price surpasses the EMA 200 line, it may reach the primary resistance of 1.0897, followed by the next resistance near 1.1104.
GBPJPY
Fundamental Perspective
The Bank of Japan's (BoJ) endeavors to normalize its monetary policy were further complicated because real wages in Japan declined for the 25th consecutive month in April, as domestic inflation continued to outpace wage growth. Interest rates in the ultra-low range of 0.0% to 0.1% by the BoJ, the sole major central bank still engaged in quantitative easing (QE). The Yen has been considerably devalued due to this policy, which has prompted policymakers to express apprehension regarding its adverse effects on business activity.
GBPJPY declined earlier this week in response to speculation that the Bank of Japan may decrease its bond purchases. This move is expected to raise Japanese bond yields and strengthen the Japanese yen. Nevertheless, the truth of these allegations has yet to be ascertained.
Any potential upside for GBPJPY might be limited by direct intervention from Japanese authorities to bolster the Yen in forex markets. BoJ Deputy Governor Ryozo Himino highlighted the adverse effects of a weak Yen on the economy, hinting at possible future interventions. He emphasized that inflation driven by wage growth, rather than a weak currency, would lead to a more dynamic economy.
Meanwhile, Sterling has quietly appreciated, with upcoming UK jobs and GDP data in focus. Although the UK labor market has softened, recent survey data indicates positive signs of growth. The BoJ's more relaxed stance on bond purchases could see Japanese 10-year yields rise above 1%, potentially lifting the Yen.
GBPJPY Forecast Technical Perspective
The last weekly candle closed with a red body and lower wicks, reflecting the seller's presence after four consecutive gaining weeks. If the sellers continue to dominate the market, the upcoming candle can be another red one.
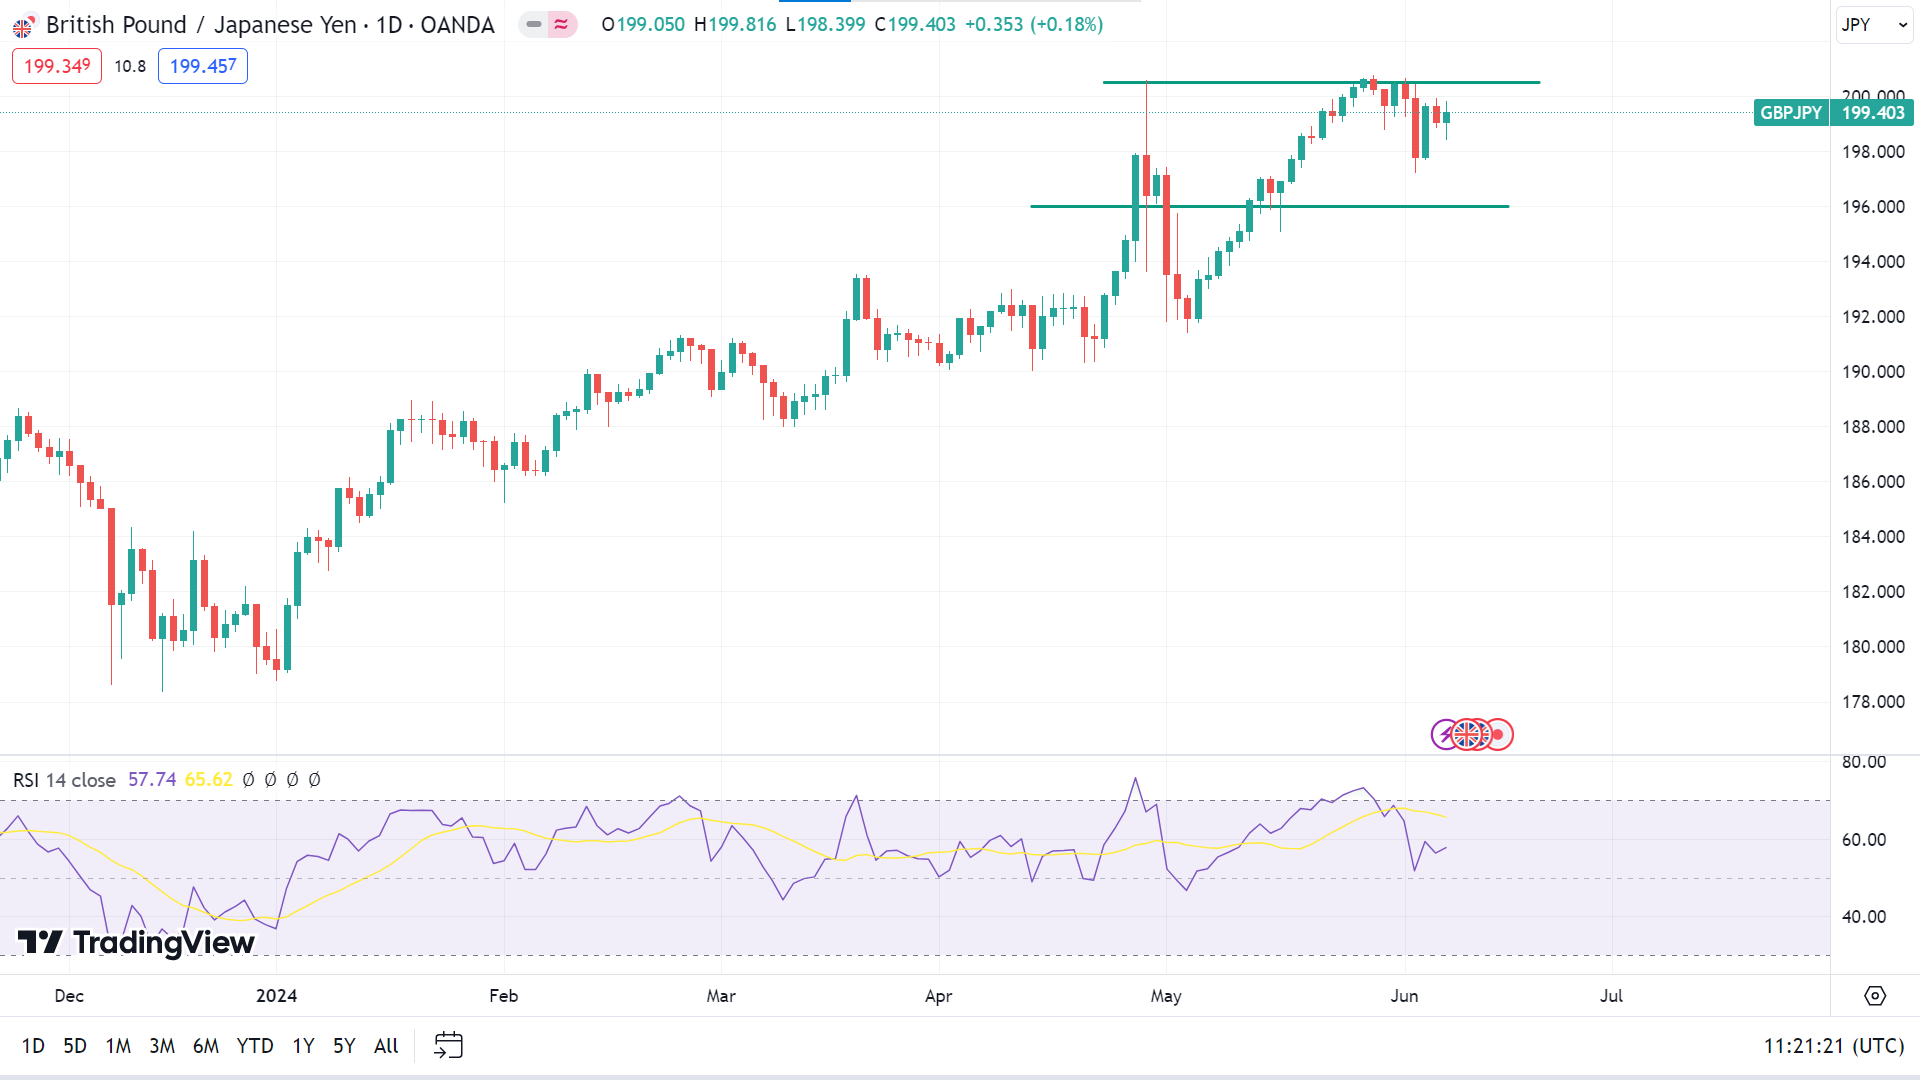
The 200 SMA mark acts as a resistance on the daily chart, while the RSI reading remains neutral. So, if the price gets back above this level, it may head to the nearest resistance, 201.09, followed by the next resistance near 203.31.
Meanwhile, the price returns below the 200 mark, indicating bulls may lose power at this level. So, the price may head to the nearest support of 197.25, followed by the historical support of 196.00.
Nasdaq 100 (NAS100)
Fundamental Perspective
The unexpected surge in US job growth has substantially supported the dollar, boosting its performance ahead of the upcoming US CPI release for May and the FOMC meeting. The non-farm payroll data, released on Friday, surpassed even the most optimistic forecasts, and average earnings for May also exceeded expectations, reinforcing the dollar’s bullish trend.
Although the unemployment rate rose to 4%, this increase was overshadowed by the strength of the job and wage data. Next week, crucial US economic data will be released, with a particularly busy Wednesday featuring the US CPI report and the FOMC rate decision. While the unexpected job growth is unlikely to significantly alter the Federal Reserve’s current stance, it has influenced market pricing, reflecting one fully anticipated rate cut this year with a chance of a second.
Other US macroeconomic indicators have shown signs of easing, suggesting that the jobs data will need close monitoring to determine if it signals a broader trend. For now, this robust employment report stands as a significant yet isolated data point.
Among crucial data releases, earnings from Cosan S.A., Oracle Corporation (ORCL), Broadcom Inc. (AVGO), Adobe Inc (ADBE), and Yiren Digital Ltd. (YRN).
Technical Perspective
The last weekly candle closed as a hammer with a green body and lower wick after a bit of pause in the current uptrend, leaving optimism for buyers in the upcoming week as the next candle might be another green one.
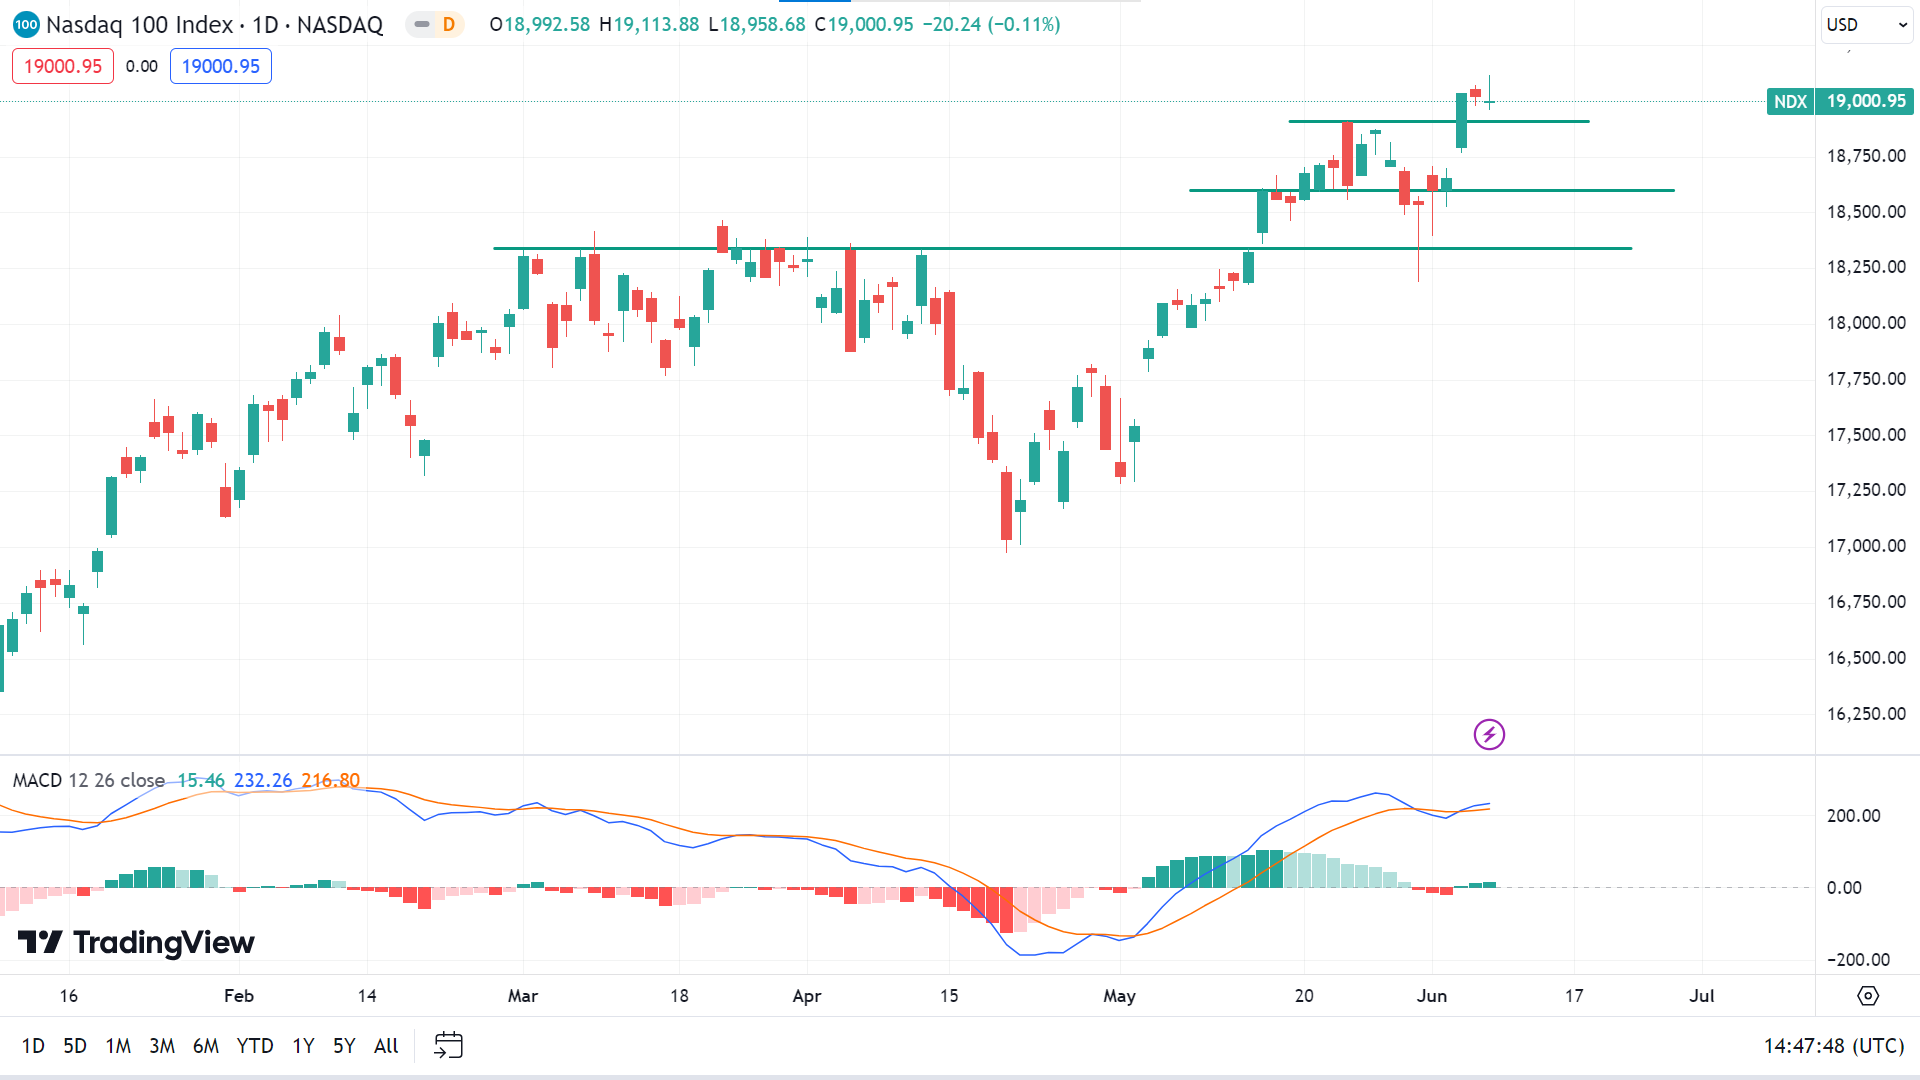
On the daily chart, the price recently hit the ATH of $19113.88. The MACD indicator reading signals bullish pressure on the asset price. So, any breakout above the recent ATH is the nearest resistance of $19245.98 in the upcoming days. The next resistance is near $19866.03.
Meanwhile, on the downside, the closest support is near $18907.54, and further decline can trigger the price to the next support near $18600.82. Then, the MACD reading will also follow the movement.
S&P 500 (SPX500)
Fundamental Perspective
The benchmark S&P 500 initially slipped following the latest report, while U.S. Treasury yields climbed as traders reduced their expectations for a September rate cut. However, the index quickly rebounded, briefly reaching a fresh intraday record high as investors recognized underlying economic strength.
For the week, the S&P 500 gained 1.32%, the Nasdaq rose 2.38%, and the Dow added 0.29%. According to the CME's FedWatch tool, traders now see a 56% chance of a September rate reduction. Next week, investors will closely monitor U.S. inflation data and the Federal Reserve's two-day policy meeting, which concludes on June 12.
The Labor Department's Nonfarm Payrolls report revealed that the economy added 272,000 jobs in May, significantly surpassing expectations, while average hourly earnings exceeded forecasts. It initially caused stocks to fall as traders adjusted their rate-cut predictions. However, indexes pared losses after other indicators pointed to economic weaknesses.
The unemployment rate rose to 4%, higher than anticipated, and a survey of U.S. households showed a 408,000 decline in employment. Additionally, Nonfarm Payroll figures for April and March were revised downward, adding complexity to the economic outlook.
Technical Perspective
The last candle on the weekly chart finished as a bullish hammer, with socks on both sides reflecting the positive pressure on the asset price. The upcoming candle will most likely be another green one.
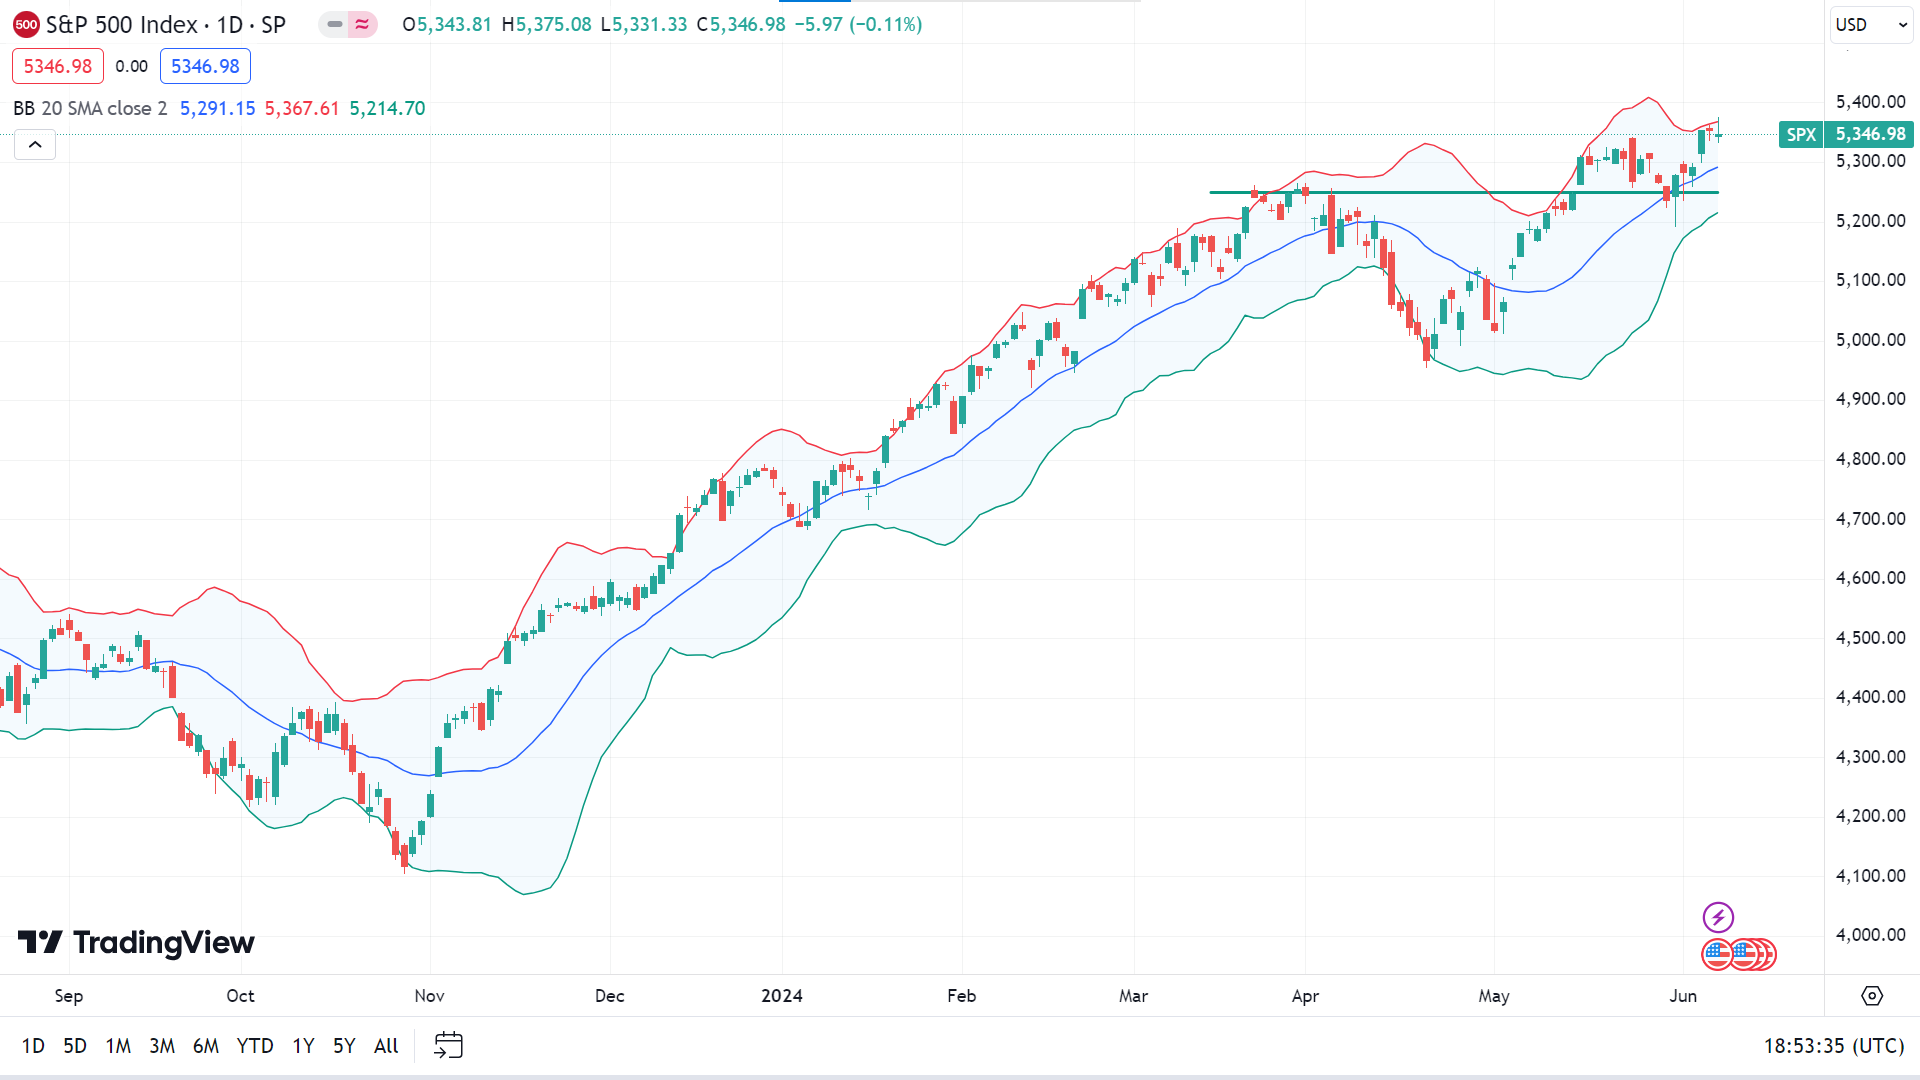
On the daily chart, the price closely moves with the upper band of the Bollinger Bands indicator, reflecting a solid uptrend, which leaves optimism that the price may hit a new ATH, surpassing the peak of $5375.08. The nearest resistance after the ATH is near $5414.60, whereas the next possible resistance will be $5540.97.
On the other hand, the price on the upper band often indicates that it is at an overbought level, and a retracement may be expected. So, any slip from the peak can enable the price to return to the nearest support of $5290.02, followed by the following support near $5191.68.
Bitcoin (BTCUSD)
Fundamental Perspective
CryptoQuant, an on-chain analytics firm, has provided insights into why Bitcoin and Ethereum have recently shown signs of acceleration. In a new thread on X, the official CryptoQuant handle discussed key on-chain indicators influencing these cryptocurrencies.
One significant metric tracks the demand from long-term holders and whales. For Bitcoin, demand from permanent holders, or HODLers, has declined since March but has recently surged. These investors have added 70,000 BTC to their wallets over the past month.
A similar trend is observed among whales, defined as addresses holding over 1,000 BTC. CryptoQuant reports a 4.4% increase in monthly demand from these large investors.
Additionally, CryptoQuant noted an influx of new capital, evidenced by the rising Realized Cap of "new whales." The Realized Cap measures a specific investor group's capital amount to purchase Bitcoin. The increase in the Realized Cap of new whale entities that have entered the market within the past 155 days suggests a fresh demand from large investors entering BTC.
These trends indicate that significant players are increasing their holdings, potentially signaling upward momentum for Bitcoin and Ethereum.
Bitcoin Price Prediction Technical Perspective
The last weekly candle finished green, but the upper wick shows that bulls may be losing power. The current bull run can’t surpass the previous high. So, the next candle can be another red one without sufficient bullish pressure.
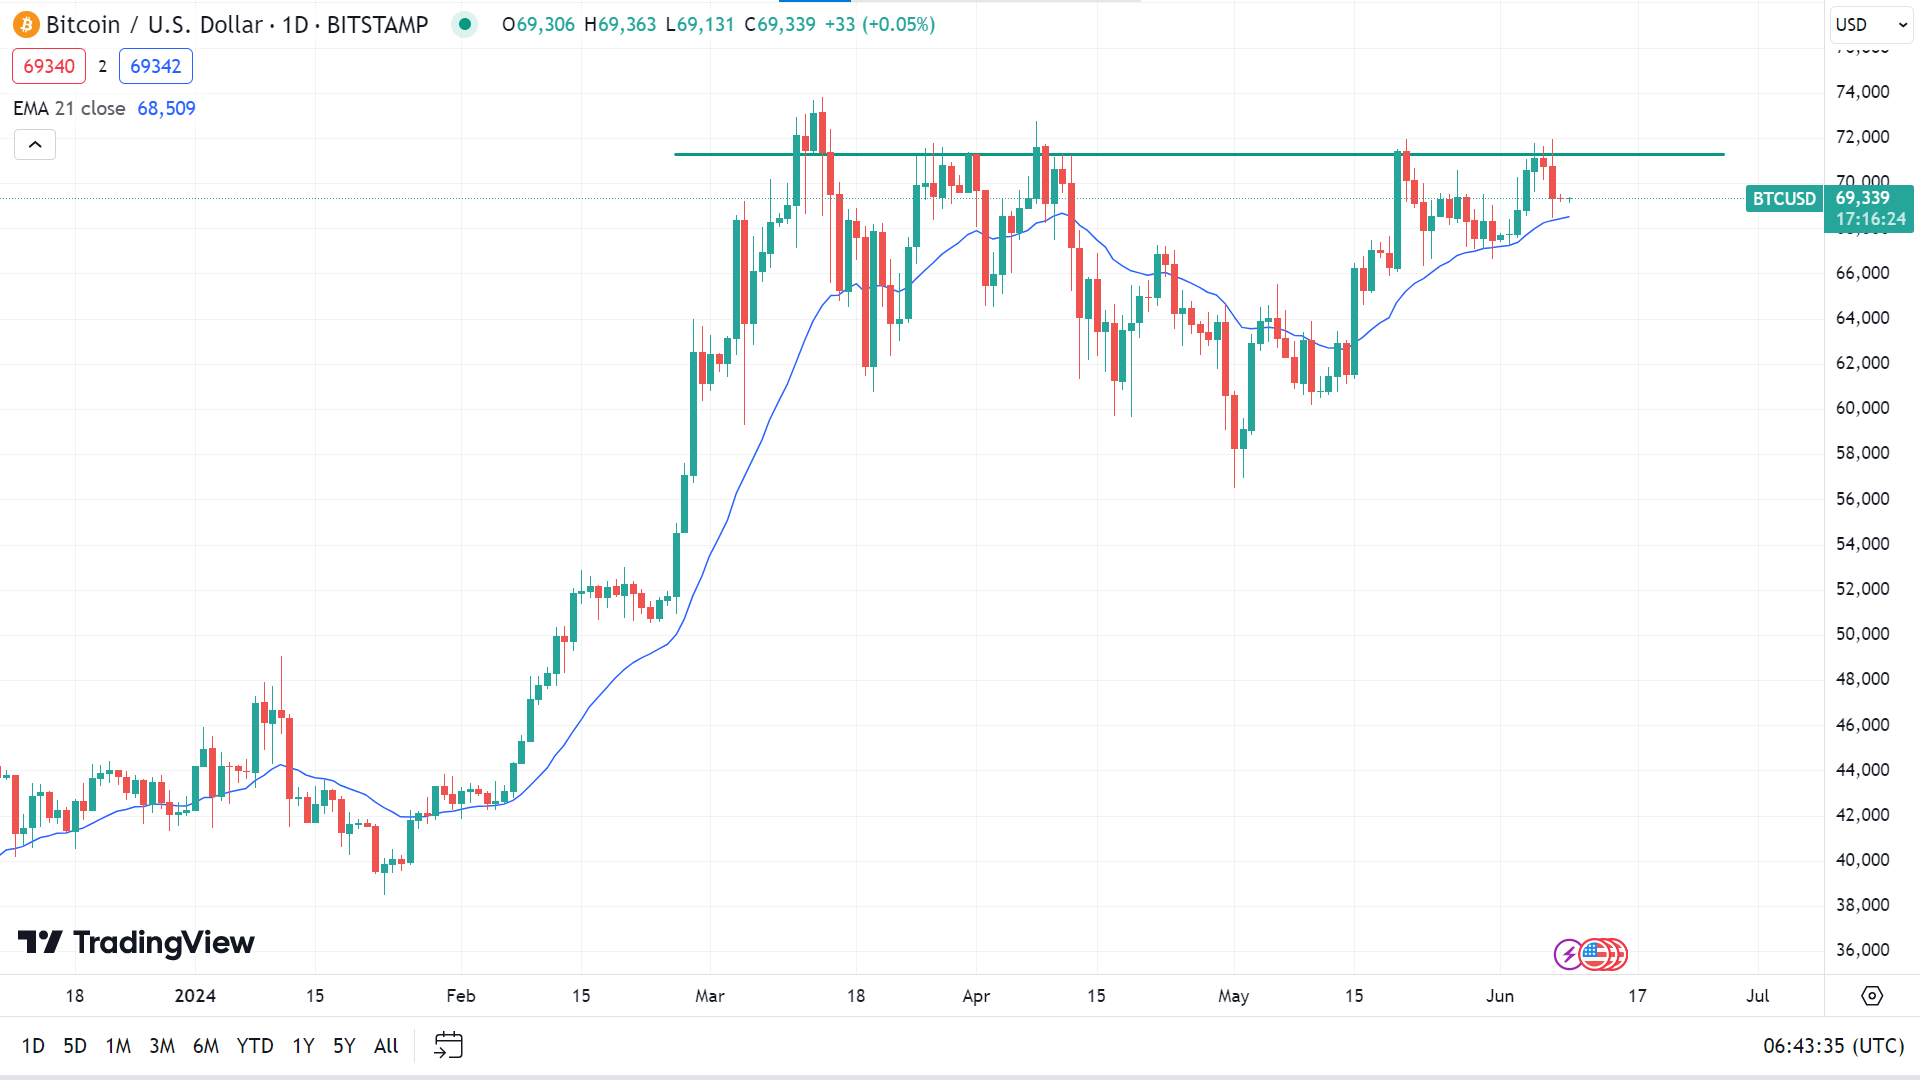
On the daily chart, the price is floating above the EMA 21 line, declaring bullish pressure on the asset price. Thus, the price may regain its current peak of $71,949, and any breakout can trigger the price to reach the previous ATH of $73,794 or more.
Meanwhile, the price returns from the resistance of $71,275, so if the price declines below the EMA 21 line, it can drop to the primary support of $67,158, followed by the next support near $64,615.
Ethereum (ETHUSD)
Fundamental Perspective
Following the announcement that Hong Kong will permit issuers to incorporate staking features into their spot ETH ETFs, Ethereum (ETH) experienced a decline of over 3% on Friday. ProShares submitted a 19b-4 application to the SEC for a spot ETH ETF on Thursday, which coincided with this development.
Yat Siu, co-founder and Executive Chairman of Animoca Brands, has reported that Hong Kong asset managers are integrating staking features into their spot Ethereum ETFs.. Despite the initial enthusiasm that Hong Kong crypto ETFs elicited, they have encountered difficulty in attracting investors. Nevertheless, the inclusion of staking rewards could render these ETFs more appealing on a global scale, particularly given that the SEC has stated that staking is not permitted for US spot ETH ETFs.
ProShares' 19b-4 submission signals its intention to issue spot Ethereum ETFs on the NYSE, joining other prospective issuers. On May 23, the SEC approved 19b-4 filings from eight issuers, including Van Eck, Bitwise, BlackRock, Fidelity, Franklin Templeton, Invesco & Galaxy, Grayscale, and 21Shares. These issuers have since submitted updated S-1 registration statements requiring SEC approval before the ETFs can launch.
SEC Chair Gary Gensler noted that the timing for the launch of spot ETH ETFs will depend on how issuers respond to the SEC's comments on their S-1 filings.
Ethereum Price Prediction Technical Perspective
The last weekly candle closed with a red body and wicks on both sides, reflecting confusion among investors as the previous two weeks. The price declined only a little from the gain of the week before, leaving optimism for buyers that the bull run has yet to fade. So, the next candle can be another green one.
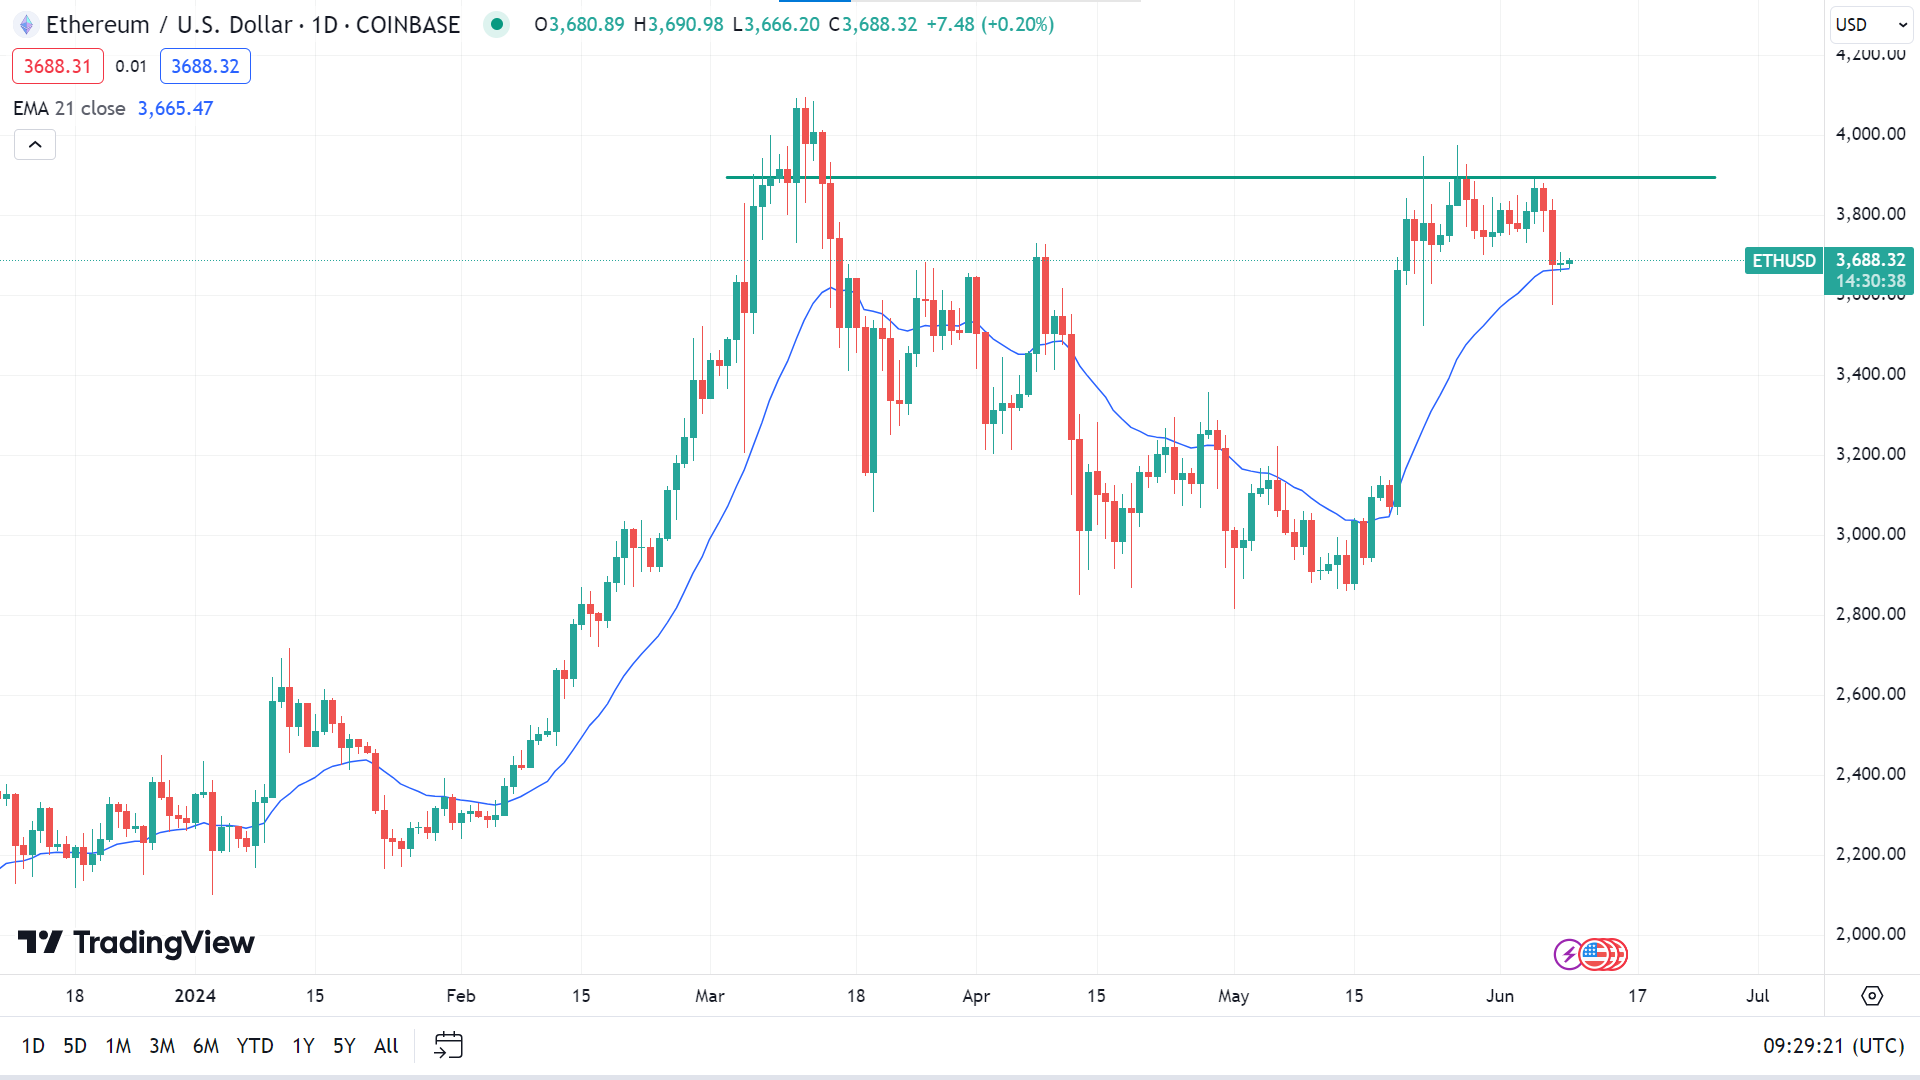
On the daily chart, the price is floating at the EMA 21 line, declaring positive price pressure. So, the price may regain the current resistance of $3894.25, and any breakout can trigger the price to the next resistance near $4093.88.
However, if the price declines below the EMA 21 line, it can drop to the primary support of $3417.82, followed by the next support near $3285.48.
Gold (XAUUSD)
Fundamental Perspective
The week began with a robust performance of gold (XAUUSD), supported by a significant decrease in the yields of US Treasury bonds. Nevertheless, its upward trajectory was moderated by China's first-time pause in gold purchases in 18 months and the positive employment data from the United States. The trajectory of gold is expected to be considerably influenced by the Federal Reserve's (Fed) monetary policy announcements and the upcoming release of the US inflation report in the upcoming week.
The US Dollar (USD) was under downward pressure on Monday, facilitating the upward movement of gold. The ISM Manufacturing PMI's decrease from 49.2 in April to 48.7 in May indicated a more severe contraction in manufacturing activity. A decrease in the Prices Paid Index from 60.9 to 57 indicated milder input inflation.
According to Reuters on Friday, the People's Bank of China (PBoC) discontinued gold purchases in May after 18 consecutive months. This development resulted in XAUUSD falling below $2,340 and erasing most of its weekly gains. The BLS subsequently reported that nonfarm payrolls increased by 272,000 in May, considerably higher than the consensus estimate of 185,000. This resulted in a rise in US T-bond yields and a decline in gold of over 2%.
Investors are closely monitoring the revised Summary of Economic Projections (SEP), as the Federal Reserve is anticipated to maintain its policy rate on Wednesday. According to the CME FedWatch Tool, there is a nearly 55% likelihood of a 50 basis point rate reduction this year.
No noteworthy macroeconomic data releases are scheduled for the latter half of the week in the United States. Following Thursday's conclusion of the Federal Reserve's embargo period, market participants will closely monitor officials' statements.
Gold Price Prediction Technical Perspective
The last weekly candle finished as a hammer with a red body and long upper wick, posting three consecutive losing weeks. This left room for bearish continuation and indicated that the next candle would be another red one.
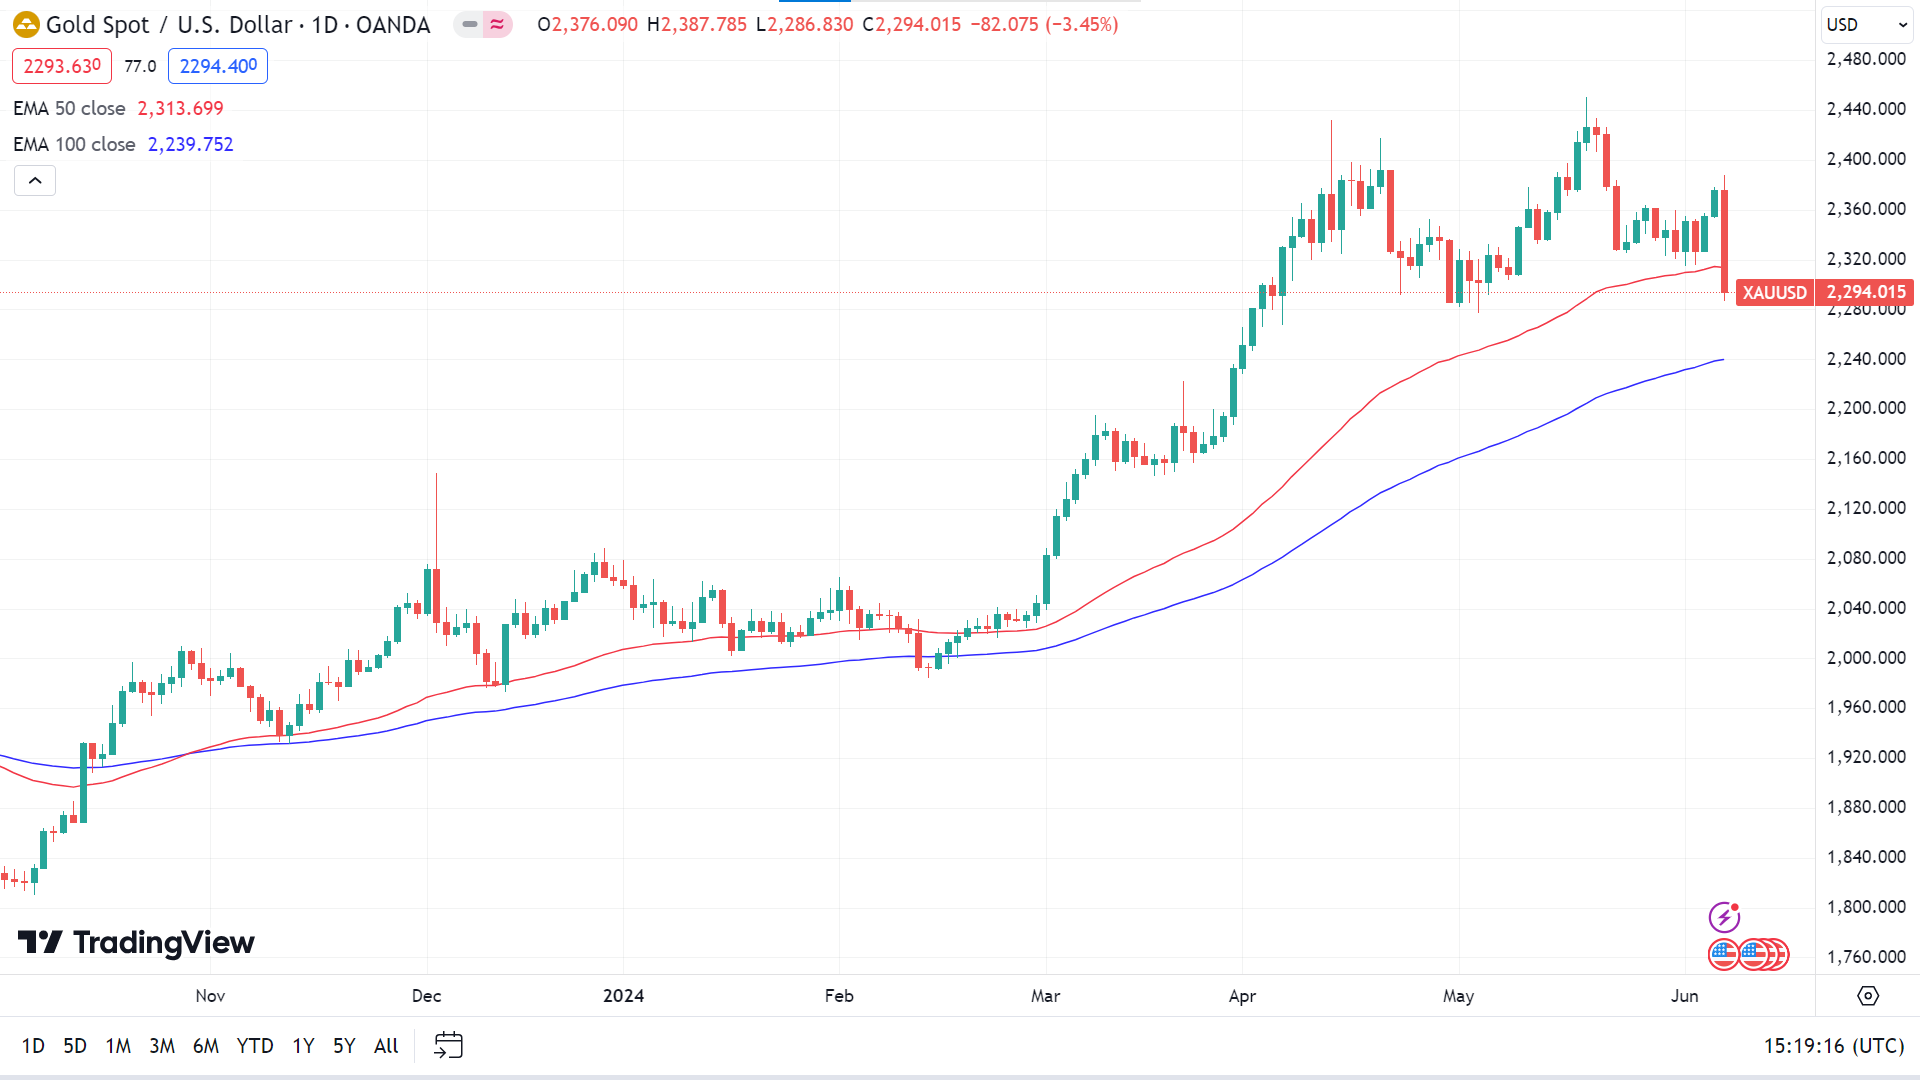
The price rapidly crossed the EMA 50 line below, reflecting significant bearish pressure on the asset price. However, the price is still above the EMA 100 line, confirming the bullish long-term trend. So, if the price surpasses the EMA 50 line, it can regain the current peak of $2387.78 or beyond near the next resistance of $2450.12.
On the other hand, if the current bearish pressure remains intact in the upcoming days, the price can drop to the EMA 100 line near $2239.14 or below that level toward the following support near $2177.37 before climbing to seek a new top.
Tesla Stock (TSLA)
Fundamental Perspective
Elon Musk and the Tesla board are facing a shareholder lawsuit over Musk's sale of $7.5 billion worth of Tesla shares in late 2022, just before a disappointing January 2023 sales report caused the stock to plunge. Musk sold 41.5 million shares between November 4 and December 12 to fund his recent acquisition of Twitter. This sale followed an October 19 earnings call where Musk assured investors of strong Q4 demand. However, Tesla’s fourth-quarter sales were weaker than expected, resulting in a 12% stock drop.
Shareholder Michael Perry's lawsuit alleges Musk profited from insider information and demands he return the profits and cover Perry's legal fees. The suit claims Musk was aware of the impending weaker sales report, as indicated by Tesla’s price cuts in China starting October 24. Before acquiring Twitter, Musk rarely sold Tesla shares outside of prearranged schedules. However, from April to December 2022, he sold $22.9 billion worth to fund the $44 billion acquisition.
Despite rebounding and more than doubling in value in 2023, Tesla shares have struggled this year, losing 29% year-to-date. The lawsuit, filed in Delaware Chancery Court, comes as Tesla seeks shareholder approval to restore Musk’s stock options, previously revoked by a January court decision. Two advisory firms have urged shareholders to vote against Musk’s controversial pay package due to concerns over his numerous side projects.
Tesla Stock Forecast Technical Perspective
The weekly candle closed as a doji, posting three doji in a row, reflecting investors' indecision. So, the next candle can be either green or red.
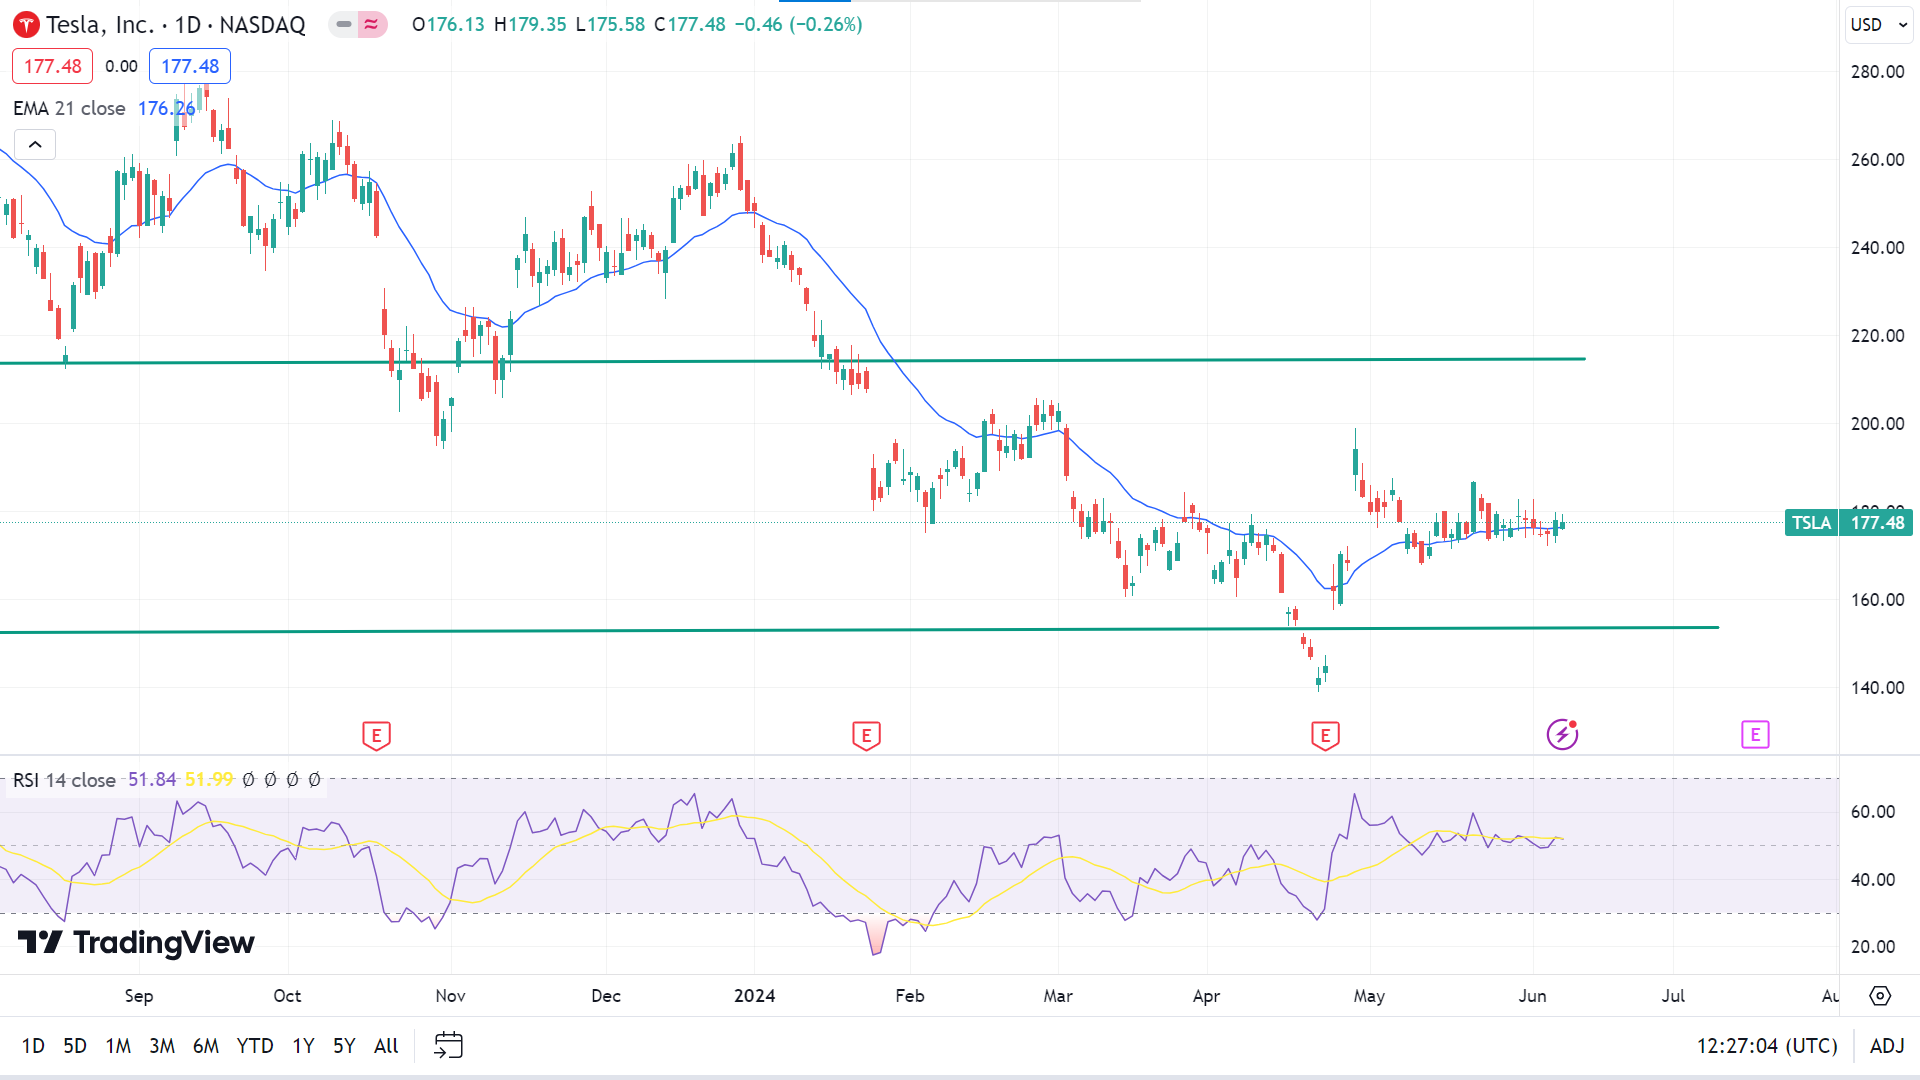
On the daily chart, the price sticks to the EMA 21 line, and the RSI reading floats along with the midline, enabling room for buyers to see the price at the current resistance near $186.88, followed by the next resistance near $198.87.
On the negative side, if the price drops below EMA 21 and the RSI reading dives into negative territory, it can return to the nearest support of $170.23. Hence, the next support is $165.55.
Nvidia Stock (NVDA)
Fundamental Perspective
Nvidia's stock will begin trading on a split-adjusted basis on Monday, following a 27% surge since announcing a 10-for-1 split on May 22. Art Hogan, chief market strategist at B. Riley Wealth, argues that the impact of a stock split is largely psychological. Investors tend to favor a lower stock price, driven by a "muscle-memory" reaction, even though this isn’t based on fundamental or technical factors.
Nvidia's recent rise is due to strong earnings, a shift towards chip stocks, and its unique profitability from artificial intelligence. Although partial shares have made high-priced stocks more accessible, companies still cite splits to broaden their investor base. Walmart’s recent split aimed to make shares more affordable for employees, resulting in a 6% rise, while Apple’s 2020 split led to a nearly 30% increase.
Hogan explains that lower stock prices make options trading more accessible, as options are priced in blocks of 100 shares. It enhances investment opportunities and liquidity. Moreover, splitting a stock can facilitate inclusion in the Dow Jones Industrial Average, which is price-weighted, thus increasing a company's legitimacy and appeal to a broader range of investors.
Ultimately, the psychological impact of stock splits continues to drive investor behavior, a trend Hogan has observed throughout his 30-year career. This phenomenon underscores how perception can often outweigh technical and fundamental considerations in the market.
Nvidia Stock Forecast Technical Perspective
The last candle on the weekly chart finished as a solid green candle after a doji candle, indicates active bullish pressure on the asset price. The next candle will most likely be another green one.
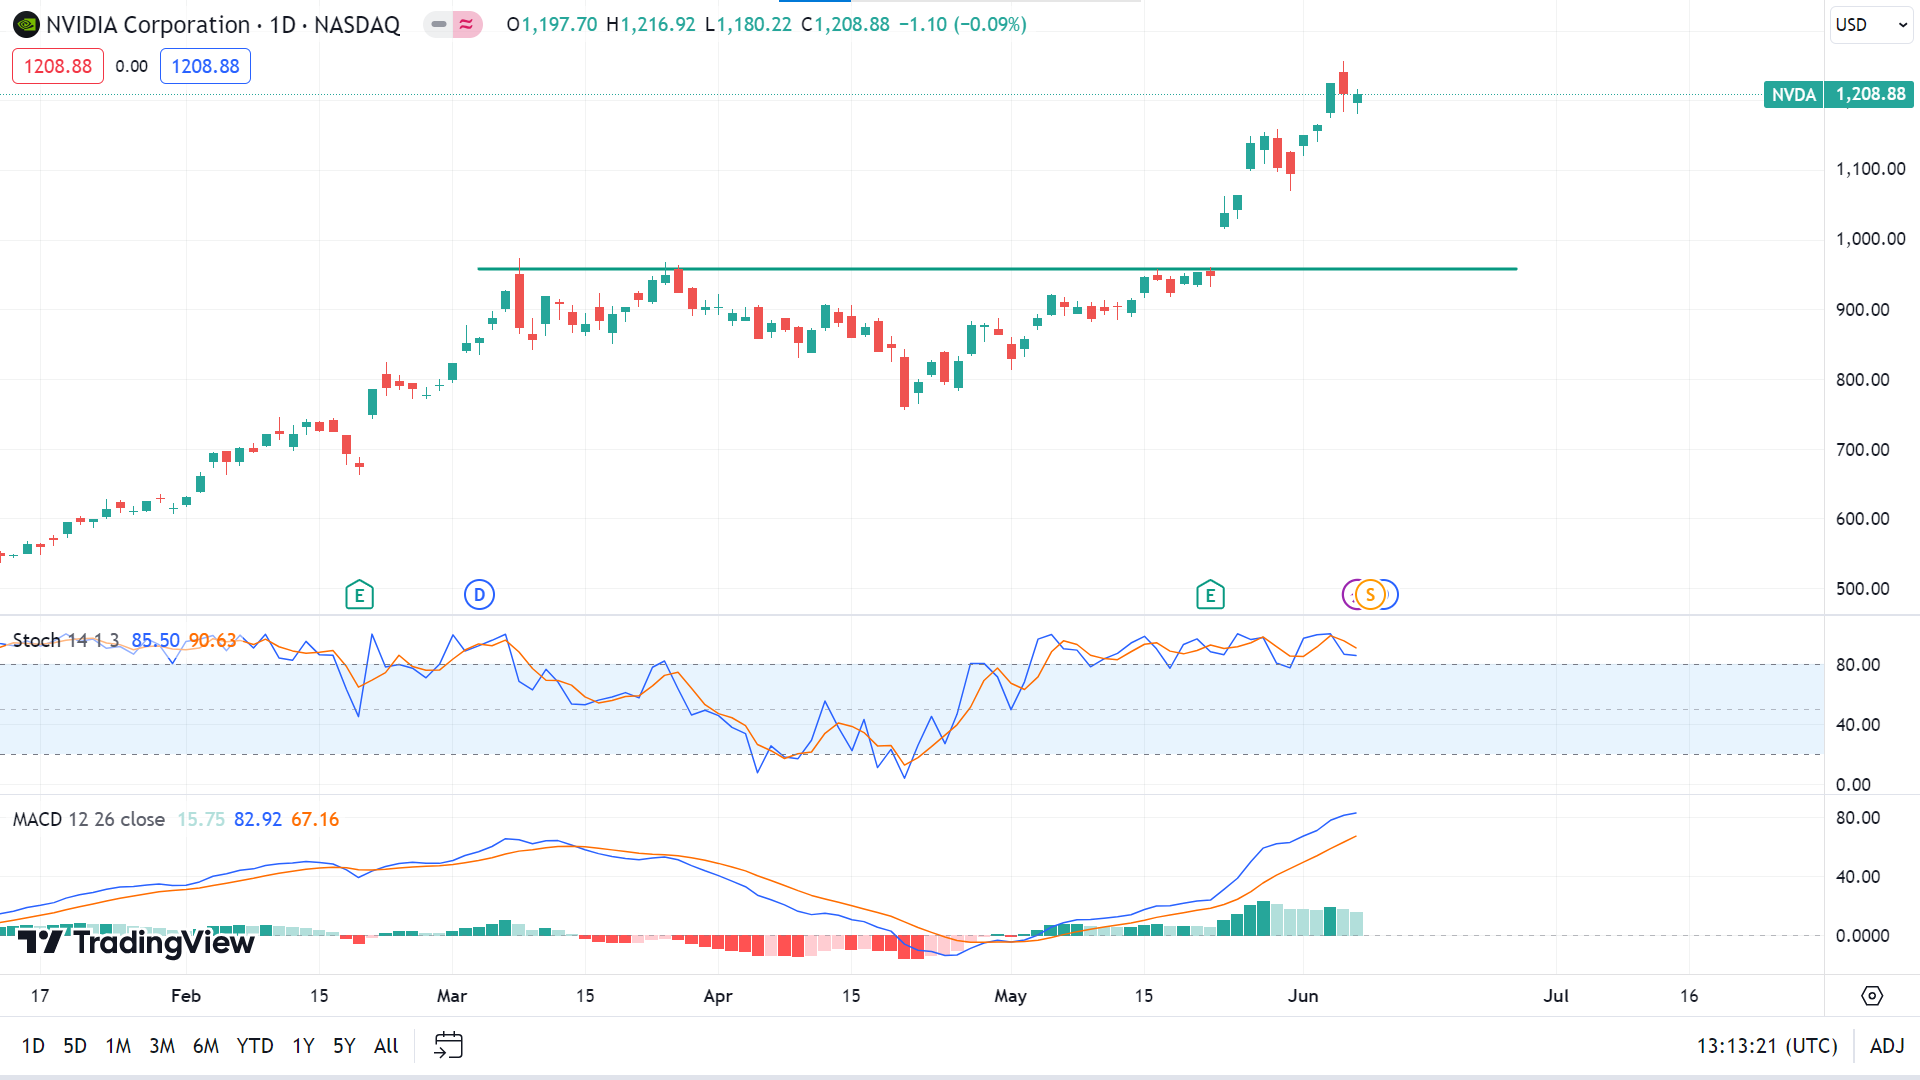
On the daily chart, the price returns after creating an ATH of $1255.87, and the MACD indicator reading signals significant bullish pressure. In contrast, the Stochastic signal lines form a bearish crossover at the overbought area. According to the MACD indicator suggestion, the price can reach the nearest resistance of $1368.00 if it surpasses the recent peak, followed by the next resistance of $1713.65.
Meanwhile, on the downside, the price can return to the nearest support of $1155.23, followed by the next support of $1098.60, as the Stochastic Indicator suggests some downward pressure by creating a bearish crossover. Then, the MACD indicator readings will be readjusted according to the circumstances of the market movement.
WTI Crude Oil (USOUSD)
Fundamental Perspective
West Texas Intermediate (WTI) oil prices have extended their gains for the third consecutive session, trading around $75.50 per barrel during the Asian session on Friday. This upward momentum is attributed to growing speculation that the US Federal Reserve (Fed) may cut interest rates in September, following a 25-basis point reduction by the European Central Bank (ECB) on Thursday.
A Reuters poll between May 31 and June 5 indicated that nearly two-thirds of economists expect a Fed rate cut in September. Additionally, the CME FedWatch Tool suggests the probability of a September rate cut has surged to almost 70%, up from 51% a week earlier.
Weak US employment data has bolstered hopes for two Fed rate cuts this year. The ADP US Employment Change report indicated only 152,000 new workers were added to payrolls in May, the lowest in four months and well below the forecast of 175,000. Initial jobless claims rose by 8,000 to 229,000 for the week ending May 31, surpassing market expectations and marking the highest reading since early May's eight-month high of 232,000.
Meanwhile, the Organization of the Petroleum Exporting Countries and its allies (OPEC+) have agreed to extend most supply cuts into 2025. According to Reuters, voluntary cuts from eight member countries will gradually be unwound starting in October, with over 500,000 barrels per day (bpd) expected to re-enter the market by December and a total of 1.8 million bpd by June 2025.
Oil Prices Forecast Technical Perspective
The last weekly candle closed as a hammer with a red body and lower wicks, posting three consecutive losing weeks, besides leaving hope for buyers. The next candle can be another red one.
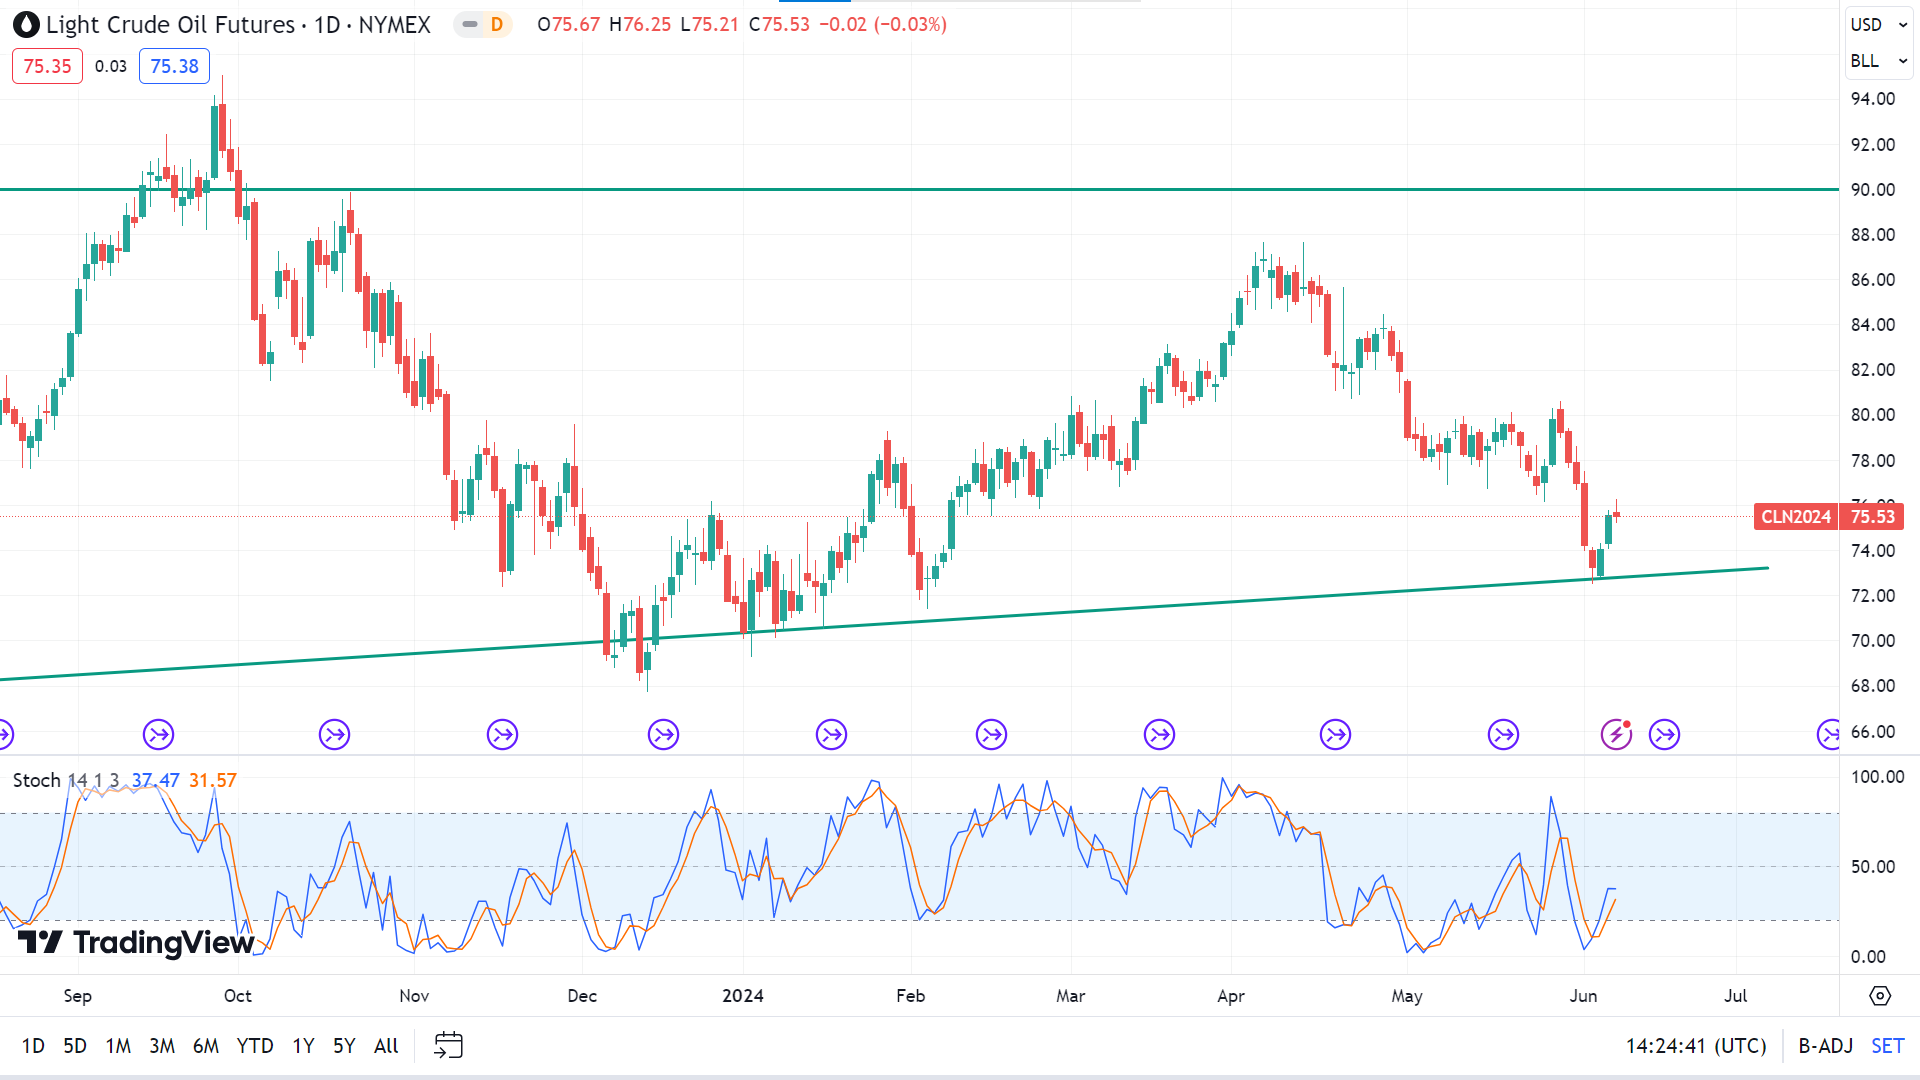
On the daily chart, the Stochastic indicator reading shows fresh bullish pressure on the asset price. The signal lines of the indicator window create a fresh, bullish crossover and start moving upward, indicating the price may head to the primary support of $80.28, followed by the next resistance near $84.46.
Meanwhile, as the Stochastic indicator signal lines are still floating below the midline, in negative territory, there is still room for the price to decline at the nearest support of $74.89 when the next support is near $72.82.


