
EURUSD
Fundamental Perspective
The EURUSD pair faced a challenging week, closing with modest losses around the 1.0840 mark. The US Dollar gained some ground, bolstered by the Fed's minutes, which revealed no rush to cut rates and suggested possible further tightening, spurring temporary risk aversion. Positive economic data, including a decline in Initial Jobless Claims and robust PMI readings, also supported the positive movement. However, despite these gains, speculation around delayed Fed rate cuts limited substantial Dollar advances.
Conversely, the Euro struggled to capitalize on the Dollar's relative weakness. Encouraging local data, such as rising German business activity and a stronger Eurozone economic recovery indicated by the HCOB's PMI, was overshadowed by the European Central Bank's dovish outlook. With a June rate cut fully priced in and uncertainty about future cuts, speculative interest in the Euro waned. Despite improved Eurozone consumer confidence and stable German GDP growth, the Euro couldn't rally.
Inflation data from the US and EU will be crucial in shaping market expectations alongside central bank communications. This interplay between the Fed's cautious stance and the ECB's dovish approach will continue to influence the movements of the EUR/USD pair as investors seek more precise signals on both regions' economic health and policy directions.
EURUSD Forecast Technical Perspective
On the weekly chart, the last candle finished as a bearish hammer after several consecutive gaining weeks, signaling a pause. So, there is a strong possibility that the next candle can be another green one.
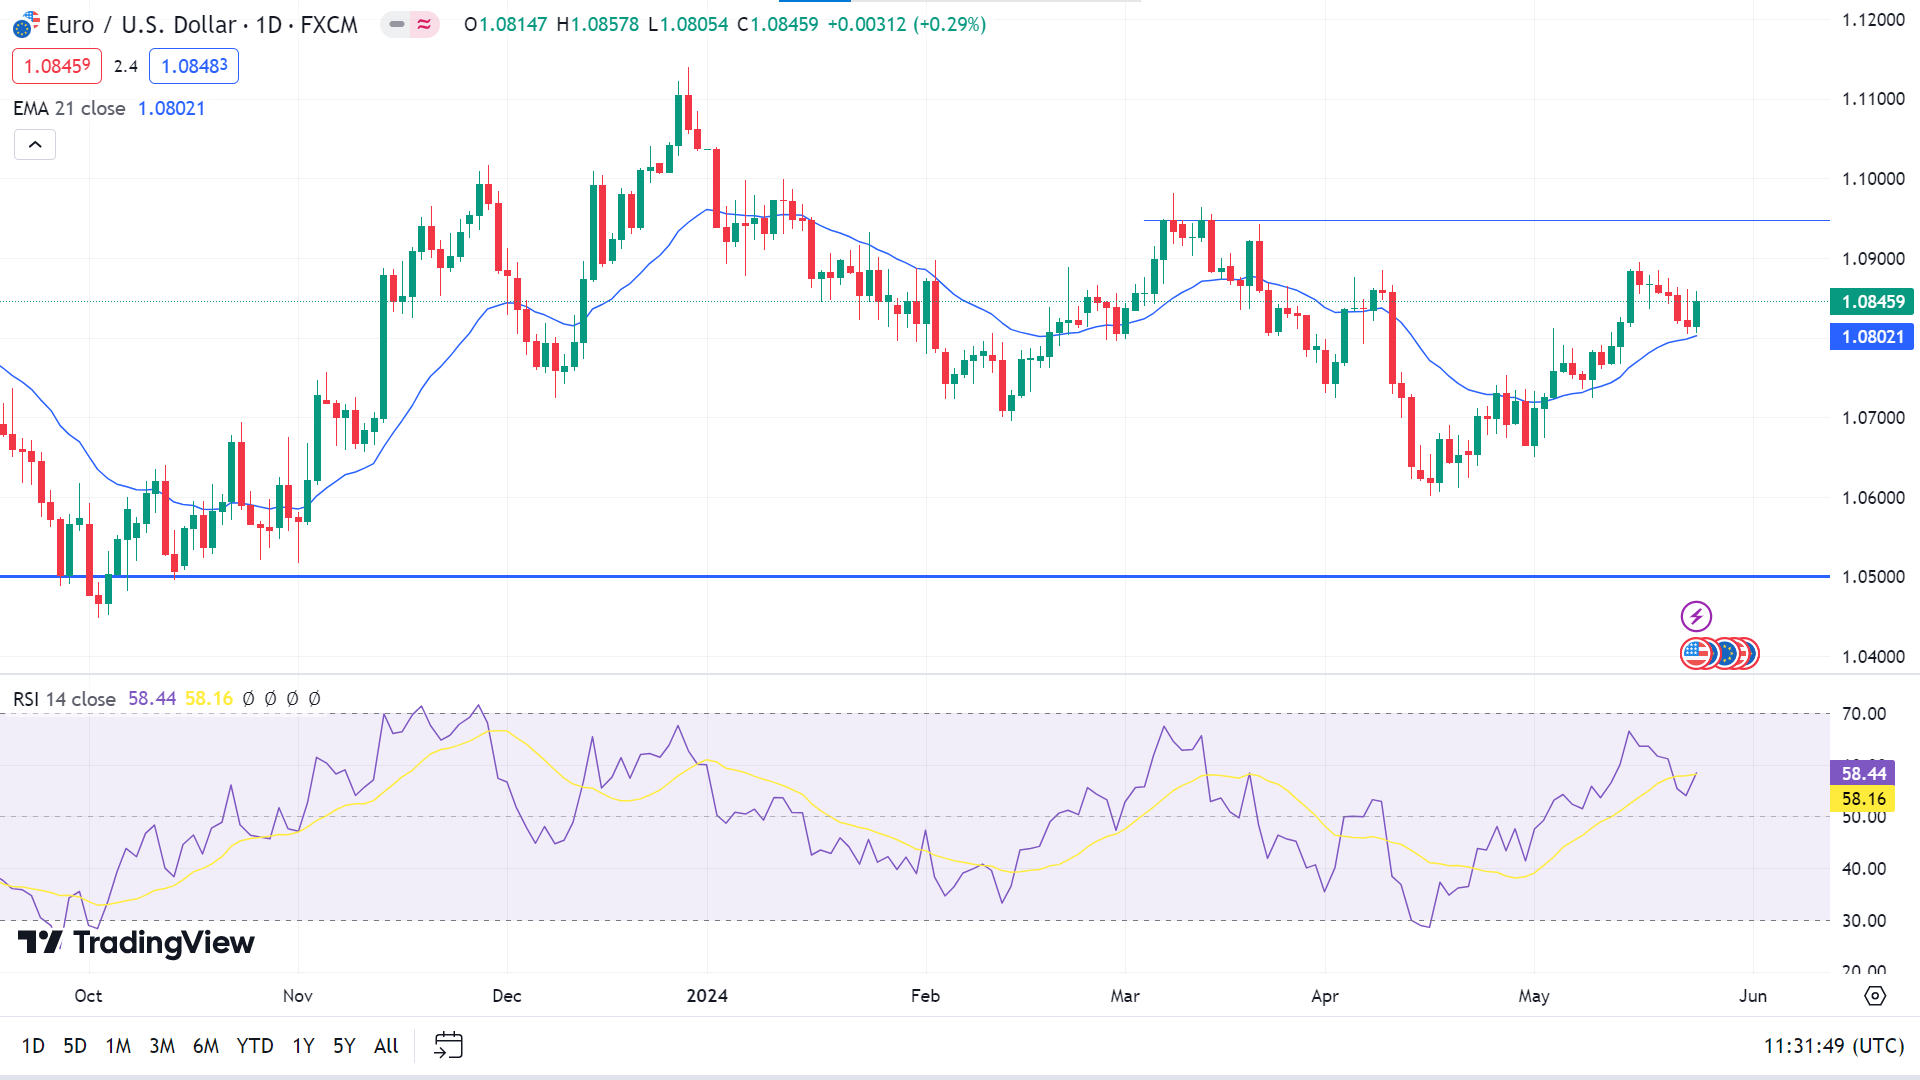
The price hovers above the EMA 21 line on the daily chart, and the RSI indicator readings remain neutral, floating just above the 50 line, indicating positive pressure on asset price. Based on this, the price may head toward the primary resistance near 1.0945, followed by the next resistance near 1.1117.
Meanwhile, a price below the EMA 21 line and the RSI reading's decline slope below the 50 line will indicate bearish pressure initiation and a decline toward the primary support of 1.0725, followed by the next 1.0612.
GBPJPY
Fundamental Perspective
The Pound Sterling (GBP) secured minor gains against the Japanese Yen, last week, where the sentiment came from the hawkish Bank of England (BoE). This renewed demand for the US Dollar partially counterbalanced the optimism surrounding the British Pound.
Monday's holiday-thinned trading kept the GBPJPY neutral. However, a hotter-than-expected UK Consumer Price Index (CPI) report on Tuesday fueled a fresh advance for the Pound. The Office for National Statistics (ONS) reported inflation fell to 2.3% in April from 3.2% in March, surpassing market expectations of a slowdown to 2.1%. Services inflation also declined to 5.9% year-over-year, compared to 6.0% in March and the forecasted 5.4%.
GBPJPY Forecast Technical Perspective
On the weekly chart, the last candle closed in solid green, posting three consecutive gaining weeks and declaring a significant bullish force on the asset price. So, the next candle can be another green one.
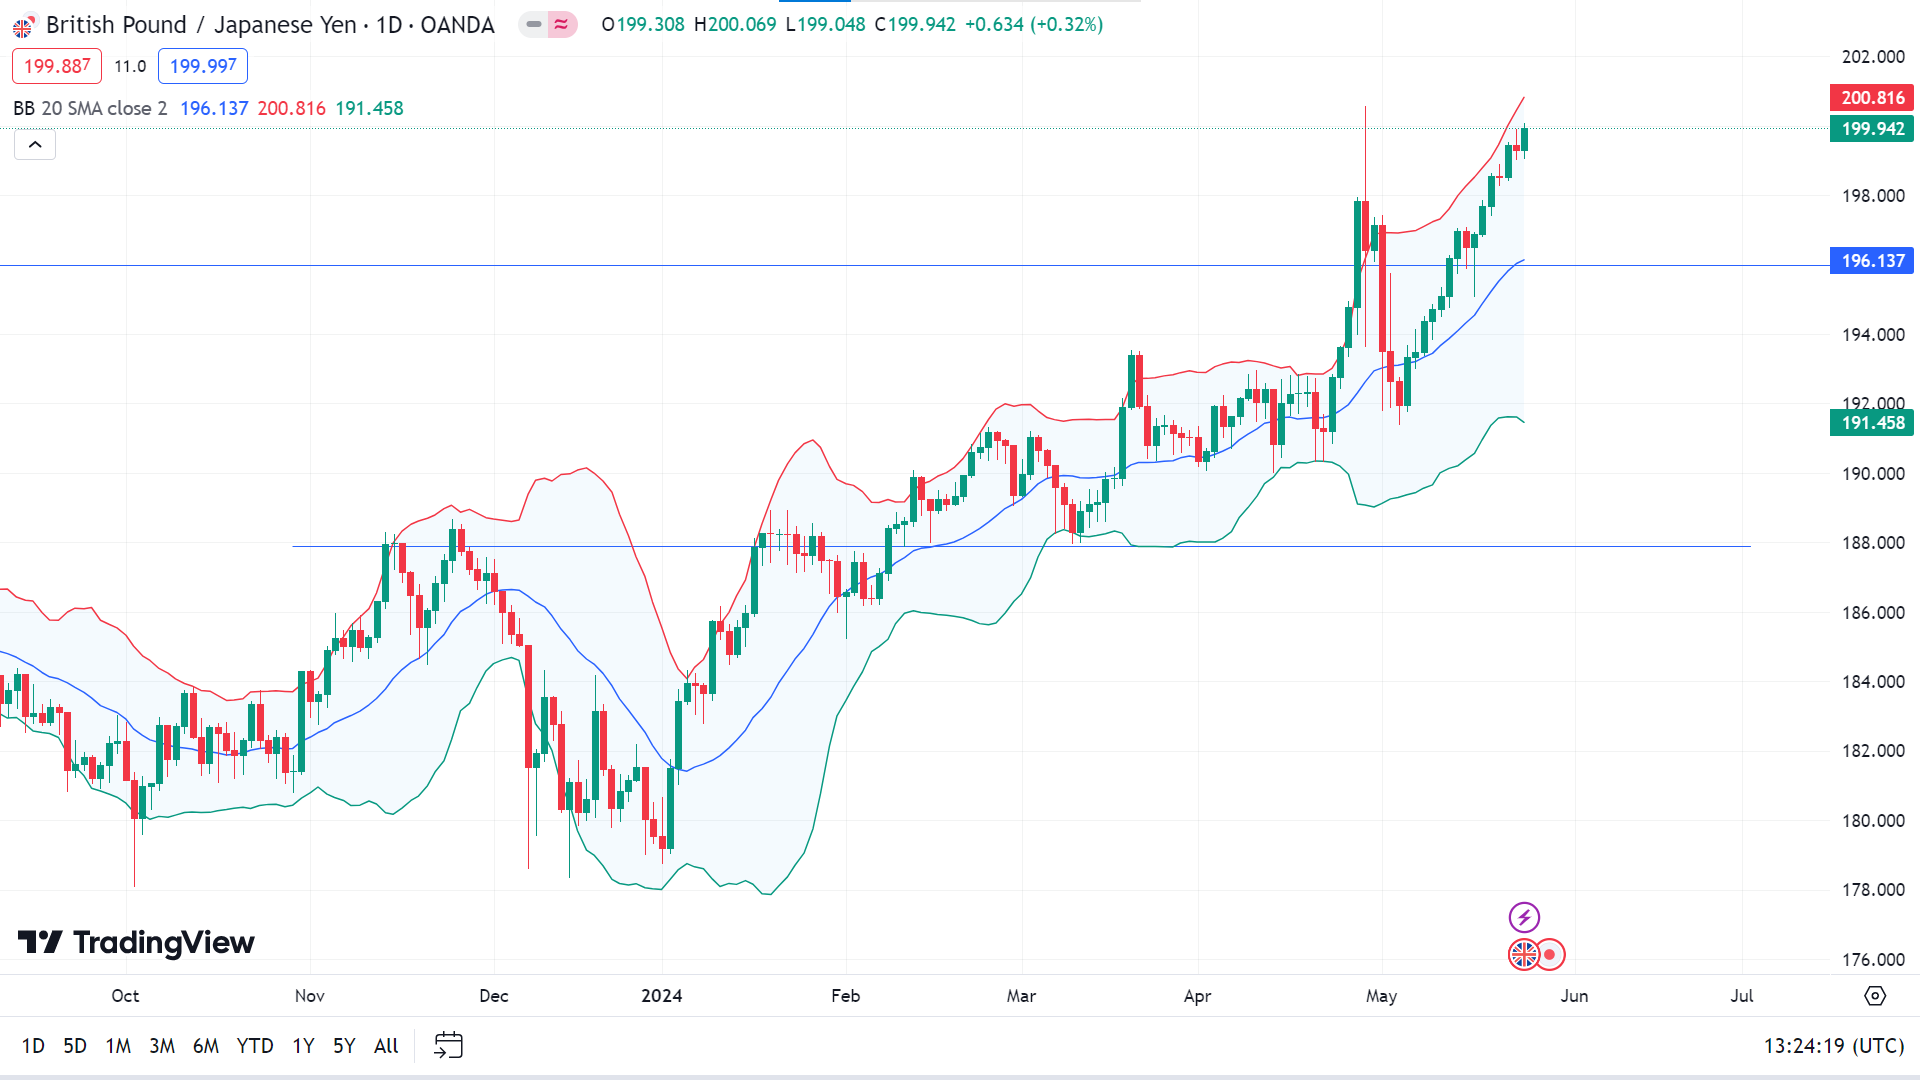
On the daily chart, the price hovering just below the 200.00 mark, moving on the upper channel close to the upper band of the Bollinger bands, suggests bullish pressure on the asset price. So, any breakout above 200.00 can trigger the price to reach the primary resistance near 205.00, following the next resistance near 214.00.
Meanwhile, when the price moves closer to the upper band, it often suggests a decline for correction. So, if the price reaches below the current support of 199.14, it can reach primary support near 198.07, followed by the historical support of 196.00.
NASDAQ 100 (NAS100)
Fundamental Perspective
U.S. stock indexes opened higher on Friday, yet the Dow and S&P 500 seemed poised to end their four-week winning streak as inflation concerns reignited caution over monetary policy ahead of the long weekend. In contrast, the tech-heavy Nasdaq was set to gain 0.8% for the week, boosted by Nvidia's stellar quarterly results, which bolstered investor confidence in Big Tech's AI investments.
Thursday's session saw all three major indexes decline due to economic data indicating rising price pressures, dampening hopes for interest rate cuts this year. Nevertheless, Nvidia's performance stood out. "The shift for investors now goes back to the Fed," remarked Kim Forrest, chief investment officer at Bokeh Capital Partners, following a strong earnings season and Nvidia's optimistic forecasts.
Data from the U.S. Census Bureau revealed a 0.7% rise in April durable goods orders, surpassing the anticipated 0.8% decline. Additionally, the University of Michigan's final consumer sentiment index for May exceeded expectations, reaching 69.1 versus the forecasted 67.5.
Goldman Sachs adjusted its projection for the first rate cut from July to September. Meanwhile, Nvidia shares rose 0.3% after a 9% surge the previous day, adding approximately $218 billion to its market value.
The U.S. equity market will be closed on Monday for Memorial Day. For the week ending May 22, U.S. equity funds saw substantial inflows of $9.9 billion, driven by optimism over strong corporate earnings. It is significantly up from $4.1 billion the previous week.
Technical Perspective
The last weekly candle closed solid green, posting five consecutive gaining weeks, declaring buyers' domination on the asset price and leaving hope for buyers. So, the next candle can be another green one.
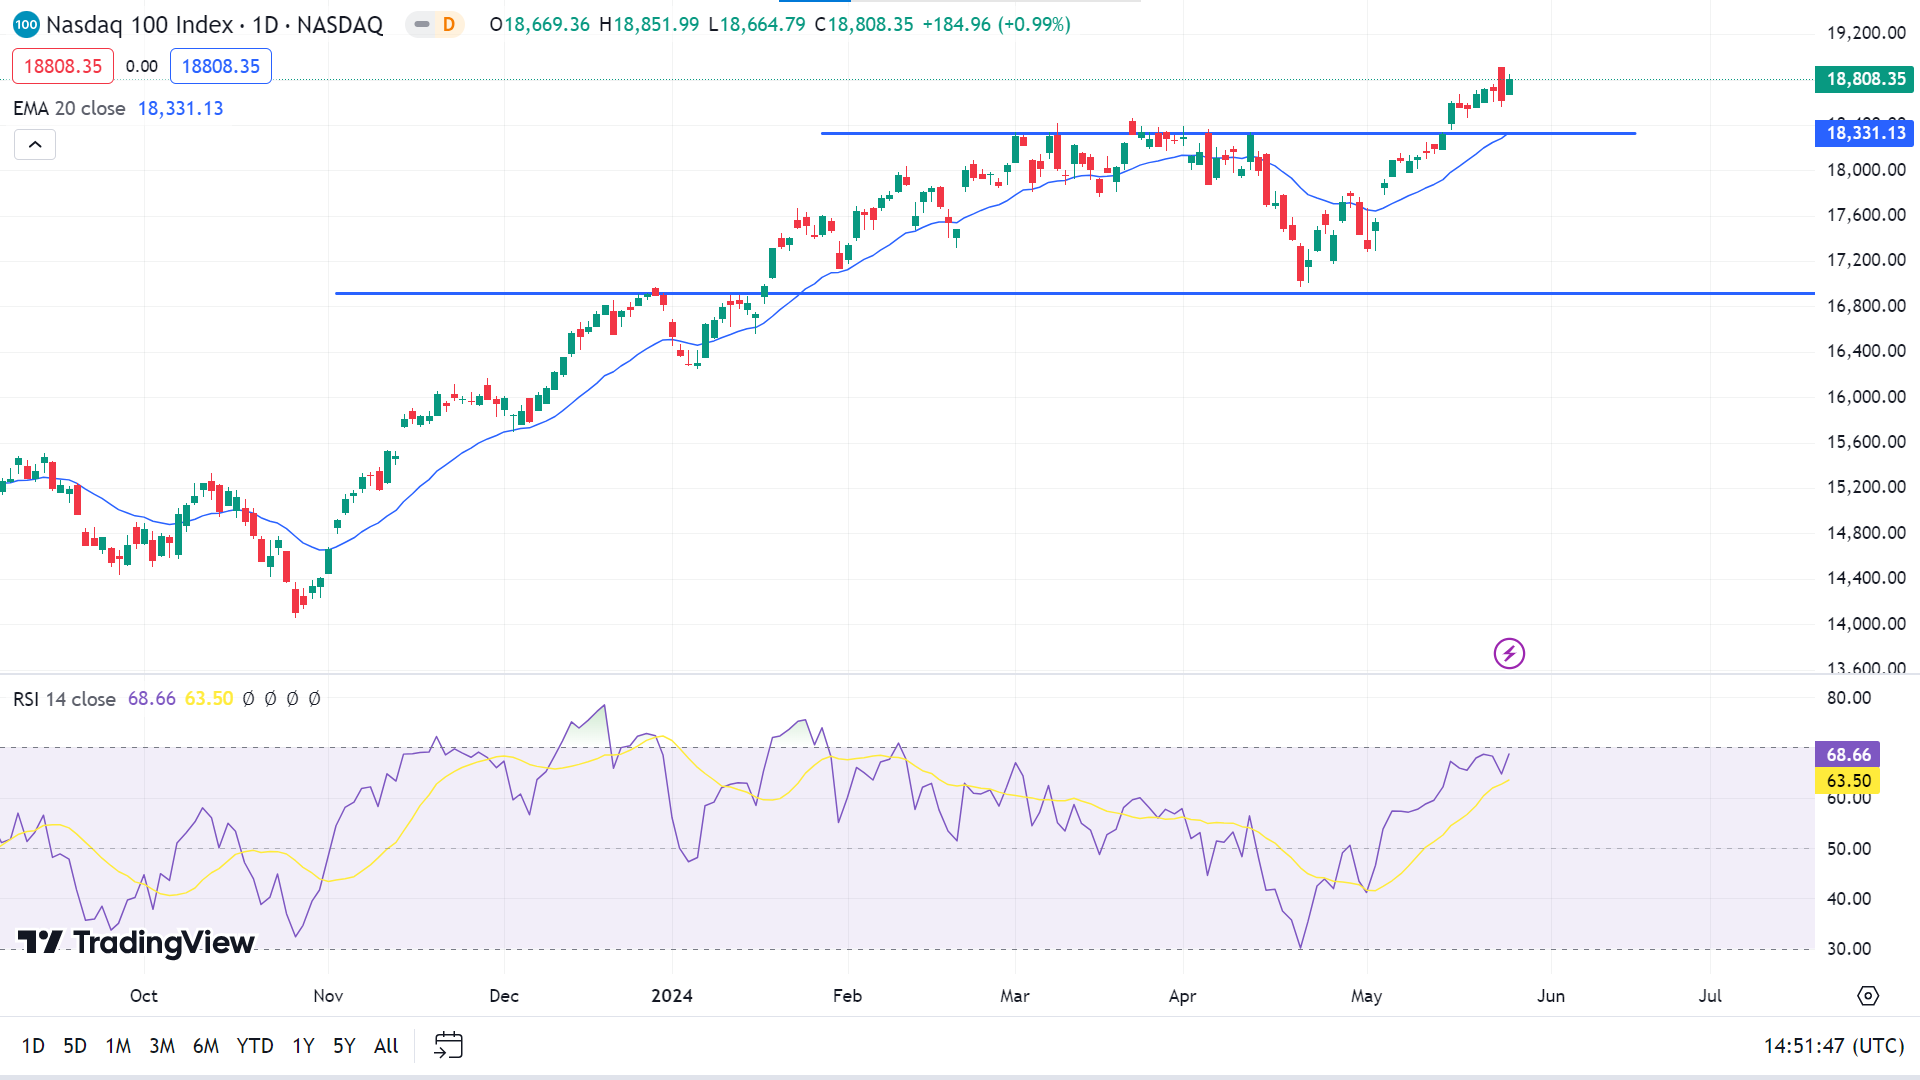
On the daily chart, the price breaks above the dynamic resistance of $18,331.13 and hovers above the EMA 21 line, just below the ATH of $18,554.89. It signals that bulls are in play, while the Stochastic reading remains neutral. The price may head to create a new high above the current ATH.
Meanwhile, on the bearish side, the price can return toward the primary support of $18331.13 before moving further up, as the Stochastic reading is still neutral. If the price reaches below this level, it can decline further toward the next support of $17,786.32.
S&P 500 (SPX500)
Fundamental Perspective
The Standard & Poor's 500 index eked out modest gains this week, propelled by technological and communication service advances, offsetting declines elsewhere.
Investors grappled with conflicting economic signals. A surprising uptick in May's US manufacturing purchasing managers' index contradicted a slight month-over-month dip in consumer sentiment. This paradox prompted a reevaluation of rate cut expectations, with indications of faster-than-anticipated economic activity influencing investor sentiment.
Notably, only the technology and communication services sectors experienced gains this week, with technology rising by 3.4% and communication services by 0.2%. Nvidia notably contributed to the technology sector's upturn, surging 15% following robust fiscal Q1 earnings and sales, while Analog Devices saw an 8.6% increase on stronger-than-anticipated fiscal Q2 results.
Technical Perspective
The weekly chart shows a pause closing the last candle as doji, reaching ATH after four consecutive gaining weeks, leaving optimism for buyers. A doji within an uptrend indicates a possible continuation. So, the next candle can be another green one.
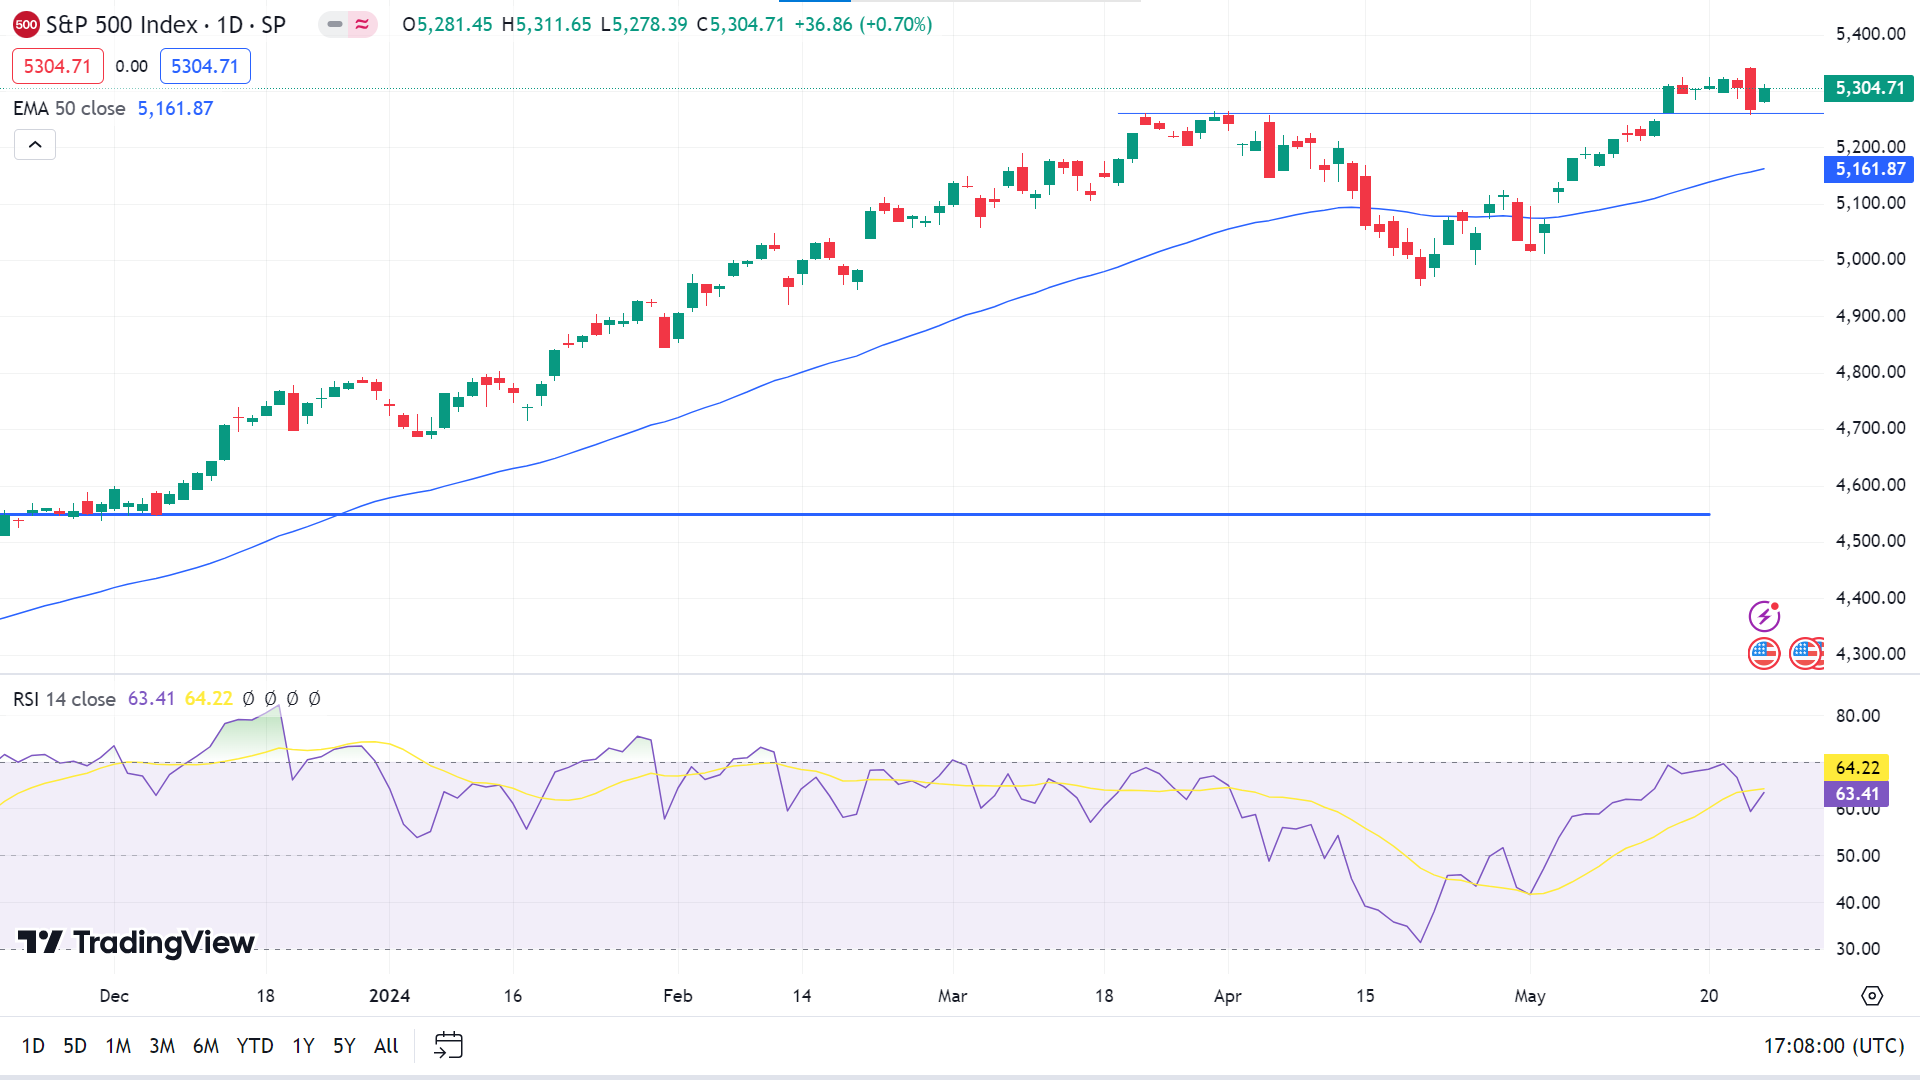
On the daily chart, the price breaks above the previous resistance of $5260.00 and reaches the new ATH near $5342.88, moving above the EMA 50 line. At the same time, the RSI indicator value remains in neutral territory, declaring sufficient bullish pressure on the asset price. So, the price may regain the ATH and head for a new high in the upcoming days.
However, the price can again decline if the RSI signal line slows downside; a decline below $5260.00 can trigger the price to drop to the next support of $5161.87.
Bitcoin (BTCUSD)
Fundamental Perspective
Despite recent struggles, Bitcoin (BTC) is poised to resume its bull rally. Optimism will surge if BTC surpasses a critical hurdle and establishes a strong foothold, potentially driving it to a new all-time high (ATH).
Historically, Bitcoin has shown exceptional performance in the year following each halving event, often exceeding expectations and setting new ATHs. After the 2012 halving, Bitcoin price skyrocketed from $12 to $1,075, an astonishing 8,858% increase. The 2016 halving saw a 294% rise, though the pre-halving rally was equally remarkable. In 2020, despite macroeconomic uncertainties, BTC surged 540% post-halving.
While the trend suggests diminishing returns, it is not linear. The fourth halving in April mirrors the second halving in several ways, with the pre-halving rally in 2016 boosting Bitcoin's price by 141%, similar to the 139% gain recorded in the year leading up to the 2024 halving.
To explore potential outcomes, FXStreet asked Microsoft Co-Pilot to forecast Bitcoin's price 365 days after the fourth halving. Using an average diminishing factor between the first and third halving, Co-Pilot predicted a 281% increase in Bitcoin's price in the 12 months following the 2024 halving.
Based on this projection, Bitcoin's price a year after the fourth halving could reach $187,876, entering six-digit territory.
Bitcoin Price Prediction Technical Perspective
The last weekly candle finished green, two consecutive weeks after reaching exemplary support of $60,000, indicating that bulls are still in play. The next candle will likely be another green one.
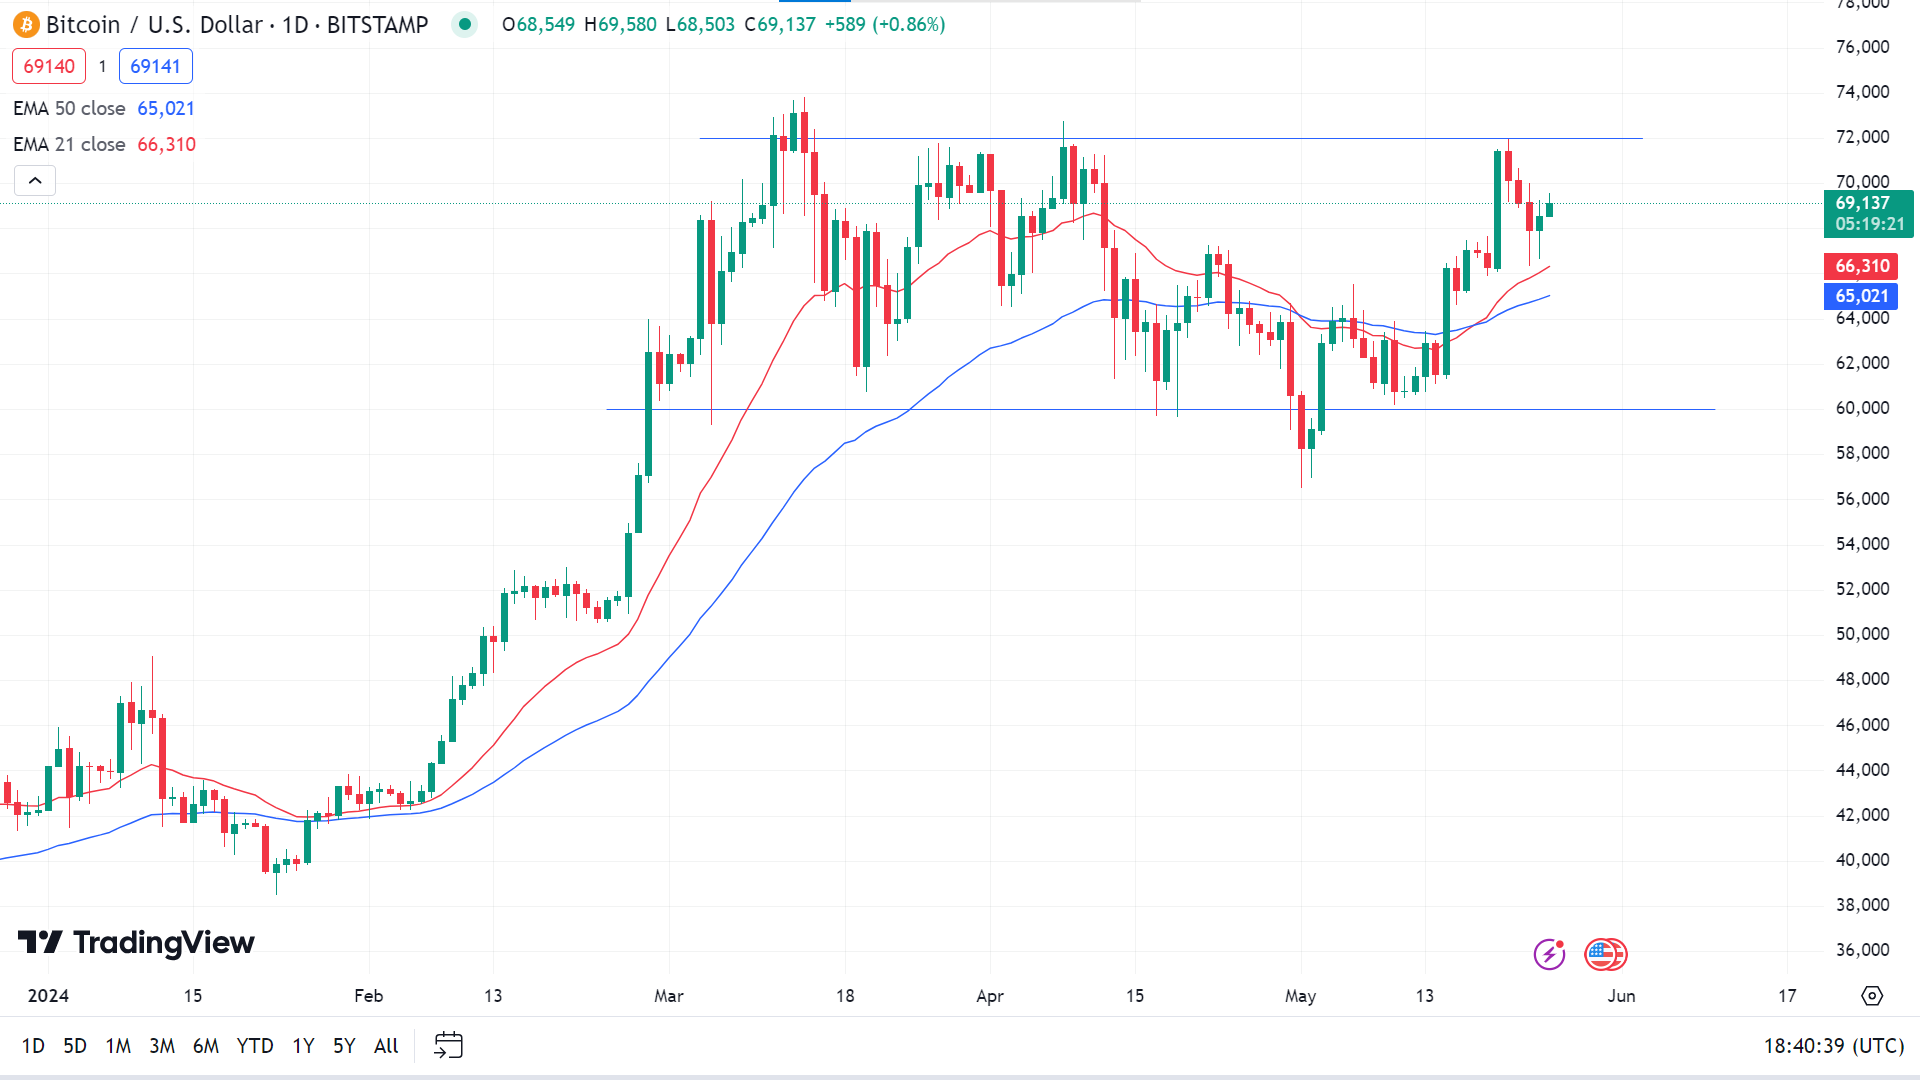
The price remains above the EMA 21 line on the daily chart, declaring bullish pressure. The crossover between EMA 50 and EMA 21 confirms the positive pressure on the asset price. So, the price may hit the current peak of $71,958, and a breakout can trigger the price to get near $73.794 or above.
Meanwhile, the price faced resistance at $71,958; if this resistance is sustained, the price can drop to the primary support of $66,311. If the price reaches below EMA 21, it can decline toward the previous significant support near $60,000. EMA lines will also follow the movement.
Ethereum (ETHUSD)
Fundamental Perspective
The U.S. Securities and Exchange Commission's (SEC) recent approval of spot Ethereum (ETH) products has reignited the debate over whether ETH is a commodity or a security. The SEC's stance on ether remains ambiguous, with Chair Gary Gensler not explicitly stating if ether is a security. However, Consensys claims the agency views ether as a security, while Commodity Futures Trading Commission (CFTC) Chair Rostin Behnam has asserted that ether is a commodity.
The SEC approved 19b-4 forms for eight Ethereum ETFs, though issuers must have their S-1 registration statements effective before trading can start. This move has prompted differing opinions among legal experts about the implications. Paul Grewal, Coinbase's Chief Legal Officer, considers this a significant development, arguing that the S-1 form indicates these funds do not hold more than 40% in securities, suggesting ETH is not a security.
Coy Garrison, former counsel for SEC Commissioner Hester Peirce, concurs, noting the SEC's reference to the funds as "commodity-based trust shares." However, Ashley Ebersole, general counsel at 0x Labs, and Martin Auerbach, of counsel at Withersworldwide, caution that this approval does not definitively categorize either. The SEC might still contend that certain ETH transactions could be securities offerings.
Recent SEC actions suggest that staked ETH, especially when managed by third parties, could be classified as a security. Despite the SEC's recent approvals providing some clarity, the complete regulatory status of ether still needs to be solved, leaving its classification in a state of flux.
Ethereum Price Prediction Technical Perspective
ETHUSD just finished a solid green candle on the weekly chart, two consecutive weeks after sliding from the March high of $4095.40, indicating sufficient bullish pressure on the asset price. So, the next candle can be another green one.
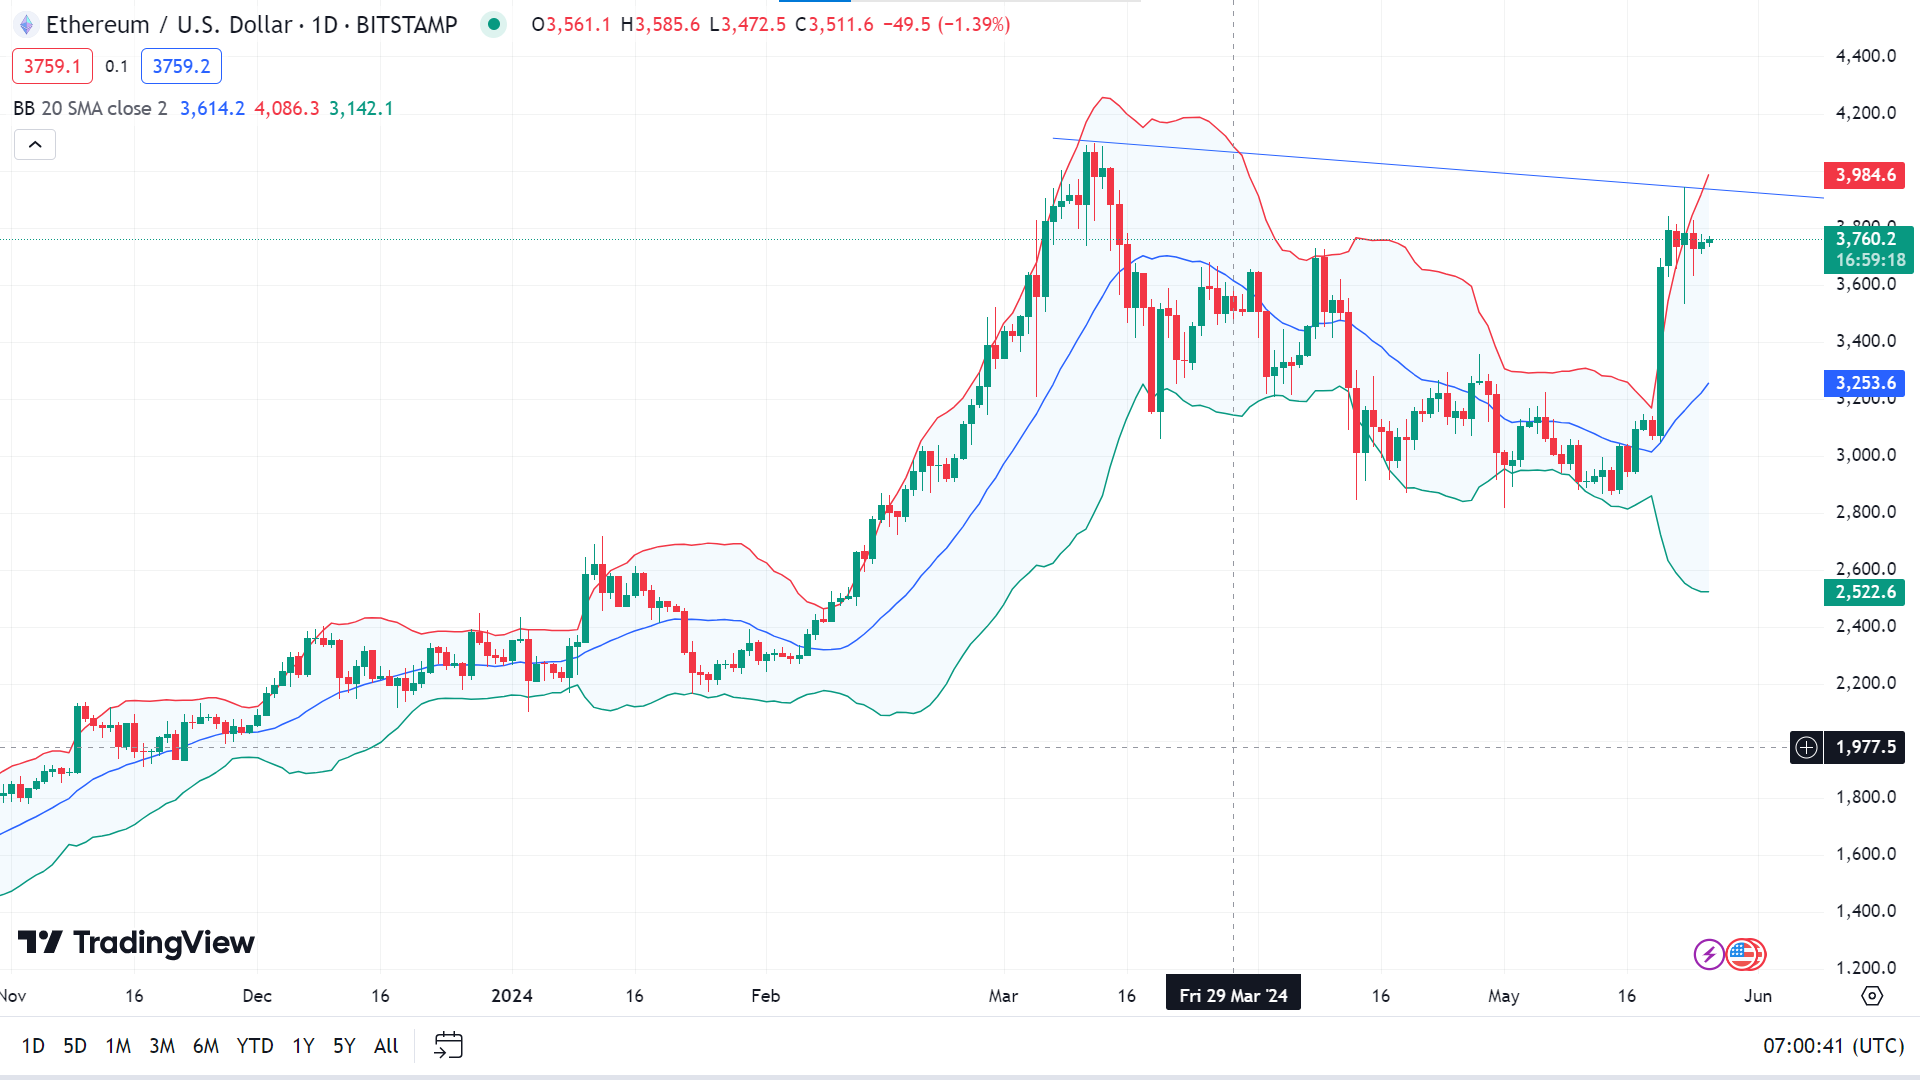
On the daily chart, the price has surged from the downtrend and is moving in the upper band of the Bollinger Bands indicator, declaring fresh bullish pressure. So, the price may head toward the March high of $4095.40, and any breakout can trigger the price to reach the next resistance of $4380.60, followed by the ATH of $4868.80.
However, the price has failed to regain the March high and is sliding slowly, which could signify a bullish weakness. The price can start to drop from this level and reach the primary support of $3602.30, followed by the next support of $3392.00.
Gold (XAUUSD)
Fundamental Perspective
Gold (XAUUSD) set a new all-time high of $2,450 early in the week before experiencing a significant correction. It fell below $2,400 on Wednesday, extending its decline. This drop was influenced by hawkish remarks from Federal Reserve (Fed) officials and the anticipation of April's upcoming US Personal Consumption Expenditures (PCE) Price Index data.
Initially, geopolitical tensions following the deaths of Iran's President Ebrahim Raisi and Foreign Minister Hossein Amir-Abdollahian in a helicopter crash pushed Gold to record highs. However, improving market sentiment led to a pullback, with Gold closing slightly higher on Monday.
By Tuesday, hawkish comments from Fed officials strengthened the US Dollar (USD), making it challenging for Gold to maintain its momentum. The downward trend continued on Wednesday, exacerbated by rising US Treasury yields and technical selling after Gold breached the $2,400 level.
On Thursday, robust US private sector data from S&P Global further bolstered the USD, driving Gold to a two-week low below $2,330. Toward the week's end, improved risk sentiment supported Gold. Investors are now keenly watching Fed commentary and key inflation data, notably the PCE Price Index. A higher-than-expected PCE could further support the USD, while a lower reading might reignite a rally in Gold.
Gold Price Prediction Technical Perspective
The last weekly candle of XAUUSD closed solid red after reaching the ATH of $2450.09, which can be a short-term resistance. So, the next candle on the weekly chart can be another red one.
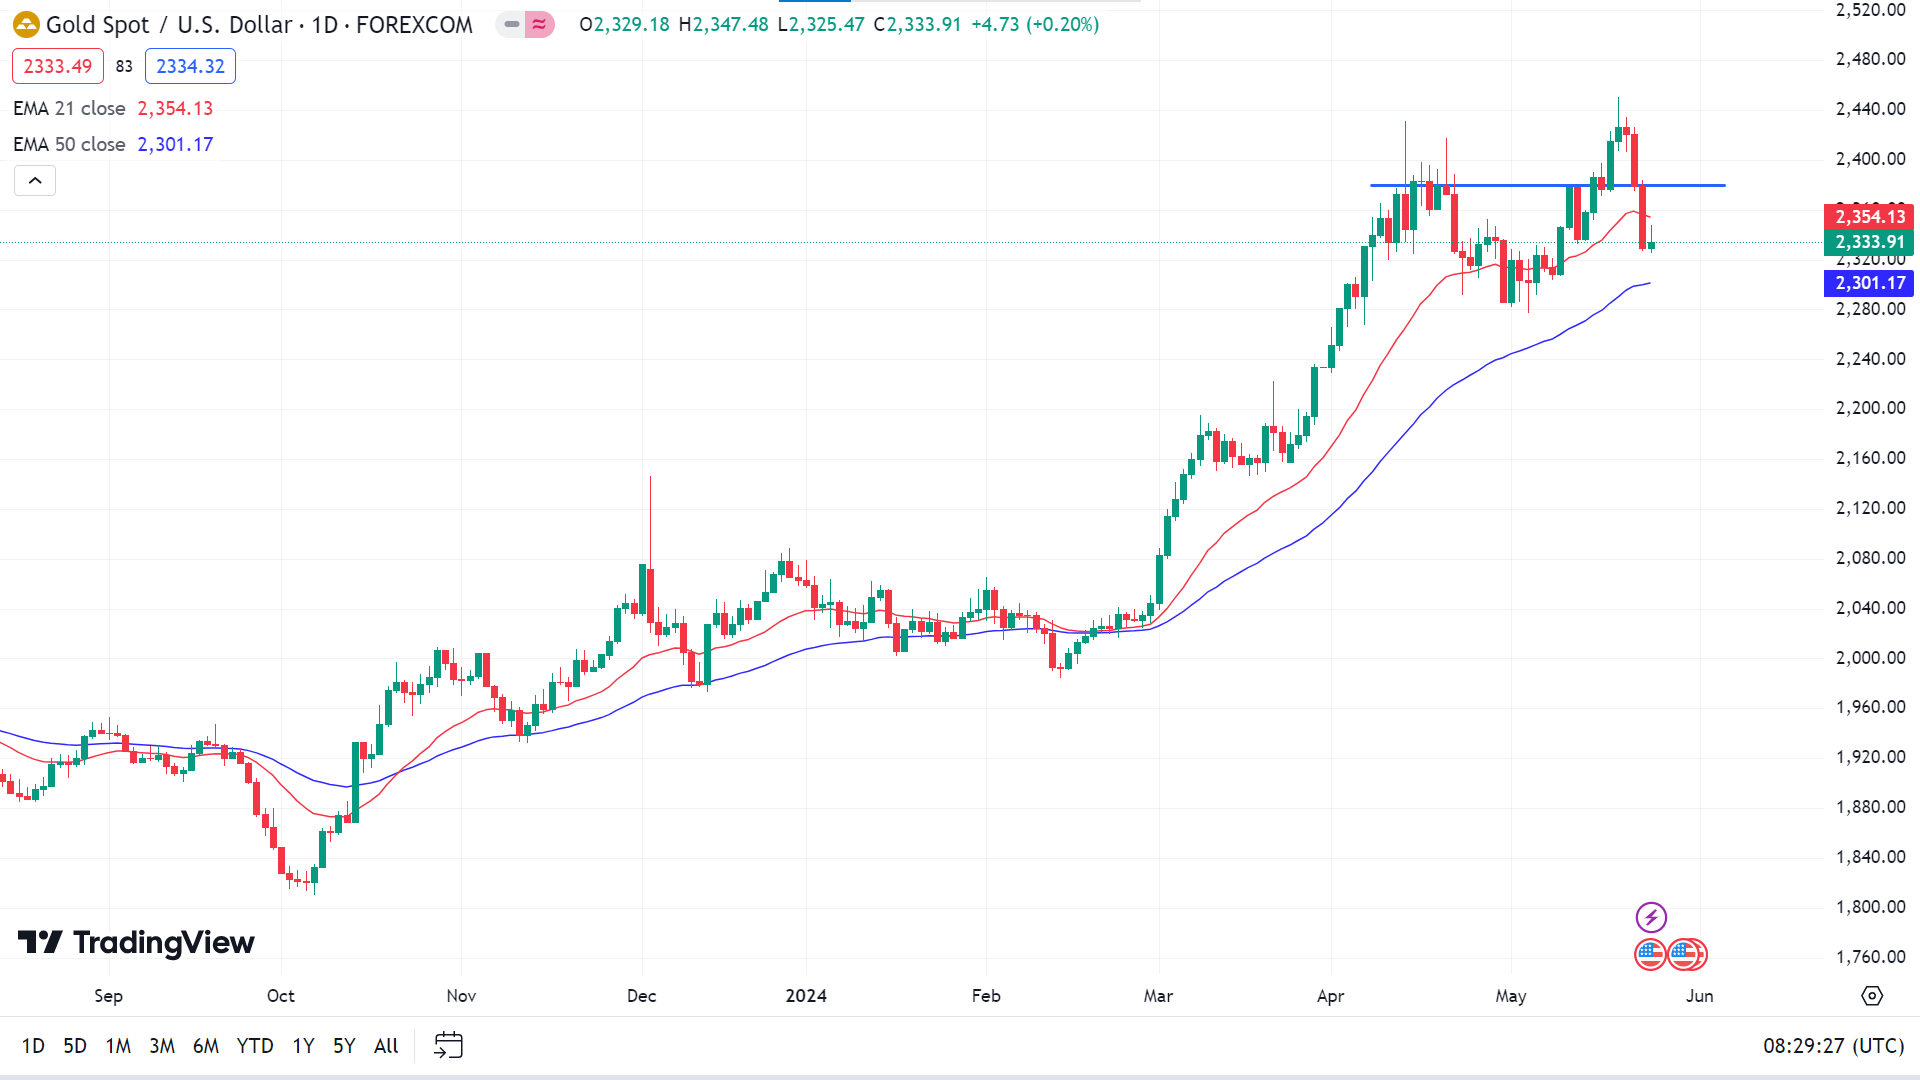
The price is moving between EMA 21 and EMA 50, leaving confusion. If the price breaks above the EMA 21 line, it can reach the primary resistance near $2379.91, followed by the next resistance of $2450.09 or above.
Meanwhile, if the price reaches below the EMA 50 line, it would indicate fresh bearish pressure, which might lead the price toward the primary support of $2277.43, followed by the next support of $2222.90.
Tesla Stock (TSLA)
Fundamental Perspective
Tesla (TSLA) stock has declined approximately 30% this year, yet it has seen a resurgence following its first-quarter earnings report on April 23. With the annual meeting on June 13 approaching, uncertainty persists as CEO Elon Musk prepares to steer the company into its next growth phase.
Tesla's first-quarter earnings and revenue fell short of expectations. Still, Musk's announcement of upcoming, more affordable models and an anticipated increase in 2024 vehicle deliveries, with a focus on full self-driving (FSD) technology, sparked investor optimism. It led to a 12% jump in TSLA shares the following day.
Before the earnings report, TSLA shares had plummeted over 17% in April, reaching a 52-week low of $138.80. However, after the earnings report, the stock surged, gaining approximately 21% by May 23.
Musk is also shaking up Tesla's leadership, letting go of top executives and announcing layoffs. Morgan Stanley's analyst Adam Jonas highlighted Tesla's profound strategic realignment, which could lead to volatility.
As the June 13 meeting approaches, shareholders are voting on Musk's 2018 compensation package and the potential relocation of Tesla's incorporation from Delaware to Texas. These votes could significantly influence Tesla's strategic direction. Meanwhile, Musk is expanding the supercharger network, committing over $500 million to add thousands of new chargers in 2024.
Tesla Stock Forecast Technical Perspective
The last weekly candle closed doji with a small green body, declaring bulls are still in play and the next candle can be another green one.
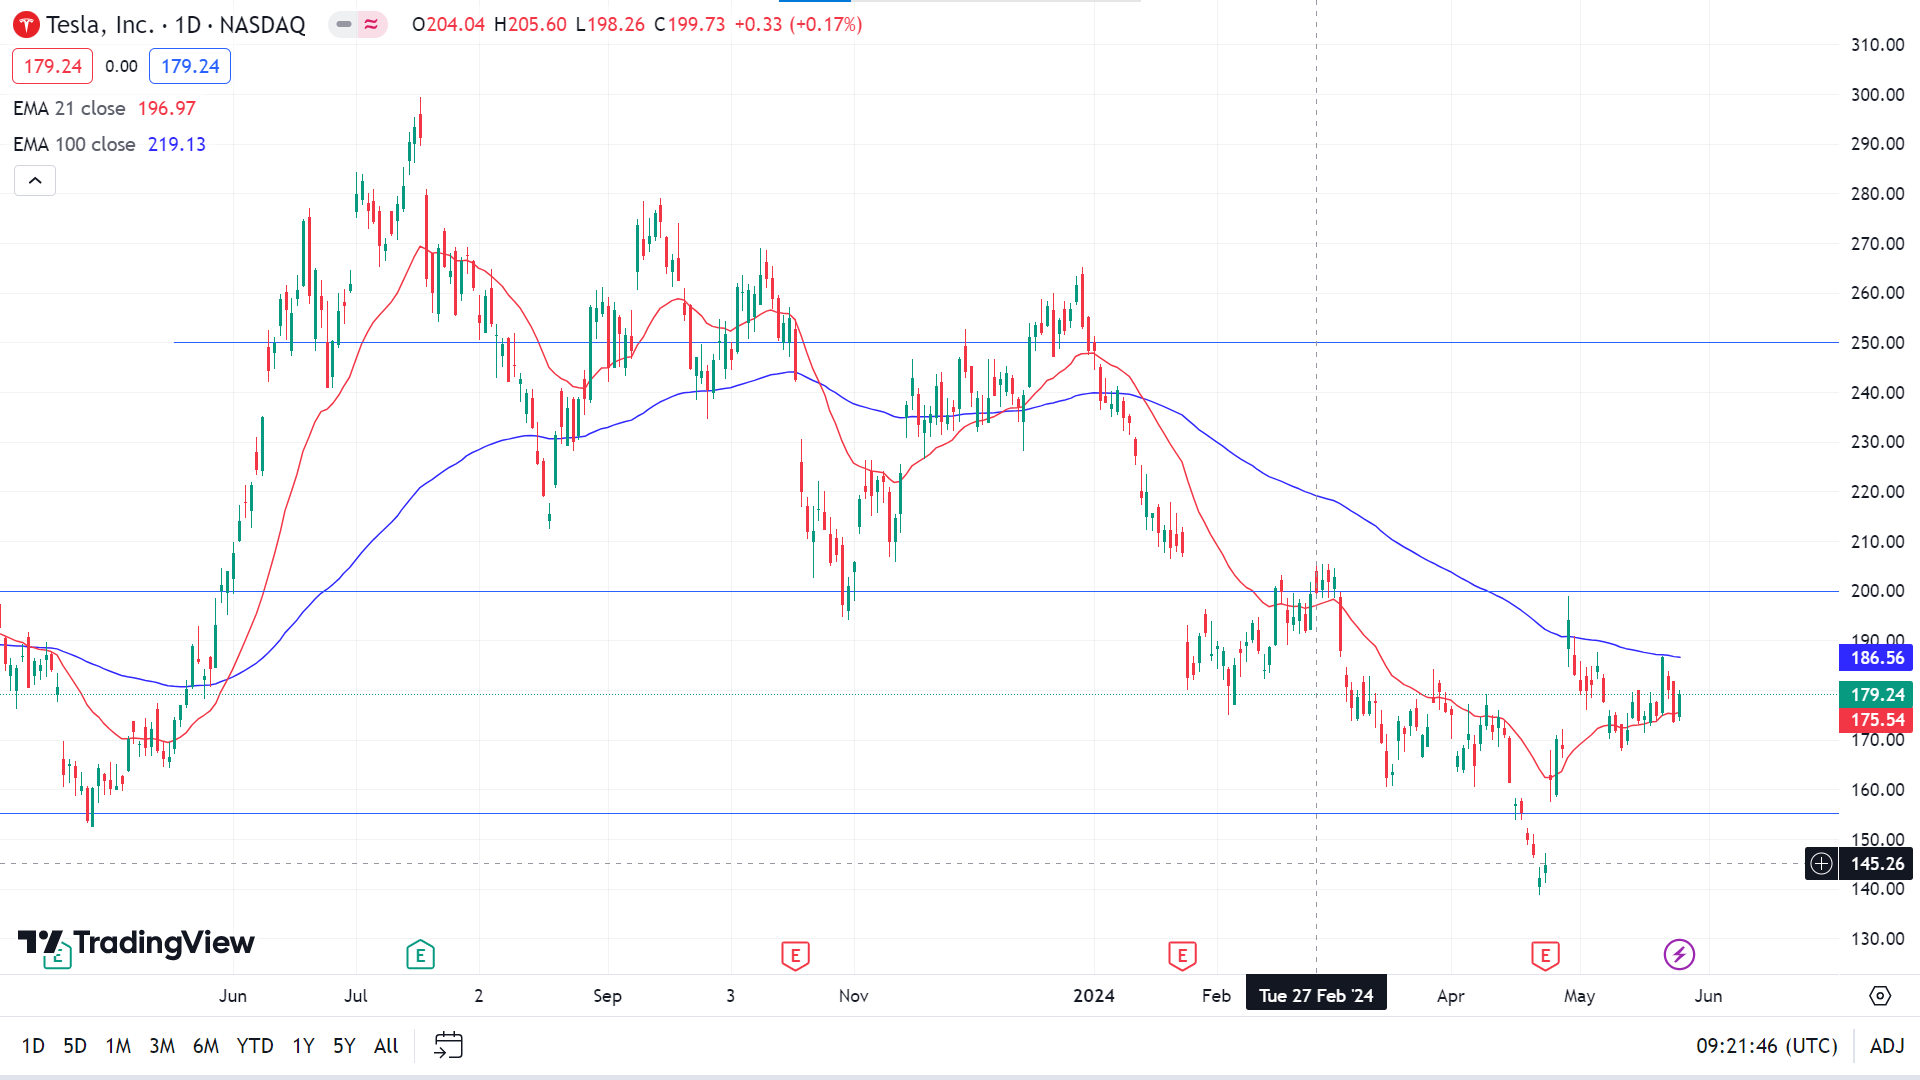
The price moves above the EMA 21 line, declaring positive movement on the asset price, whereas the EMA 100 line works as a dynamic resistance level on the daily chart. If the price exceeds the EMA 100 line, it will indicate sufficient bullish pressure, opening room for reaching the primary resistance of $198.87, followed by the next resistance near $213.70.
Meanwhile, if the price drops below the EMA 21 line, it will open the room for a decline toward the primary support of $165.50, followed by the next support near $155.16.
Nvidia Stock (NVDA)
Fundamental Perspective
Nvidia's shares surged above $1,000 in extended trading after the chipmaker's fiscal first-quarter earnings report exceeded analyst expectations. The company's robust performance not only underscored the resilience of the AI sector but also hinted at promising revenue prospects with the anticipated launch of its Blackwell AI chip later this year, as CEO Jensen Huang indicated.
The announcement of a 10-to-1 stock split further propelled the stock's 7% climb in after-hours trading. Nvidia outperformed on key financial metrics, reporting adjusted earnings per share of $6.12, surpassing the consensus estimate of $5.59, and revenue of $26.04 billion, exceeding the expected $24.65 billion. Moreover, the company's forward guidance of $28 billion in sales for the current quarter surpassed Wall Street estimates.
The remarkable revenue surge reflects Nvidia's robust performance in data center sales, which witnessed a staggering 427% year-over-year growth to reach $22.6 billion. This noteworthy expansion was primarily driven by strong demand for the company's Hopper graphics processors, notably fueled by Meta's adoption of the H100 GPU for its Lama 3 language model. With the upcoming Blackwell GPU poised to play a pivotal role in driving future growth, Nvidia's prospects appear increasingly promising in the AI landscape.
Nvidia Stock Forecast Technical Perspective
On the weekly chart, NVDA ended the last candle as a solid green, the fifth in a row gaining candles, declaring significant bullish pressure on the asset price. So, the next candle can likely be another green one.
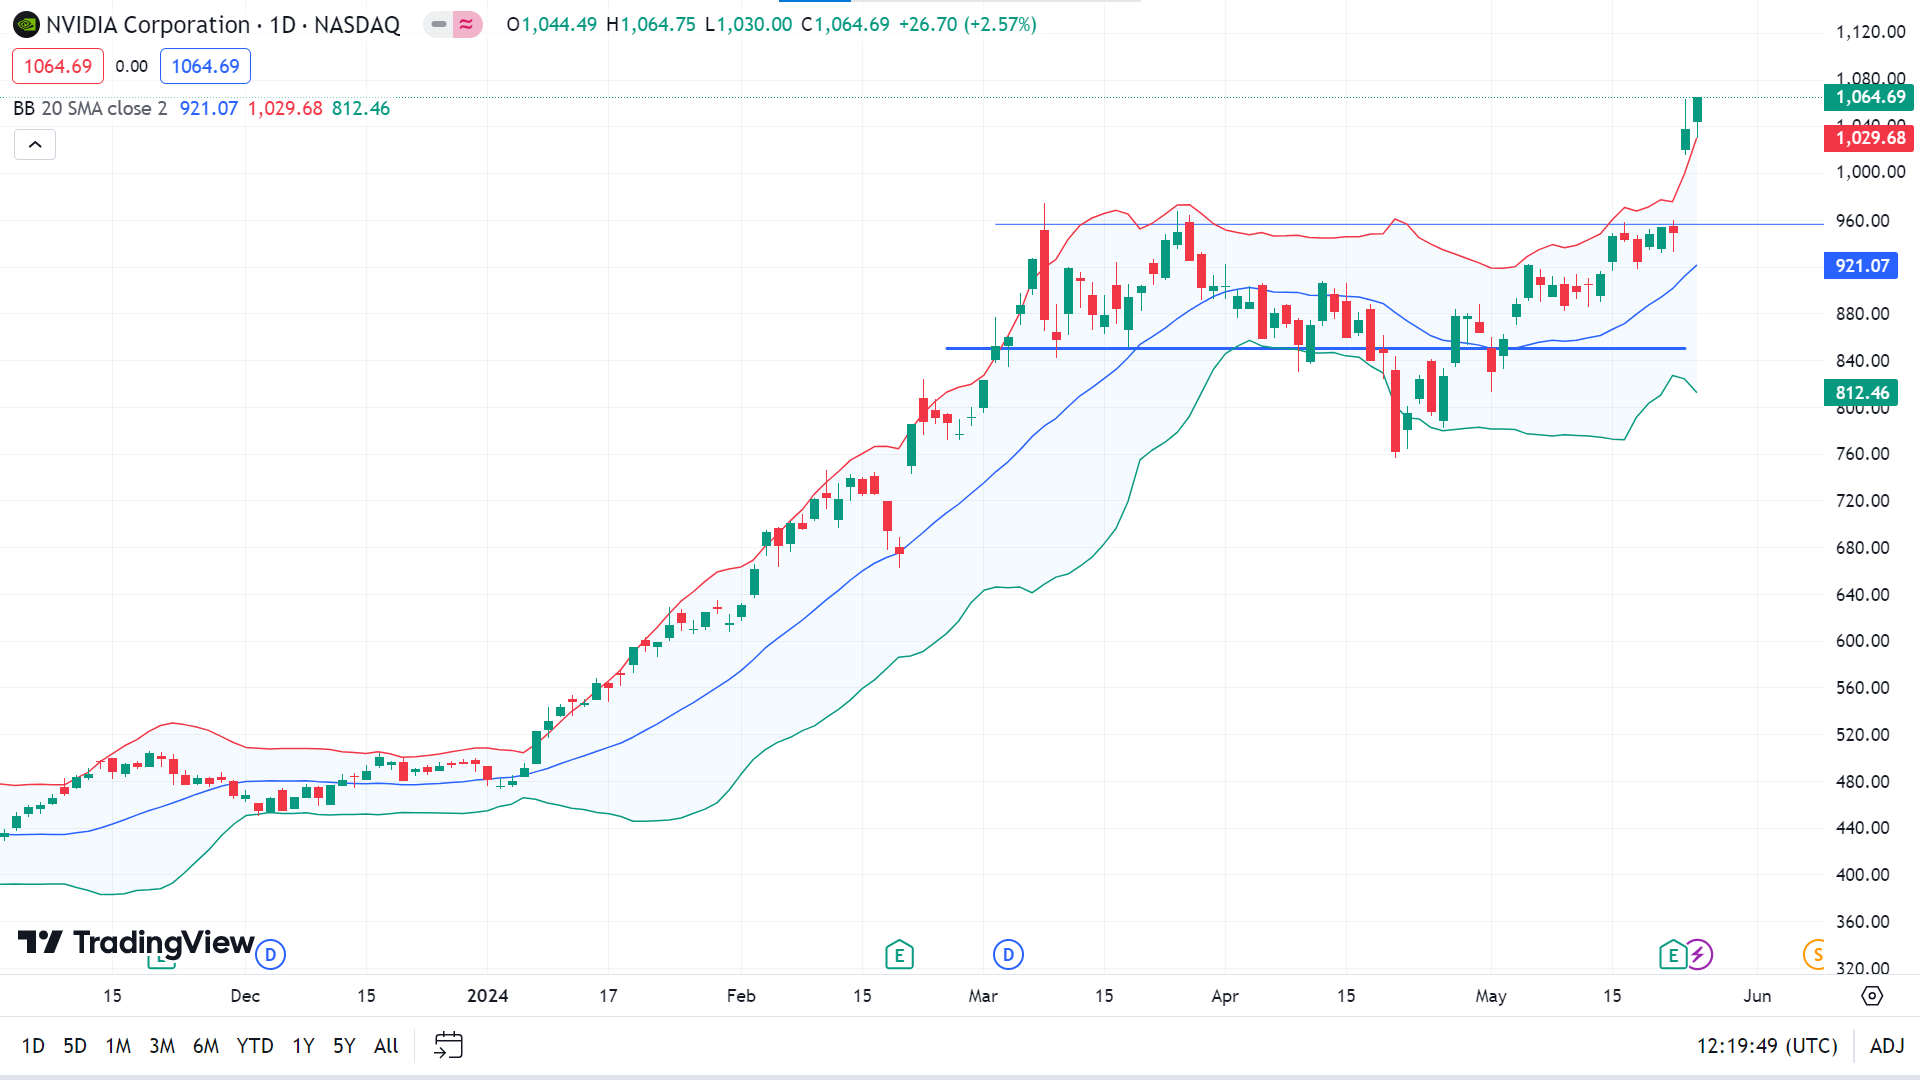
On the daily chart, the price is floating above the anticipated $1000 level, breaking above the previous resistance of $956.18, above the upper band of the Bollinger Bands, declaring significant bullish pressure. So, the price may seek to reach a new high as the primary resistance is $1100.6, followed by the next resistance near $1179.82.
Meanwhile, as the price moves above the upper band of the Bollinger Bands indicator, signaling extreme bullish pressure, any pause can trigger the price to drop to the recent support of $1000, followed by the next support near $956.18.
WTI Crude Oil (USOUSD)
Fundamental Perspective
West Texas Intermediate (WTI) US Crude Oil rebounded, recovering from a 12-week low of $76.03 set earlier in the day. Despite this bounce, WTI remains down for the week, showing a decline of 2.38% from Monday's opening bids.
The recovery in Crude Oil markets is underpinned by a renewed market risk appetite following diminished expectations for a Federal Reserve (Fed) rate cut in September. According to the CME's FedWatch Tool, the probability of at least a quarter-point rate cut by the Federal Open Market Committee (FOMC) in September has dropped significantly from 70% at the start of the week to just over 50%.
US Durable Goods Orders showed a strong recovery in April, rising 0.7% month-over-month, defying the forecasted -0.8% decline. Additionally, the University of Michigan's 5-year Consumer Inflation Expectations eased slightly to 3.0% in May, down from the expected 3.1%. This easing in inflation expectations is boosting investor sentiment.
US Crude Oil production continues to weigh on prices, with supply counts showing unexpected increases. Reports from the American Petroleum Institute (API) and the Energy Information Administration (EIA) revealed a buildup in US Crude Oil stocks, contrary to forecasted declines, leaving energy traders hopeful for a rise in demand to reduce the surplus.
Oil Prices Forecast Technical Perspective
On the weekly chart, the last candle closed red with lower wicks demolishing bullish expectations as the previous candle reflected optimism that the price might be trying to bounce back upside. The next candle could be another red one.
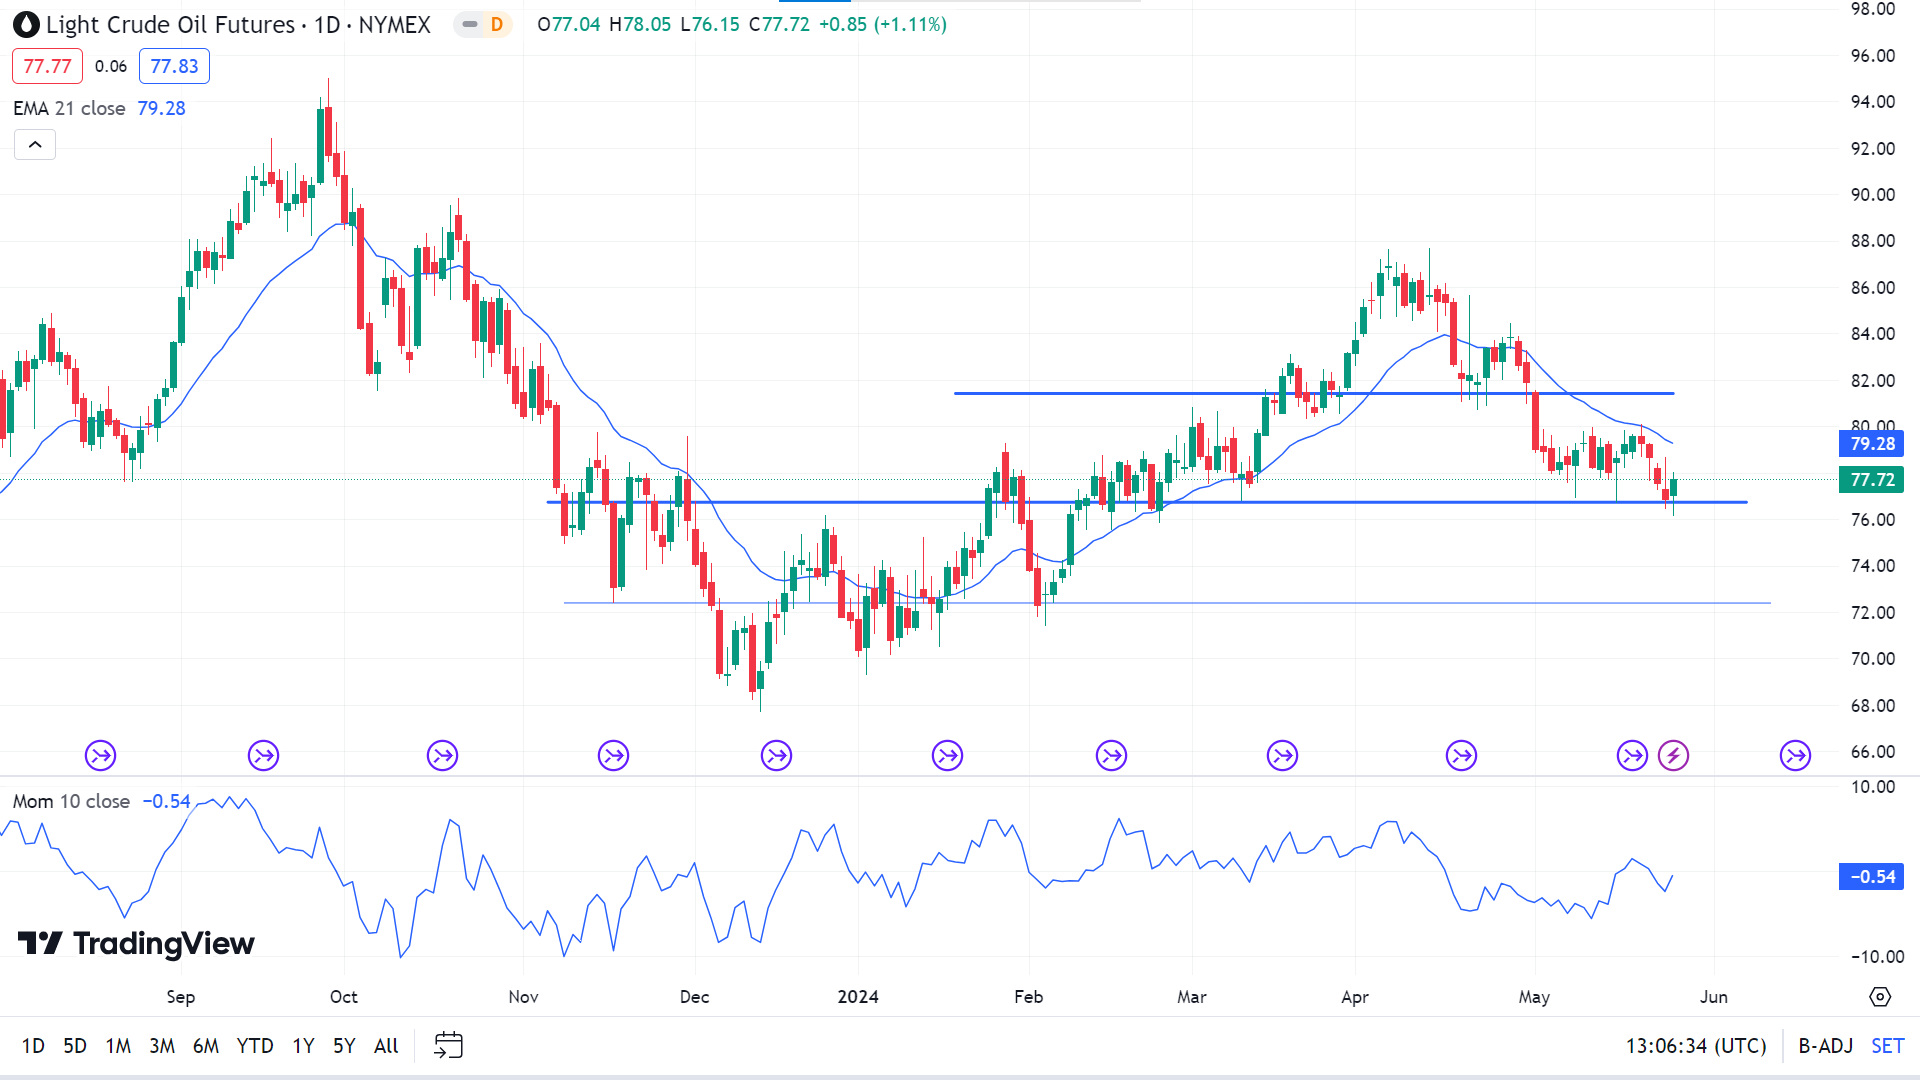
The price is moving below the EMA 21 line, declaring seller domination on Crude Oil price movements. However, bouncing back from previous support of $76.73 leaves optimism for buyers that the price may bounce back upside from here. If the price exceeds the EMA 21 line, the price can reach the primary resistance of $81.44, followed by the next resistance near $84.45.
Meanwhile, if the price successfully breaks the support of $76.73, it can decline toward the nearest support of $74.44, followed by the next support near $72.39.


