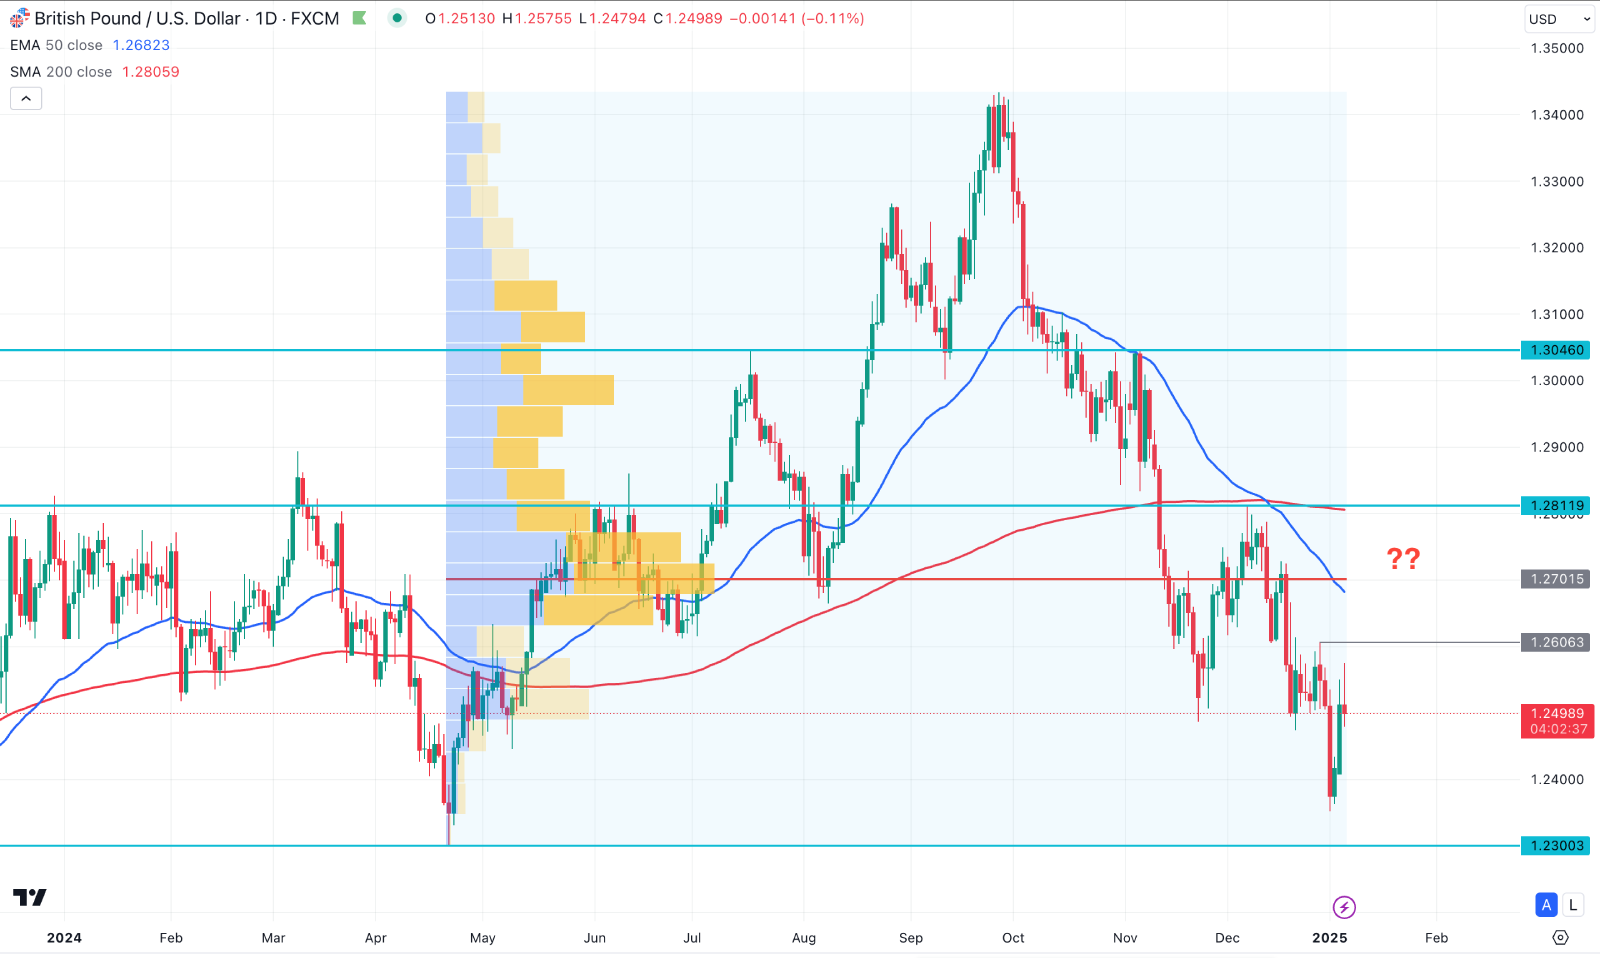
The GBP/USD exchange rate rose for the third day, reaching near the 1.2500 psychological level. The weak US dollar (USD) drives the pair's rising momentum until the ISM Services Purchasing Managers Index (PMI) shows a better-than-expected result.
Donald Trump on US Dollar Index (USDX)
The US Dollar Index (USDX) is at a multi-year high, but the recent price shows a sign of exhaustion at the top. President-elect Donald Trump's remarks that his tariff strategy will not be lowered may support the greenback.
Trump denied a Washington Post article claiming his administration was considering restricting the tariff strategy's application to only a few key imports. Traders are expected to keep a close eye on developments about Trump's tariff policy.
The Sterling Awaits a Direction
Following the publication of British Retail Sales data, the GBP didn't move much. Following a 3.4% drop the month before, the UK Retail Consortium (BRC) Comparable items Retail Sales experienced a noteworthy 3.1% rise in December 2024. This spike, which was mostly caused by strong Black Friday expenses, surpassed market projections, which had predicted a 0.2% decline. Since March 2024, it was the biggest monthly rise.
The BRC stated that general retail growth during the final quarter of 2024 stayed poor, with a year-over-year sales increase of only 0.4%, notwithstanding the December upswing. While comparable sales improved by a modest 0.5%, overall retail sales rose by 0.7% for the entire year.
Economic Events to Look At
Investors are not likely to respond to this data before this week's important employment-related news. Therefore, the perception of risk may continue to affect the USD's value and shape the movement of the GBP/USD exchange rate.
Market investors will eagerly monitor the United States JOLTS Job Openings report for November on Tuesday before the Nonfarm Payroll on Friday.
GBPUSD Forecast Technical Analysis

In the daily chart of GBPUSD, the ongoing selling pressure is visible from the September 2024 high with no sign of a recovery. However, the most recent selling pressure has reached the crucial demand zone, from where some minor upward pressure is seen. Still the price is trading below the near-term resistance line, which signals a downside continuation.
Looking at the major structure, the 200 day Simple Moving Average is above the current price while the 50 day EMA showed a bearish crossover. It is a sign of a Death Cross formation in the daily chart, which might extend the loss in the coming days.
Moreover, the volume structure shows the same outlook where the current high volume line is at the 1.2606 level, which is above the current price.
Based on this outlook, an immediate bearish pressure could come as long as the price trades below the high volume resistance line. However, overcoming the 1.2606 static line could signal a bullish V-shape recovery, which might result in a trend reversal. In that case, the primary aim for the price would be to test the 1.2811 level before reaching the 1.3000 psychological area.


