- Amazon's Q1 2024 showcased robust revenue growth across segments, with notable increases in operating income and net sales, reflecting operational efficiency and financial strength.
- The stock holds massive growth potency based on technical and absolute valuation multiples, outperformed major market indices with a bullish trend,
- The company may continue to capitalize on global e-commerce trends, with AWS remaining dominant in cloud computing, with potential for further growth.
- Along with high relative valuation multiples and Amazon faces challenges from intense competition, regulatory hurdles, and risks attached with new investments.
I. Amazon Q1 2024 Performance Analysis
A. Amazon Key Segments Performance
Amazon's (NASDAQ: AMZN) financial performance in Q1 2024 signifies its robustness and resilience. With a 13% year-over-year increase in net sales to $143.3 billion, the company demonstrates consistent revenue growth. On the liquidity side, Amazon's Free Cash Flow boosted to over $50 billion on a trailing twelve months basis in Q1.
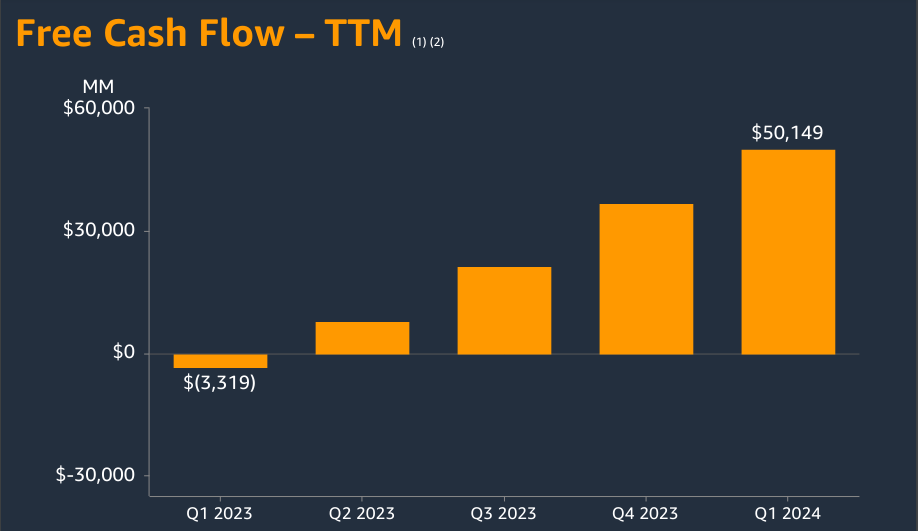
Source: Q1 2024 Earnings
In North America segment revenue increased by 12% year-over-year, reaching $86.3 billion. Operating income soared to $5 billion, with an operating margin of 5.8%, indicating efficient operations and cost management. Meanwhile in the International segment, despite challenges like currency fluctuations, revenue grew by 11% year-over-year to $31.9 billion. Operating income improved significantly to $903 million, demonstrating Amazon's efforts to enhance cost efficiencies and expand offerings. With a 17% year-over-year increase in sales to $25.0 billion, Amazon Web Services (AWS) continues to be a key revenue driver. The segment's operating income surged to $9.4 billion, reflecting strong demand for cloud services and AWS's leading position in the market.
At the bottom-line, operating income soared to $15.3 billion, marking a remarkable 221% increase from the previous year. Net income surged to $10.4 billion, showcasing Amazon's profitability and ability to convert revenue into substantial profits. Moreover, the operating cash flow increased by 82%, reflecting strong financial health and liquidity.
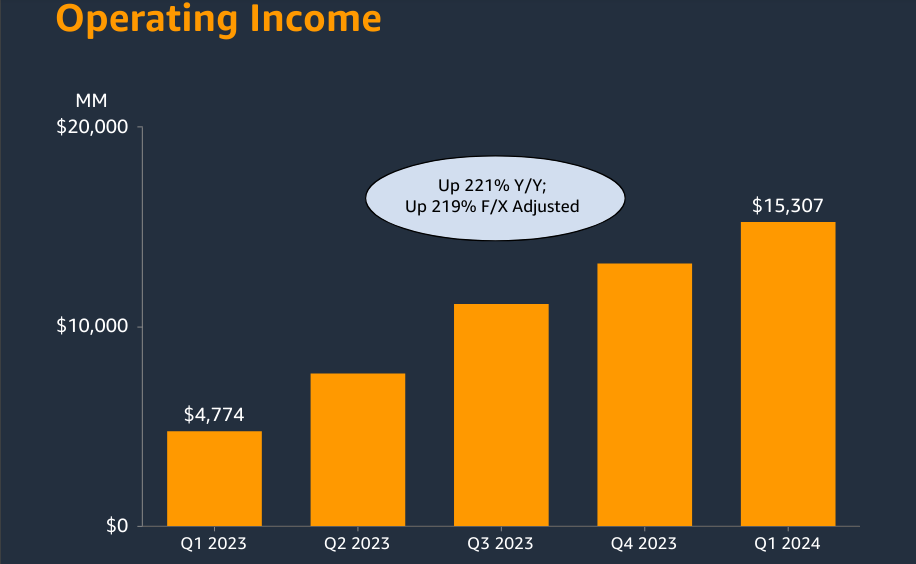
Source: Q1 2024 Earnings
Moreover, Amazon's focus on delivering orders quickly, with over 2 billion global units arriving the same or next day in Q1 2024, reinforces customer loyalty and satisfaction. Initiatives like Spring Deal Days and Prime Day offer significant savings to customers worldwide, driving sales and engagement. Similarly, Amazon's expansion into healthcare services, including pharmacy delivery and health condition programs, demonstrates its ability to leverage its platform to provide innovative solutions and convenience to customers.
Finally, AWS continues to be a dominant force in cloud computing, with accelerated revenue growth and significant investments in AI capabilities, including Gen AI. The introduction of new services like Amazon Bedrock and Amazon Q showcases Amazon's commitment to innovation and addressing customer needs. Amazon's focus on AI and machine learning permeates its operations, enhancing customer experiences, improving operational efficiency, and driving innovation across its business segments.
B. Amazon Stock Price Performance
Amazon experienced a robust quarter in terms of stock performance. With a Amazon market cap of $1.87 trillion, the stock demonstrated significant growth. Opening at $151.54 and closing at $180.38, it saw highs of $181.70 and lows of $144.05 during the period, indicating volatility. The stock's price return stood at an impressive 19%, outperforming major market indices like the S&P 500 and NASDAQ100, which recorded price returns of 10.7% and 9.5%, respectively.
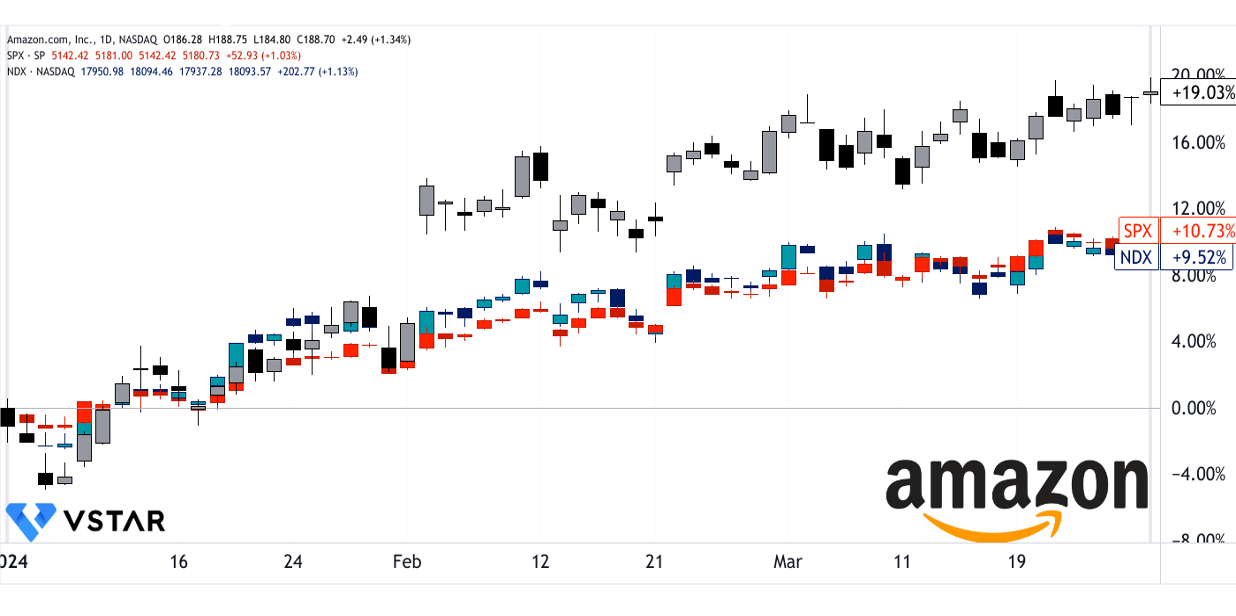
Source: tradingview.com
II. Amazon Outlook & Growth Opportunities
In the e-commerce sector, Amazon is well-positioned to capitalize on the growing trend of online shopping, both globally and within key markets like the United States and China. With total global e-commerce sales projected to surpass $6.33 trillion in 2024, Amazon stands to benefit from the increasing adoption of online retail channels. The company's relentless focus on customer experience, exemplified by initiatives such as fast and convenient delivery, expanded product selection, and competitive pricing, reinforces its market leadership and sustains customer loyalty.
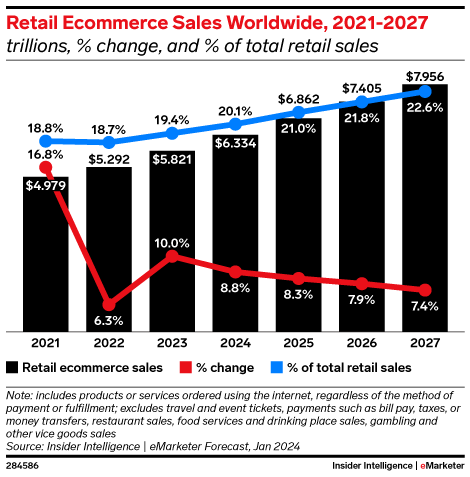
Source: emarketer.com
Furthermore, Amazon's expansion into new product categories, partnerships with popular brands, and innovative shopping events contribute to enhancing its competitive edge in the e-commerce landscape. For instance, collaborations with luxury brands and the introduction of Prime Day events attract customers seeking exclusive deals and premium offerings, driving sales growth and market penetration.
In the cloud computing sector, Amazon Web Services remains a lead player (31% market share), experiencing growth amid rising demand for cloud-based services and solutions. With worldwide public cloud end-user spending projected to reach $679 billion in 2024, AWS may capture a significant share of this market opportunity. The company's comprehensive suite of cloud services, including Infrastructure-as-a-Service (IaaS) and Platform-as-a-Service (PaaS), caters to diverse business needs and emerging technologies like generative AI (GenAI).
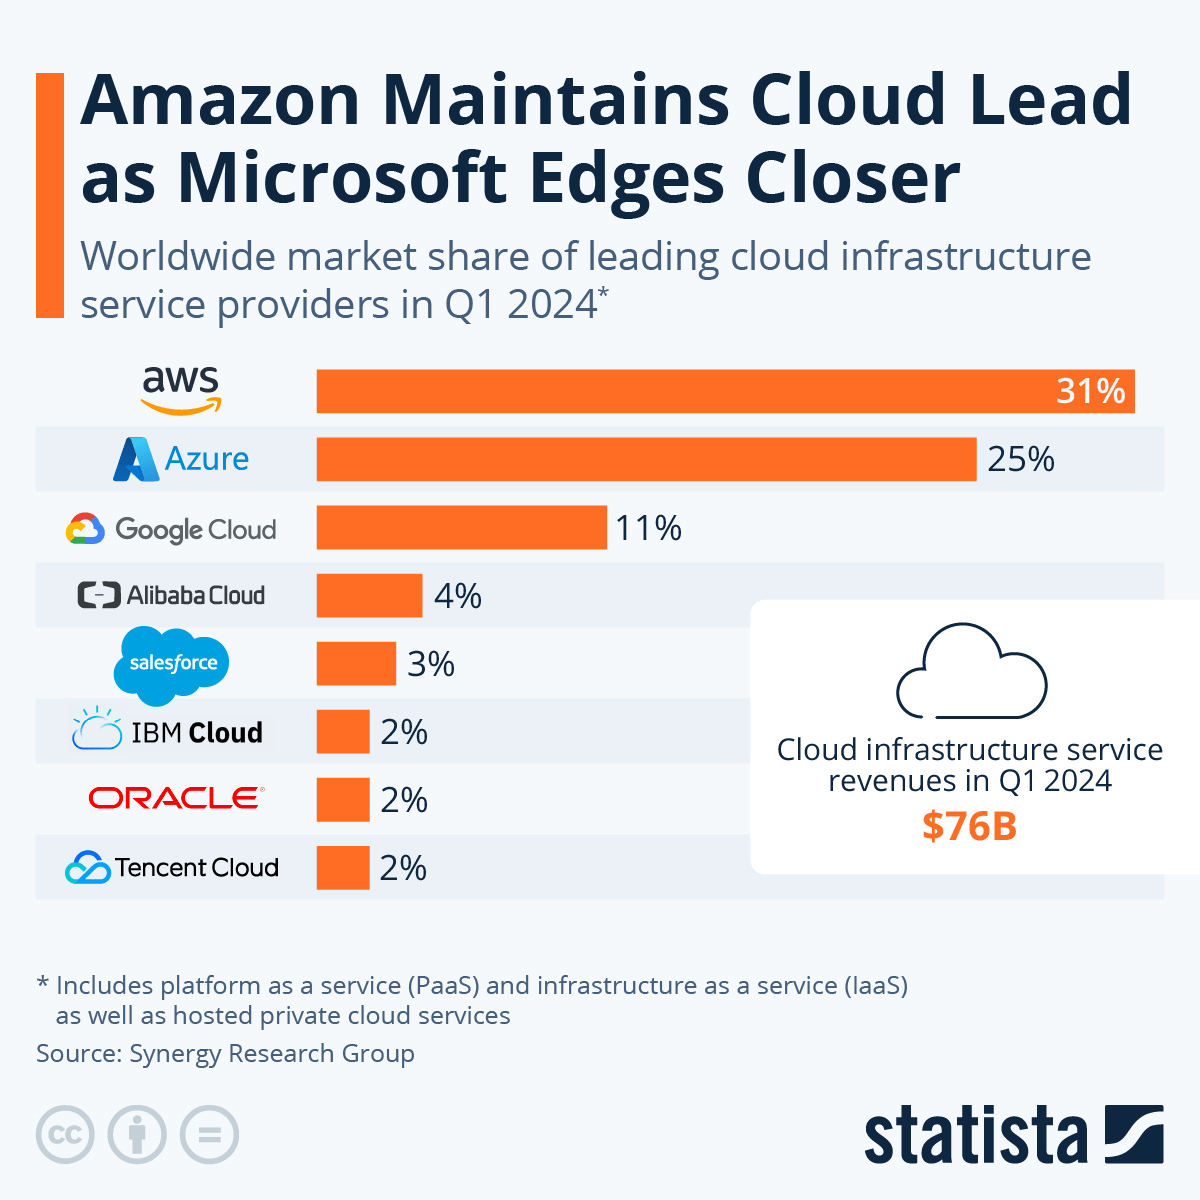
Source: statista.com
Furthermore, Amazon's expansion strategy extends to strategic alliances in the healthcare sector. The introduction of Amazon Pharmacy, offering home delivery of prescription medications, reflects the company's foray into the healthcare market. By leveraging partnerships with pharmaceutical companies and healthcare providers, Amazon aims to provide customers with convenient access to medical care and medications, thereby expanding its service portfolio and customer base.
III. Amazon Stock Price Prediction 2024
A. Amazon Stock Forecast: Technical Analysis

Source: tradingview.com
The projected average AMZN price target by the end of 2024 is $250. This estimate is based on the momentum of change-in-polarity over the short-term, projected over Fibonacci retracement/extension levels. It implies a significant potential upside from the current price level. The optimistic Amazon price target by the end of 2024 is $275. This projection relies on the higher-high price momentum of the current swing over the mid- to short-term, extrapolated over Fibonacci retracement/extension levels. This suggests a more bullish outlook, reflecting strong confidence in the company's growth prospects.
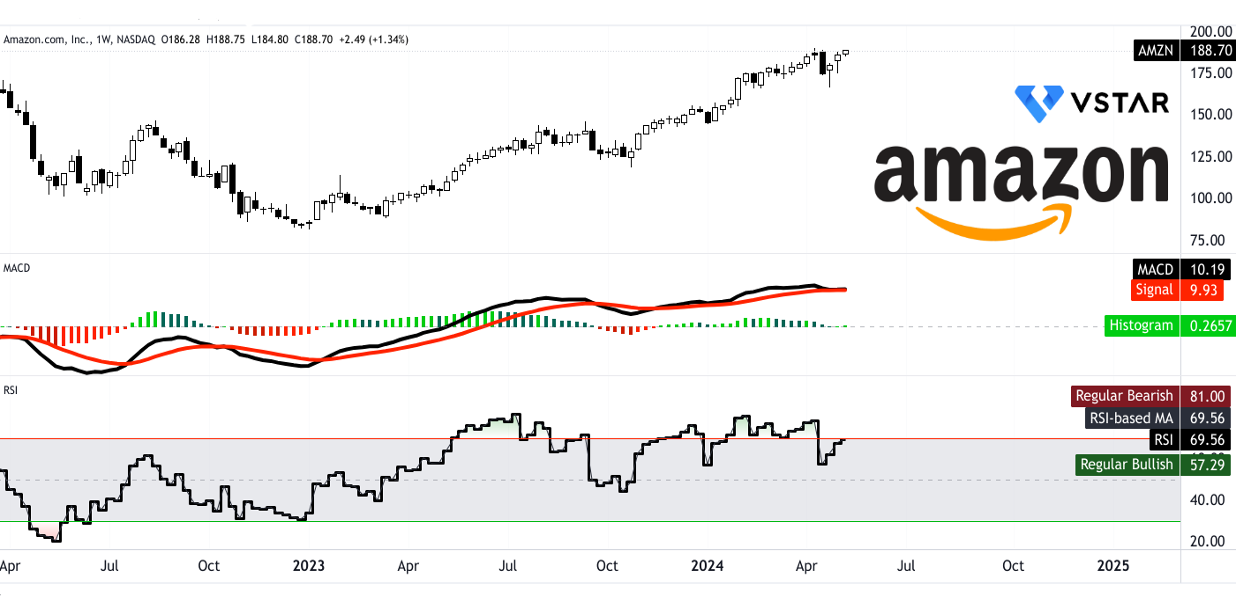
The current AMZN stock price stands at $188.70, with a modified exponential moving average (EMA) trendline at $169.25 and a baseline at $167.55. These figures suggest an upward direction in the stock price. The modified EMAs indicate a positive momentum, possibly driven by recent market developments or company-specific factors.
Amazon Stock Predictions - Support and Resistance Levels
Support Levels:
- Primary Support: $135.58
- Pivot of Current Horizontal Price Channel: $156.10
- Support: $176.61
These support levels indicate key price points where buying interest may increase, potentially stabilizing or reversing any downward movements.
Resistance Levels:
- Core Resistance: $220.88
The core resistance level represents a significant hurdle for the stock price to overcome. Breaking through this level could signal further upward momentum.
The Relative Strength Index (RSI) value is 69.56, indicating bullish momentum. However, it is below the regular bearish level of 81, suggesting that the stock is not overbought. The upward trend of the RSI line further supports the notion of continued strength in the stock price. The Moving Average Convergence/Divergence (MACD) indicators show a bullish trend with a MACD line of 10.19, surpassing the signal line of 9.93. The positive MACD histogram reinforces this bullish sentiment, although the decreasing strength of the trend warrants close monitoring for potential shifts in momentum.
Source: tradingview.com
B. AMZN Stock Forecast: Fundamental Analysis
Amazon's P/E ratio, a measure of its stock price relative to AMZN earnings per share, stands at 41.59, significantly higher than the sector median of 15.38 but decisively below the 5 year historical average. This indicates that investors are willing to pay a premium for Amazon earnings compared to the sector average but the stock is undervalued in absolute terms. However, compared to its own five-year average, Amazon PE ratio has decreased by 77.38%, suggesting a potential decline in market sentiment relative to historical performance. Similarly, other ratios like EV/Sales, EV/EBITDA, and Price/Book also reflect Amazon's premium valuation compared to sector medians and solid undervaluation against historical averages.

Source: Analyst's compilation
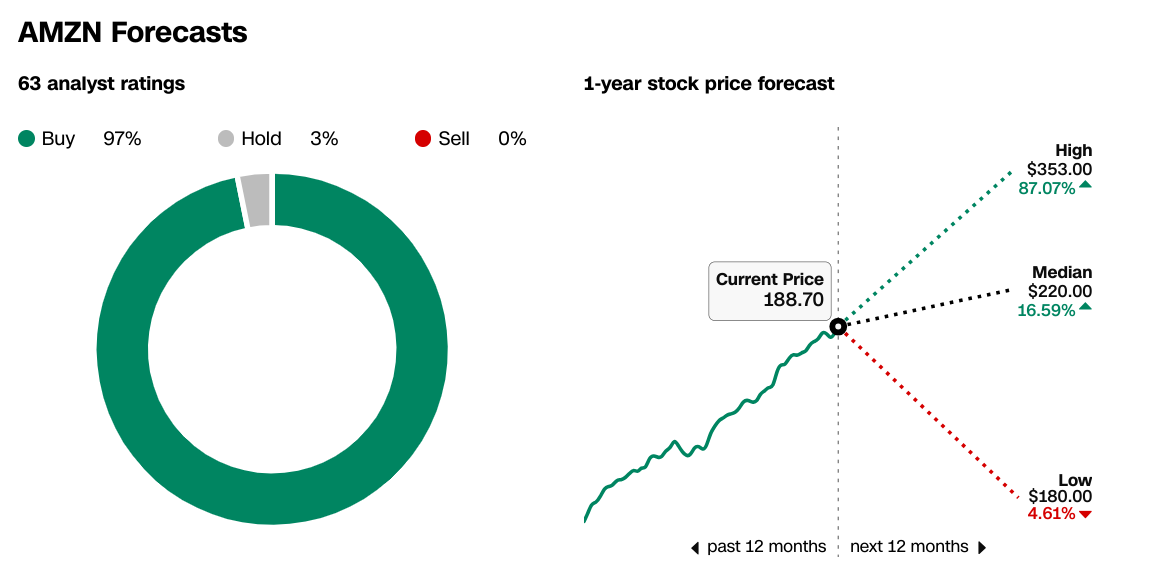
As per WSJ, analysts remain overwhelmingly bullish on Amazon, with a consistent trend of buy or overweight ratings. This sentiment has been steady over the past three months, indicating sustained confidence in the company's future performance. The stock price targets provided by analysts vary widely, with a high of $353, a median of $220, and a low of $180. The average target of $221.66 suggests potential upside from the current Amazon share price of $188.70. However, the discrepancy between high and low targets underscores the uncertainty surrounding Amazon's future valuation.
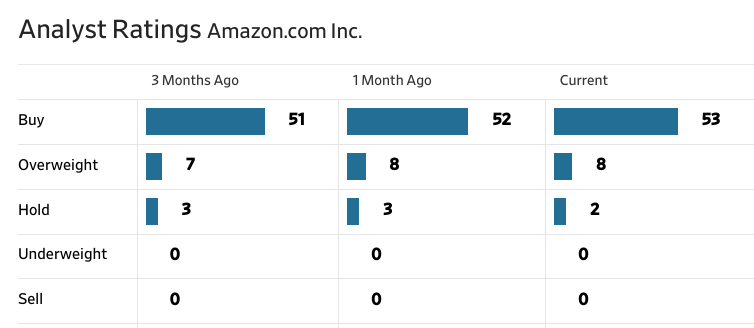
Source: WSJ.com
Source: cnn.com
C. Amazon Stock Prediction: Market Sentiment
Despite the high valuation multiples, investor confidence in Amazon remains robust, as evidenced by the overwhelming majority of buy ratings from analysts. This confidence is further supported by institutional holdings, with institutions owning 60.80% of Amazon's outstanding shares, indicating strong institutional support for the stock. Institutional investors hold holdings amounting to $1.19 trillion. This substantial institutional ownership suggests confidence among large investors in Amazon's long-term prospects.

Source: Nasdaq.com
Short interest in Amazon, as of the most recent settlement date, stands at 70,546,891 shares as of Q1 2024. With an average daily share volume of 30,877,346, this translates to a relatively low days-to-cover ratio of 2.3. A low days-to-cover ratio indicates that it would take fewer days for short sellers to cover their positions. This is potentially signaling less bearish sentiment or lower perceived risk among short sellers.
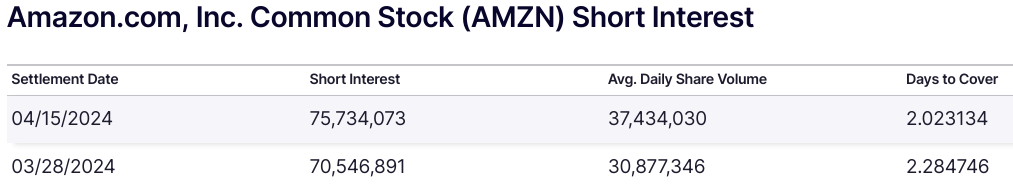
Source: Nasdaq.com
IV. Amazon Challenges & Risk Factors
One significant challenge is intense competition from other major players in the e-commerce and technology industries. Amazon Competitors like Walmart and Alibaba pose a threat to Amazon's market share, particularly in regions where they have a strong presence. Walmart's expansion of its online retail operations and Alibaba's dominance in the Chinese market are specific examples of formidable competitors.

Source: statista.com (E-commerce market share of leading e-retailers worldwide in 2022, based on GMV)
Moreover, Amazon faces risks related to its investments and ventures, such as its investment in Rivian Automotive, Inc. The $2.0 billion pre-tax valuation loss from this investment in the first quarter of 2024 highlights the uncertainty and potential financial setbacks associated with strategic investments.
Furthermore, while Amazon Web Services continues to be a key revenue driver, it faces increasing competition from other cloud service providers like Microsoft Azure and Google Cloud Platform. These competitors are aggressively investing in cloud infrastructure and services, challenging AWS's market leadership and potentially impacting its revenue growth.
In conclusion, Amazon's Q1 2024 performance demonstrates robust revenue growth across key segments, highlighting operational efficiency and strong financial health. Operating income soared, showcasing profitability and effective cost management. Amazon's stock exhibited significant growth, outperforming major market indices. The company may capitalize on global e-commerce trends. Similarly, AWS remains dominant in cloud computing, amidst rising demand and investments in AI capabilities. Technical analysis suggests an upward trajectory, with price targets indicating potential upside. In line with that, fundamental analysis reveals optimism in absolute valuation measures with concerns regarding overvaluation compared to sector averages.