- P&G achieved 3% organic sales growth in Q2 2025, driven by volume and mix improvements, with Family Care leading at double-digit growth.
- Core EPS rose 2% to $1.88, despite margin pressures from transportation disruptions and currency headwinds.
- P&G stock price declined 3.20% in the quarter, underperforming the S&P 500 (2.07%) and NASDAQ (4.74%).
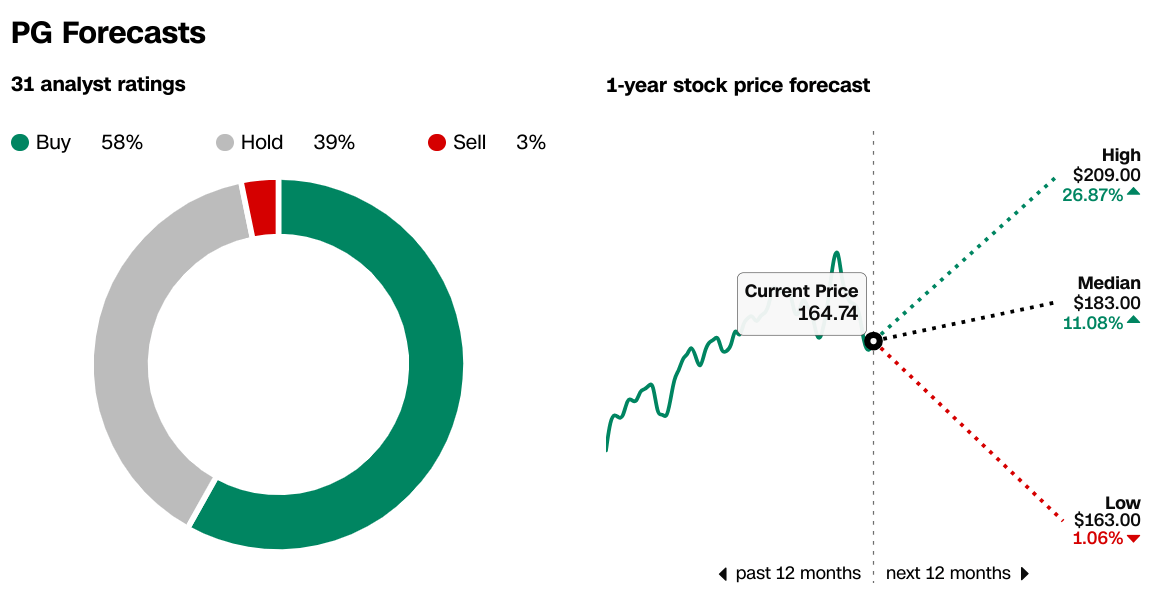
- Analysts project a median 12-month PG price target of $183.00, with 58% recommending a “buy” due to strong fundamentals.
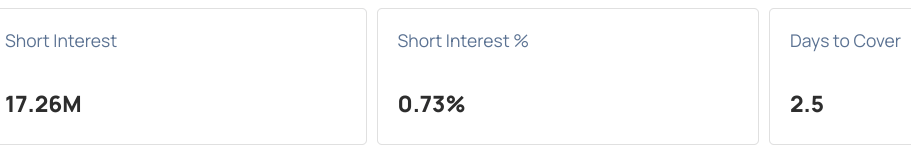
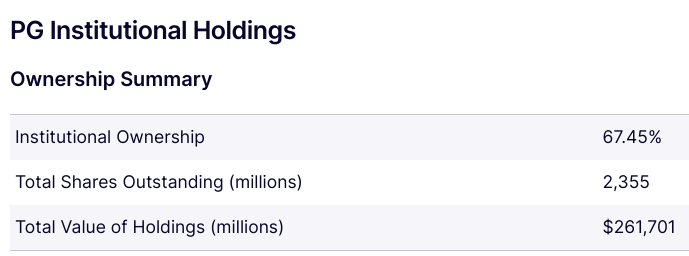
- Institutional ownership stands at 67.45%, with minimal short interest (0.73%), reflecting strong investor confidence.
Source: SeekingAlpha
I. Procter & Gamble Q2 2025 Performance Analysis
A. Key Segments Performance
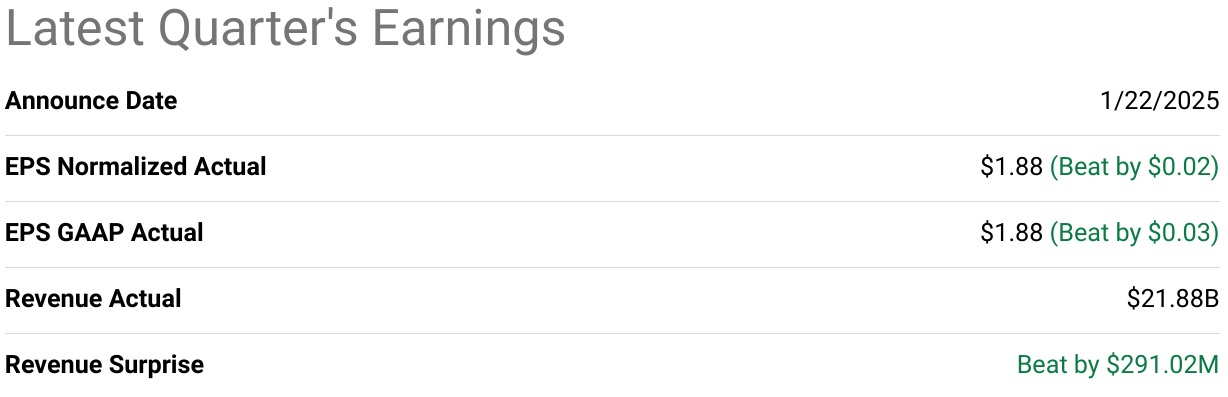
Financial Highlights
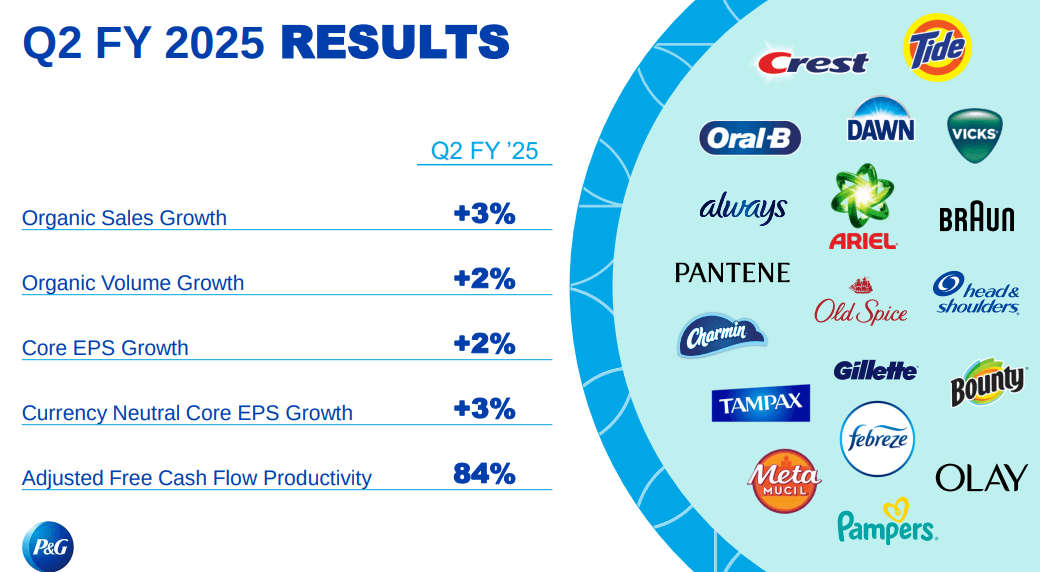
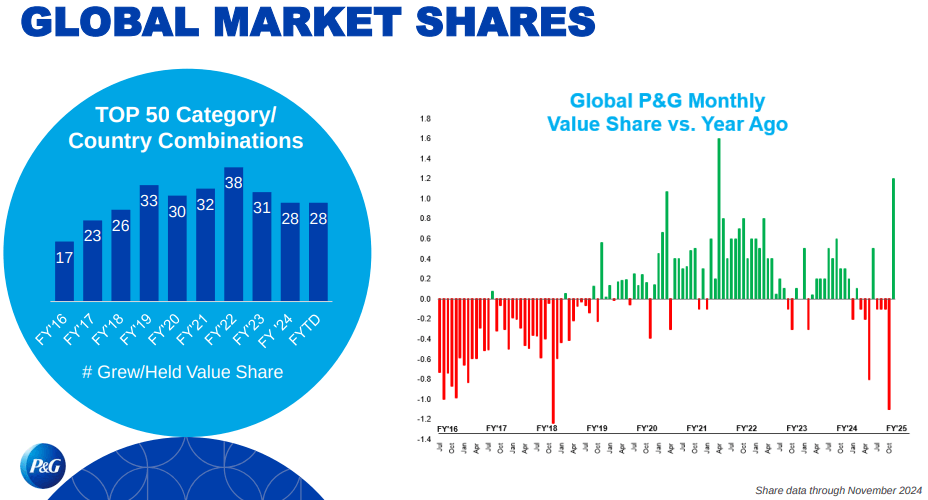
Procter & Gamble (P&G) delivered a solid performance in Q2 2025, with organic sales growth of 3%, driven by a 2% volume increase and a 1% mix improvement. Revenue growth was broad-based, with nine out of ten product categories showing positive organic sales growth. Family Care led with double-digit growth, while Home Care and Skin and Personal Care grew in the mid-single digits. Baby Care was the only category to decline, down low single digits. Geographically, North America saw a 4% organic sales growth, supported by strong volume growth, while Europe-focused markets grew 4% as well. Greater China, however, declined by 3%, though this marked an improvement from the 15% decline in the previous quarter. P&G maintained or grew market share in 28 of its top 50 category-country combinations, reflecting its competitive strength.
Source: Q2-FY-2025-Earnings-Slides
Operational Performance
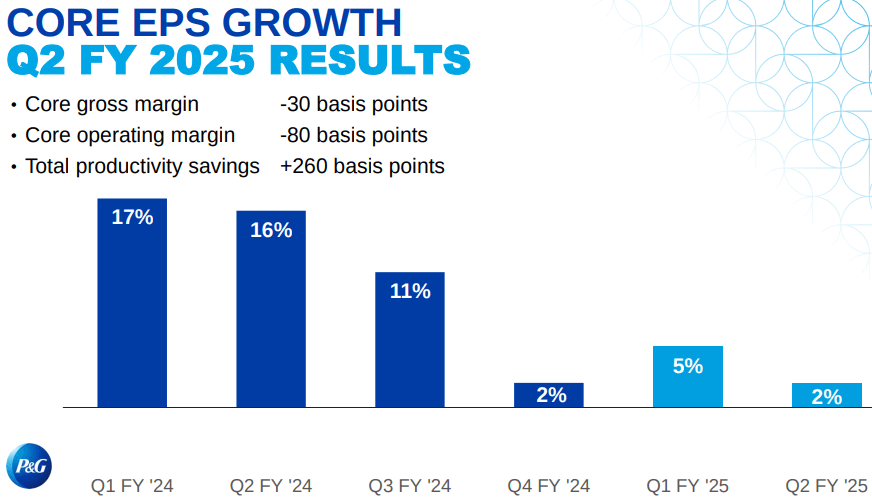
Core EPS rose 2% to $1.88, or 3% on a currency-neutral basis. However, core gross margin declined by 30 basis points, and core operating margin fell by 80 basis points, partly due to a $0.02 per share impact from transportation disruptions. Despite these challenges, P&G achieved a 260-basis-point productivity improvement and returned $4.9 billion to shareholders through dividends and share repurchases. Adjusted free cash flow productivity stood at 84%, underscoring the company's strong cash generation capabilities.
Source: Q2-FY-2025-Earnings-Slides
Technological Advancements and Innovations
P&G continued to innovate, with notable product launches such as Charmin Smooth Tear, Dawn Powerwash, and Oral-B iO series, which drove market share gains. The company also expanded its presence in emerging categories like whole-body deodorants and plant-based insect repellents. These innovations, coupled with strategic partnerships and investments in R&D, reinforced P&G's market leadership. Despite these challenges, P&G remains committed to its integrated strategy, focusing on product superiority, productivity improvements, and shareholder returns, positioning itself for sustained growth in a volatile economic environment.
B. PG Stock Price Performance
Procter & Gamble's (PG) stock price performance in the quarter showed a decline of 3.20%, closing at $167.65 from an opening price of $173.24. The stock experienced significant volatility, with a high of $180.43 and a low of $159.81, reflecting broader market uncertainties. Despite its substantial market cap of $380.86 billion, PG underperformed compared to major indices: the S&P 500 rose 2.07%, and the NASDAQ gained 4.74%. This underperformance highlights investor caution amid macroeconomic challenges, though PG's strong fundamentals and institutional support provide a foundation for potential recovery.
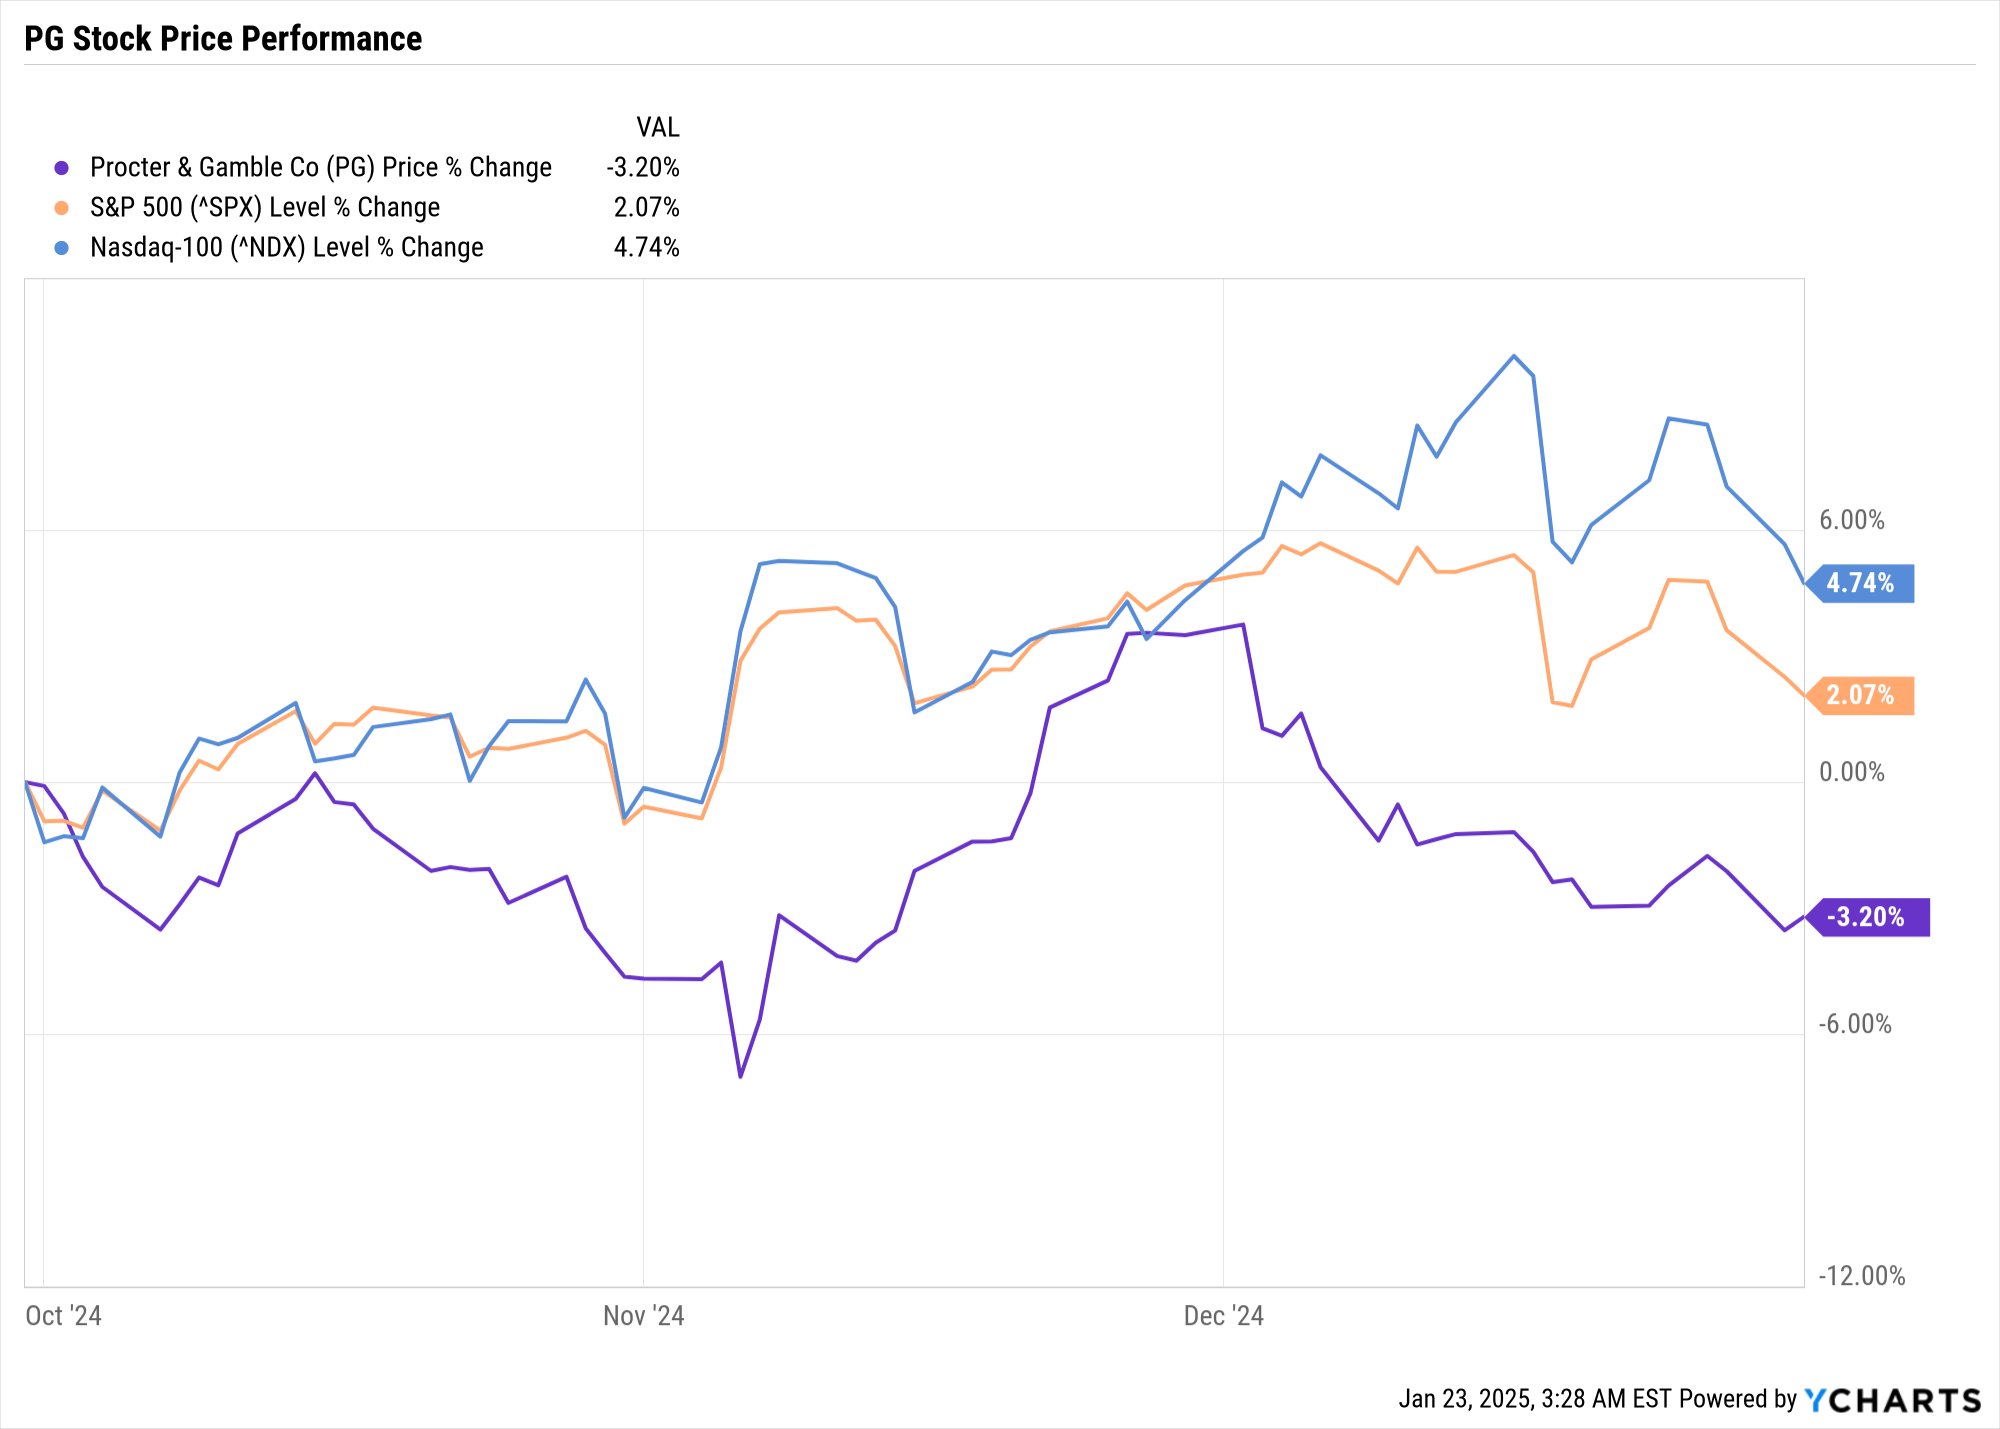
Source: Ycharts
II. PG Stock Forecast: Outlook & Growth Opportunities
A. Segments with growth potential
Procter & Gamble (P&G) demonstrates strong growth potential across several key segments, driven by innovation, market share gains, and strategic initiatives. In Q2 2025, Family Care led with double-digit organic sales growth, while Home Care and Skin and Personal Care grew in the mid-single digits. Personal Healthcare, Hair Care, Oral Care, Feminine Care, Fabric Care, and Grooming also saw low-single-digit growth, reflecting broad-based demand. Notably, P&G's focus on premium products, such as Charmin Smooth Tear and Dawn Powerwash, has driven market share gains in the U.S., with Charmin's value share growing significantly. The company's expansion into emerging categories, like whole-body deodorants and plant-based insect repellents under the Zevo brand, further underscores its ability to capitalize on evolving consumer trends. Additionally, P&G's Oral-B iO series and Crest 3D White Deep Stain Remover are gaining traction, with early trial results showing strong consumer adoption.
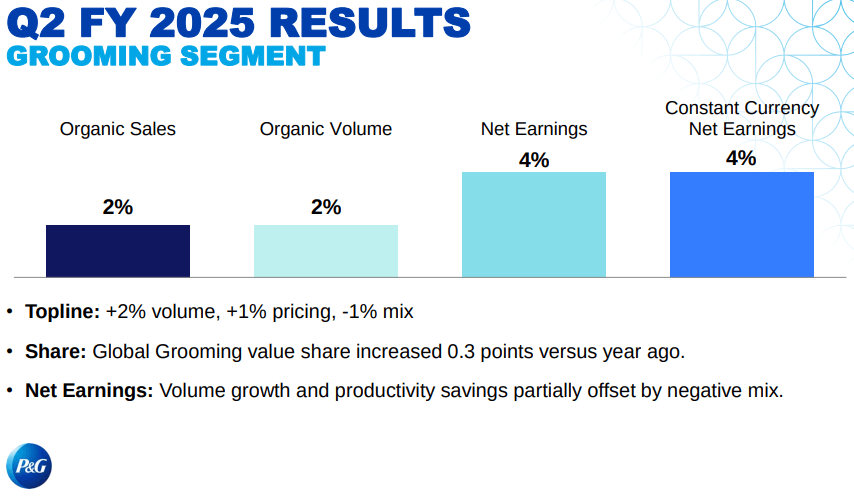
Source: Q2-FY-2025-Earnings-Slides
Geographically, North America remains a robust growth driver, with organic sales up 4% in Q2 2025, supported by consistent volume growth over the past six quarters. Europe-focused markets also grew 4%, driven by volume increases, while Greater China showed signs of recovery, with a 3% decline marking an improvement from the 15% drop in the previous quarter. P&G's strategic focus on premium skincare brand SK-II, which grew 5% in Greater China during key shopping events like 11-11, highlights its ability to navigate challenging market conditions.
B. Expansions and strategic initiatives
P&G's growth strategy is underpinned by significant investments in innovation and productivity improvements. The company has launched over 20 major innovations in the past year, including Tide EVO, which exceeded performance goals in its test market, and Swiffer PowerMob, which drove 40% brand portfolio growth. These innovations are supported by a three-year cost-savings master plan, enabling P&G to reinvest in product superiority and mitigate cost pressures. The company's commitment to returning $16 billion to $17 billion to shareholders in fiscal 2025 through dividends and share repurchases further reinforces its financial discipline and confidence in long-term growth.
Despite headwinds like a $300 million foreign exchange impact and $200 million in commodity cost pressures, P&G's integrated strategy positions it well to deliver 3%-5% organic sales growth and 5%-7% core EPS growth in fiscal 2025. By leveraging its strong brand portfolio, innovation pipeline, and operational efficiency, P&G remains poised to capitalize on growth opportunities in both established and emerging markets.
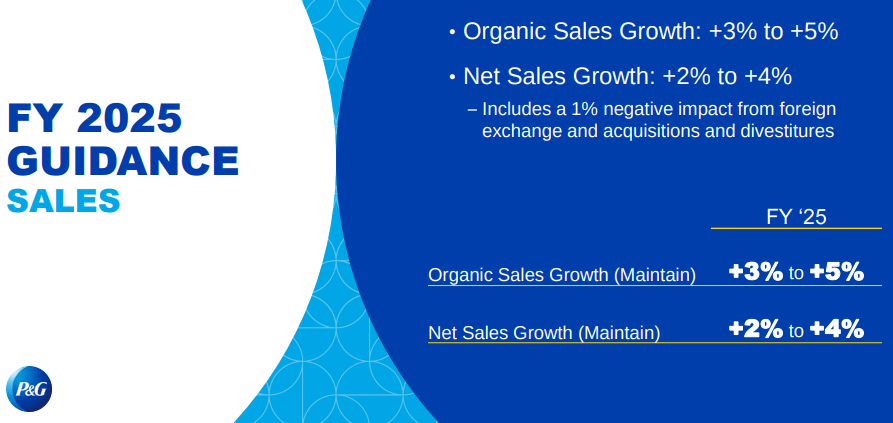
Source: Q2-FY-2025-Earnings-Slides
III. PG Stock Forecast 2025
A. PG Stock Price Forecast: Technical Analysis
Procter & Gamble's (PG) stock forecast for 2025 reflects a mix of technical, fundamental, and market sentiment analyses, providing a comprehensive outlook for investors. From a technical perspective, PG's current price of $164.74 is below its trendline and baseline of $169.35, indicating potential for upward movement. The average PG target price for 2025 is $192.05, based on momentum and Fibonacci retracement/extension levels. Optimistic scenarios project a rise to $212.75, driven by strong upward momentum, while pessimistic scenarios suggest a drop to $145.77 if downward trends persist. The Relative Strength Index (RSI) of 45.84, trending upward, signals neutral momentum, with no clear bullish or bearish divergence, suggesting balanced market conditions.
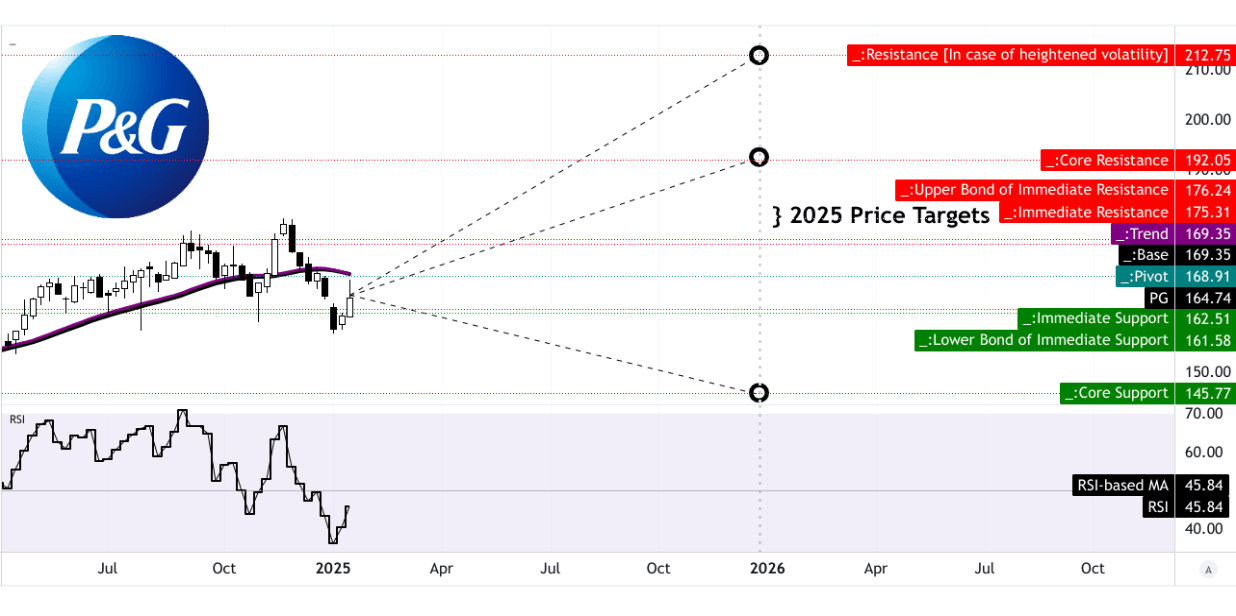
Source: tradingview.com
B. Procter and Gamble Stock Forecast: Fundamental Analysis
Fundamentally, PG's valuation metrics highlight its premium positioning. The non-GAAP P/E ratio (TTM) of 24.17 is 43.49% higher than the sector median, reflecting investor confidence in its earnings stability. Forward-looking metrics, such as the non-GAAP P/E (FWD) of 23.33 and PEG ratio of 3.45, further underscore PG's growth potential, albeit at a premium compared to peers. The GAAP P/E ratios (TTM: 27.9, FWD: 23.8) also indicate strong earnings expectations, though they remain above sector medians. These metrics suggest PG is trading at a premium, justified by its consistent performance and market leadership.
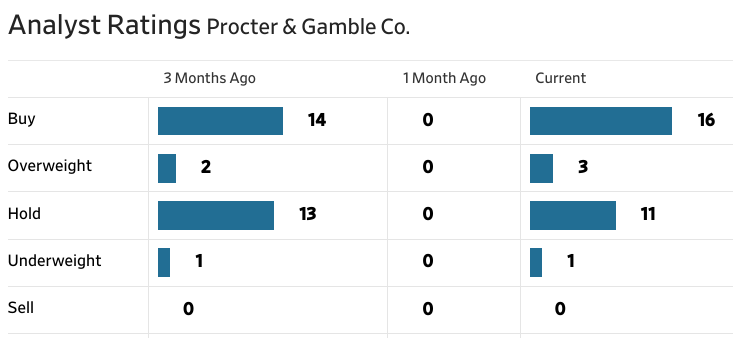
C. P&G Stock Forecast: Market Sentiment
Market sentiment remains largely positive, with 58% of analysts recommending a “buy” and 39% suggesting a “hold.” The median 12-month price target of $183.00 implies an 11.08% upside, while the high target of $209.00 suggests a 26.87% potential gain. Institutional holdings and investor confidence remain robust, supported by PG's strong dividend history and consistent cash returns to shareholders. Short interest is minimal, reflecting low bearish sentiment. Overall, PG's stock forecast for 2025 is optimistic, driven by technical momentum, solid fundamentals, and favorable market sentiment, though investors should remain cautious of macroeconomic and geopolitical risks.
Source: CNN.com
Source: WSJ.com
Investor confidence in Procter & Gamble (PG) remains strong, with institutional ownership at 67.45%, representing $261.7 billion in holdings. Short interest is minimal at 0.73% of shares outstanding, with only 2.5 days to cover, indicating low bearish sentiment. This reflects robust institutional trust and a stable outlook, supported by PG's consistent performance and strong market position.
Source: benzinga.com
Source: nasdaq.com
IV. PG Stock Forecast: Challenges & Risk Factors
Procter & Gamble Competitors
Procter & Gamble (P&G) faces significant competitive pressures and risks that could impact its market share and stock performance. Key competitors such as Unilever, Colgate-Palmolive, and Kimberly-Clark continue to challenge P&G in core categories like personal care, home care, and baby products. For instance, Unilever's aggressive innovation in skincare and sustainability initiatives poses a threat to P&G's market share in beauty and personal care. Similarly, Colgate-Palmolive's stronghold in oral care and Kimberly-Clark's dominance in tissue and hygiene products create intense competition, particularly in North America and Europe. These competitors are also leveraging digital transformation and e-commerce to capture consumer attention, forcing P&G to continuously innovate and invest heavily in marketing and R&D.
Other Risks
Beyond competition, P&G faces several other risks. Currency volatility remains a significant headwind, with a $300 million after-tax impact expected in fiscal 2025, primarily affecting the second half of the year. Commodity cost pressures, though somewhat stabilized, could resurge, particularly in oil-based raw materials, impacting margins. Geopolitical tensions, especially in regions like the Middle East and Greater China, add uncertainty to market recovery and growth prospects. For example, while P&G saw a 3% decline in Greater China in Q2 2025, underlying market conditions remain soft, and a full recovery is not guaranteed. Additionally, supply chain disruptions, such as the two-week outage of P&G's global transportation management system in Q2, highlight operational vulnerabilities that could recur.
Source: Q2-FY-2025-Earnings-Slides
Consumer behavior also presents risks. While P&G's categories are largely non-discretionary, softening consumer confidence in key markets like the U.S. and Europe could dampen demand. Private-label competition, though currently flat or declining, remains a threat if economic conditions worsen. Finally, P&G's reliance on innovation to drive pricing power and mix improvements carries execution risks, as not all product launches may resonate with consumers. For example, while SK-II showed a 5% growth in Greater China, other skincare innovations have struggled to gain traction. These challenges underscore the need for P&G to maintain agility and continue investing in its integrated strategy to mitigate risks and sustain growth.
Overall, Procter & Gamble's (PG) stock outlook for 2025 remains cautiously optimistic, supported by 3% organic sales growth, strong fundamentals, and a robust innovation pipeline. Despite a 3.20% stock price decline in Q2 2025, PG's institutional ownership (67.45%) and minimal short interest (0.73%) reflect strong investor confidence. Analysts project a median price target of $183.00, with 58% recommending a “buy.” For traders, PG stock CFDs offer an opportunity to capitalize on price volatility without owning the underlying asset, leveraging P&G's market leadership and growth potential while managing risks through strategic trading.