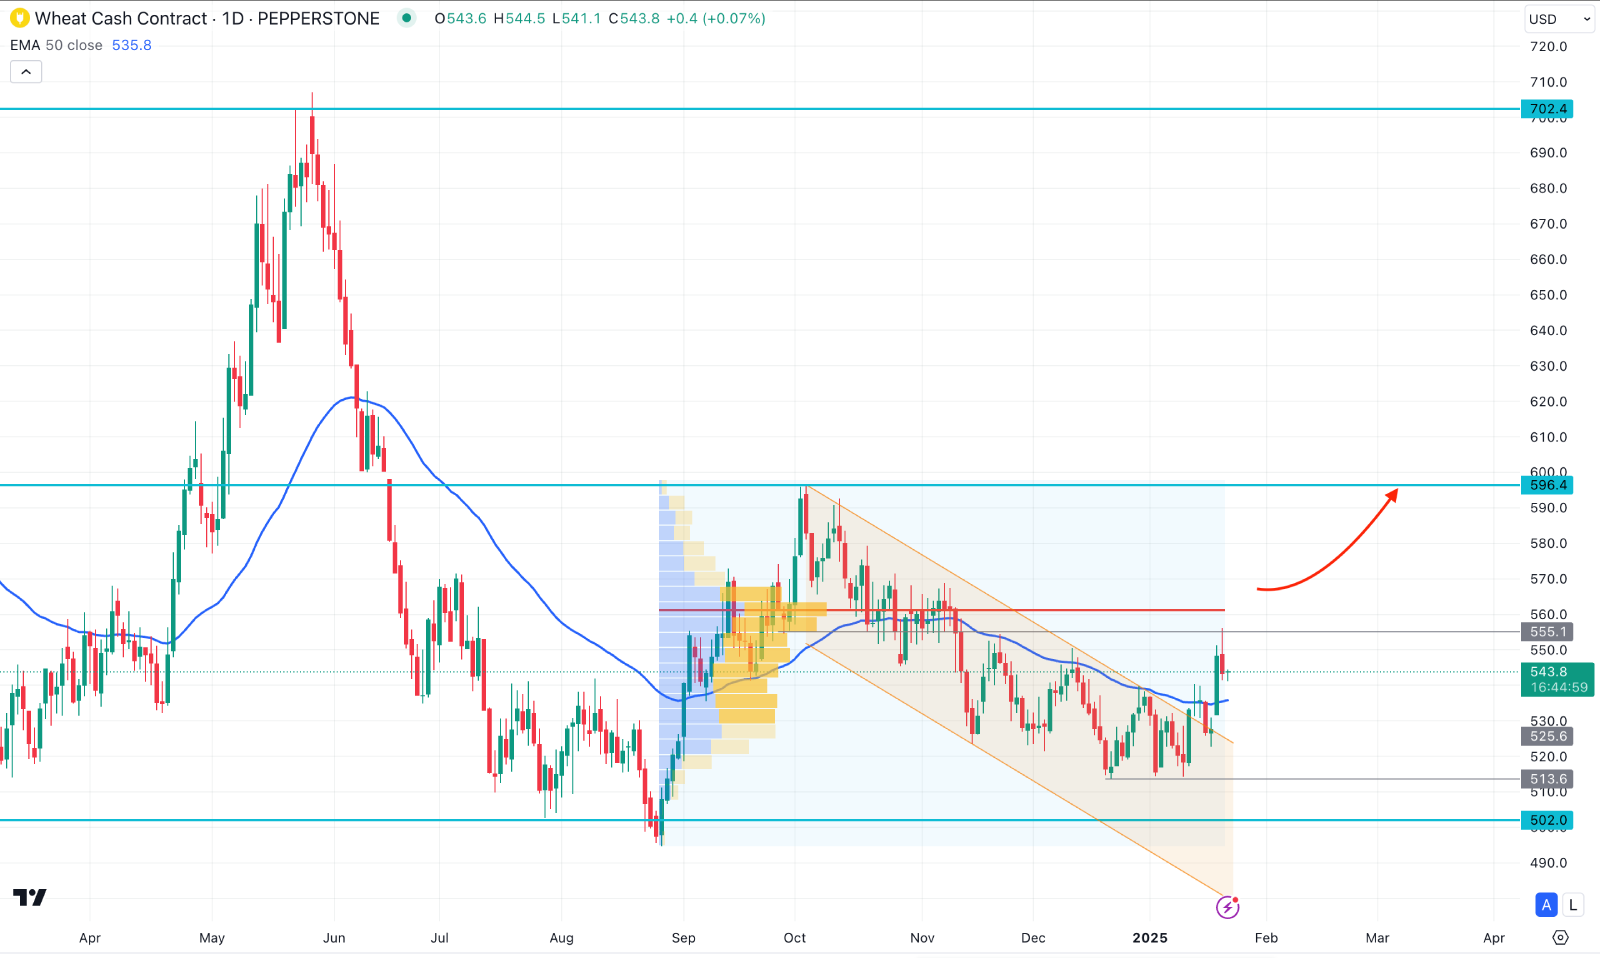
In order to offer some assistance, wheat price rose in each of the three marketplaces while the US dollar index dipped. As a result, the price showed a potential price pattern, which could attract technical traders to open long positions at lower prices.
Wheat Weekly Export Report
According to data from weekly export assessments, 261,786 MT (9.62 mbu) of wheat was shipped during the week of January 16. That was a decrease of 16.94% from the corresponding week in 2024 and 12.5% over the previous week.
With 48,992 MT, Mexico was the most popular destination, followed by South Korea with 45,071 MT. Shipments for the current marketing year total 13.279 MMT (487.9 mbu), a 23.83% gain over the previous year.
With 30,793 MT of US wheat specifically, Japan has filed an offer of wheat for 126,893 MT from the United States, Canada, and Australia. The European Commission estimated that wheat exports from July 1 to January 19 were 11.74 MMT, a decrease of 6.75 MMT from the previous year.
How Could Wheat Respond To Trump Tariff?
Market participants seemed to put aside the expectation that the Trump administration would soon impose additional tariffs.
Rather, traders seem to be adjusting to a new normal in which contradictory signals are issued regarding specific topics and actions. For example, the president has proposed 25% tariffs targeting Canada and Mexico starting in February, but there are no executive actions to backup this proposal.
According to a report by a renowned Brokerage, fund traders shifted into long commodity futures after an interaction between Trump and Chinese President Xi. It is the idea that an additional trade war between the two countries isn't necessarily imminent.
Wheat Price Technical Analysis

In the daily chart of WHEAT prices, the most recent price showed a bullish channel breakout after maintaining a sideways momentum. Primarily, it signals a potential breakout possibility where the high volume line is at the 560.00 level.
In the major structure, a bullish breakout is visible as the dynamic 50-day EMA came below the current price, signaling a confluence of bullish pressure.
In this context, the price is still trading at the discounted area, from where a bullish recovery is possible. However, an upward continuation with a daily candle above the 555.10 resistance level could validate the long signal.
On the bullish side, the immediate resistance is at the 596.40 level, which might be a remarkable achievement before reaching the 702.40 level.
On the other hand, a failure to hold the price above the 50 day EMA with an immediate selling pressure below the 513.60 level could extend the selling pressure towards the 500.00 level.


