As Meta Platforms (META) releases its financial statements for the quarter that ended in December 2024, Wall Street anticipates generating more money than it did the previous year due to stronger revenues.
META Earnings Projection
In its next report, the social networking firm is anticipated to announce quarterly profits of $6.84 per share, a +28.3% change from the previous year.
The revenue is anticipated to come at $47 billion, a 17.2% increase over the previous quarter.
This month, the average EPS projection has increased by 1.89% to its present level. This reflects the covering experts' combined reevaluation of their initial predictions throughout this time.
META Earnings History Analysis
Meta Platforms was anticipated to release profits of $5.19 each share for the most recent reported period, but instead, it recorded earnings of $6.03, generating a +16.18% surprise.
The company has exceeded consensus EPS projections four times in the past four quarters. So, the company is likely to maintain the momentum, following the upbeat projection. But investors should monitor how the actual number comes before anticipating the stock price.
META Key Metrics Analysis
Meta Platforms currently trades at a Forward Price/Earnings ratio of 24.13, which indicates its valuation. This represents a price reduction to the industry median Forward P/E of 29.01.
We might also note that META's PEG ratio is 1.16. The PEG ratio accounts for the stock's predicted rate of earnings rise. At the moment, a typical PEG ratio for the Internet software sector was 2.19.
Meta Stock Forecast Technical Analysis
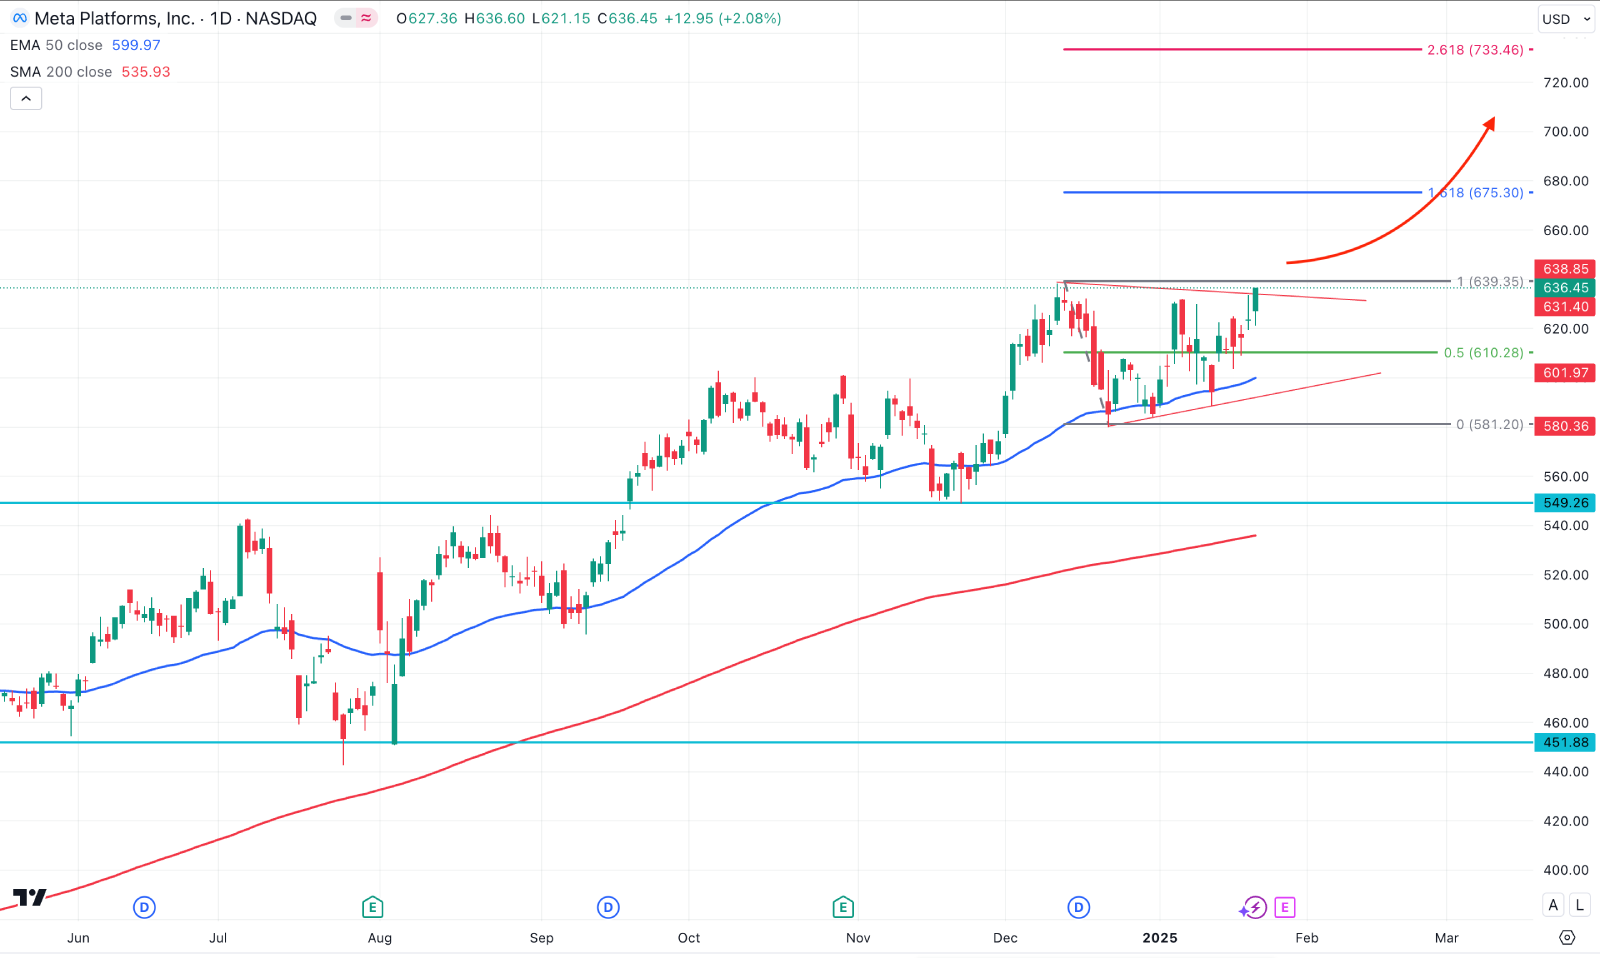
In the daily chart of META stock price, the extended bullish pressure is clear as the price keeps moving higher from the left to right. Moreover, the most recent price is hovering within a triangle pattern from where a bullish breakout could resume the existing trend.
In the major structure, the 200 day SMA is the key support level, which is way below the current price. Moreover, the 50 day EMA is the immediate support, working as a bullish pre-breakout momentum.
Primarily, a trend continuation from the triangle resistance could happen, which could extend the gain towards the 675.30 level, which is a crucial Fibonacci Extension level. Overcoming this line might take the price above the 700.00 psychological line.
On the bearish side, the sideways momentum at the record high price could result in a trend reversal after wiping out burying momentum. In that case, a bearish exhaustion with a daily candle below the 50 day EMA might extend the loss towards the 200 day SMA area.
