Can Hang Seng Index (HK50) Move Higher From the Valid Breakout?
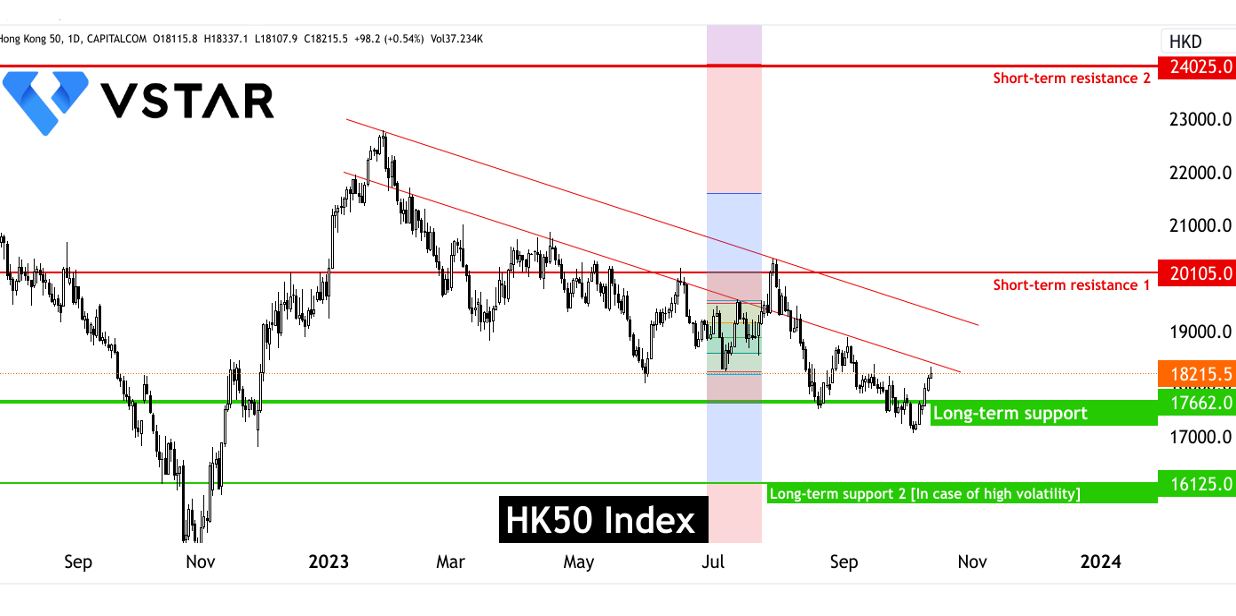
In the daily chart of HK50, a massive buying pressure is seen taking the price to a multi-month high. A bullish breakout has initiated a trend change, supporting buyers momentum.
How to Trade Hang Seng Index HK50
Indices analysis for the Hang Seng Index HK50 including impacting factors, trading ways, trading strategies, and benefits.
Improved US-China Relations: A Catalyst for HK50 Bullish Sentiment
Recent Events and Fundamental Factors Propelling the Bullish Outlook for the HK50 Index in the Context of Evolving US-China Relations.

Market Wrap & Trading Signals Today! -06/05/2023
On Friday, U.S. stocks advanced for a second consecutive session. The Dow Jones Industrial Average jumped 701 points (+2.12%) to 33,762, the S&P 500 rose 61 points (+1.45%) to 4,282, and the Nasdaq 100 climbed 105 points (+0.73%) to 14,546.

Market Wrap & Trading Signals Today! -06/02/2023
U.S. WTI crude futures rebounded $2.00 to $70.05 a barrel. The U.S. Energy Department reported an addition of 4.49 million barrels in crude-oil stockpiles (vs a reduction of 1.39 million barrels expected). Gold price rose $14 to $1,977 an ounce.
Market Wrap & Trading Signals Today! -06/01/2023
On Wednesday, U.S. stocks closed lower on the last trading day of May. The Dow Jones Industrial Average fell 134 points (-0.41%) to 32,908, the S&P 500 dropped 25 points (-0.61%) to 4,179, and the Nasdaq 100 slid 100 points (-0.70%) to 14,254.

Market Wrap & Trading Signals Today! -05/31/2023
On Tuesday, despite a strong opening, U.S. stocks closed in mixed territory. The Nasdaq 100 rose 56 points (+0.40%) to 14,354, while the S&P 500 was unchanged at 4,205, and the Dow Jones Industrial Average fell 50 points (-0.15%) to 33,042.

Market Wrap & Trading Signals Today -05/30/2023
On Monday, U.S. markets were closed for the Memorial Day holiday. This morning (Tuesday), U.S. stock index futures opened broadly higher.
Market Wrap & Trading Signals Today! -05/29/2023
Check today's market wrap and trading signals of main instruments, These are starting points for your own research to identify opportunities that make sense for you.
Your Complete Guide to Trading HK50: From Analysis to Execution
Looking to understand trading the HK50? Learn about diversifying your portfolio by trading in Hong Kong.