Qualcomm (QCOM) declined 3.64% in the prior month, less than the 0.01% loss of the Computer and Technology industry and the 0.97% loss of the S&P 500. Investors should monitor how the price reacts on the upcoming earnings report, which could open a decent investment opportunity.
QCOM EPS Forecast
Investors and analysts will closely monitor Qualcomm's performance in its next earnings release. On November 6, 2024, the company is scheduled to release its earnings report to the public. The company anticipates reporting EPS of $2.56, up 26.73% from the previous year's quarter. Our most recent consensus projection predicts earnings of $9.9 billion, up 14.69% from the same quarter last year.
Over the last 30 days, the median EPS predicted for the quarter has increased by 0.3%, reflected in the current level. This illustrates how the stock analysts have revalued their original forecasts together.
Analysts Opinion On QCOM
Looking at analyst forecasts for a few of the company's key metrics can often help one better understand the quarter's performance, even though investors usually depend on consensus revenue and earnings estimates.
Investors may have noticed recent revisions to analyst projections for Qualcomm. These projections usually reflect the most recent short-term economic trends, which are subject to change regularly. Therefore, positive changes in predictions mean that analysts are optimistic about the company's operations and profitability.
In its next release, Wall Street experts predict Qualcomm (QCOM) will report quarterly revenue of $2.56 per share, representing a 26.7% rise from the previous year. Revenues are projected to reach $9.9 billion, a 14.7% increase over the same quarter last year.
Revisions to earnings projections must be considered before an organization's profit announcement. This is a useful indicator for forecasting possible stock-related investor actions. Empirical investigations have shown that a stock's short-term price growth and trends in profit forecast revision are strongly correlated.
QCOM Stock Forecast Technical Analysis
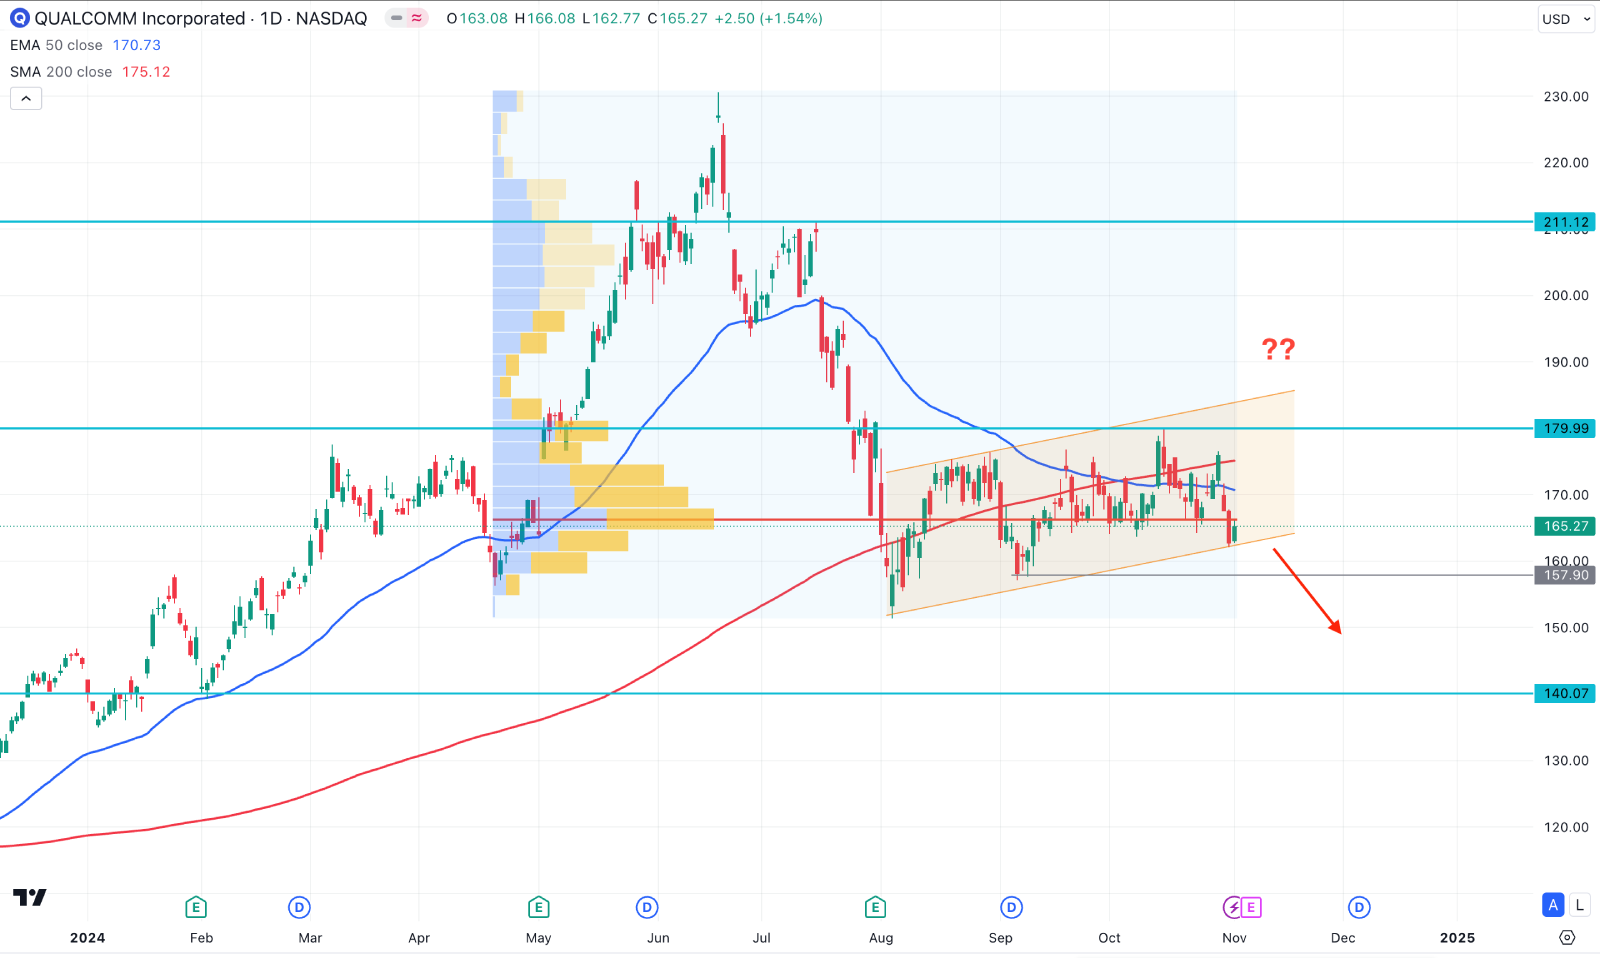
In the daily chart of QCOM stock price, the bearish momentum is visible as the recent price hovers below the 200-day SMA line. Moreover, the ascending channel formation after a selling pressure indicates that bears hold their position for more gains.

In the volume structure, the high volume line hovers at the current price line, with congestion. Moreover, the near-term price action is also bearish as the recent 50-day EMA is above the current price, working as a crucial resistance.
Based on this outlook, a valid bearish reversal with a daily candle below the 157.90 support line could lower the Qualcomm stock price toward the 130.00 area. However, a solid bullish reversal above the 200-day SMA could invalidate the current momentum and open a long opportunity, aiming for the 211.12 level.


