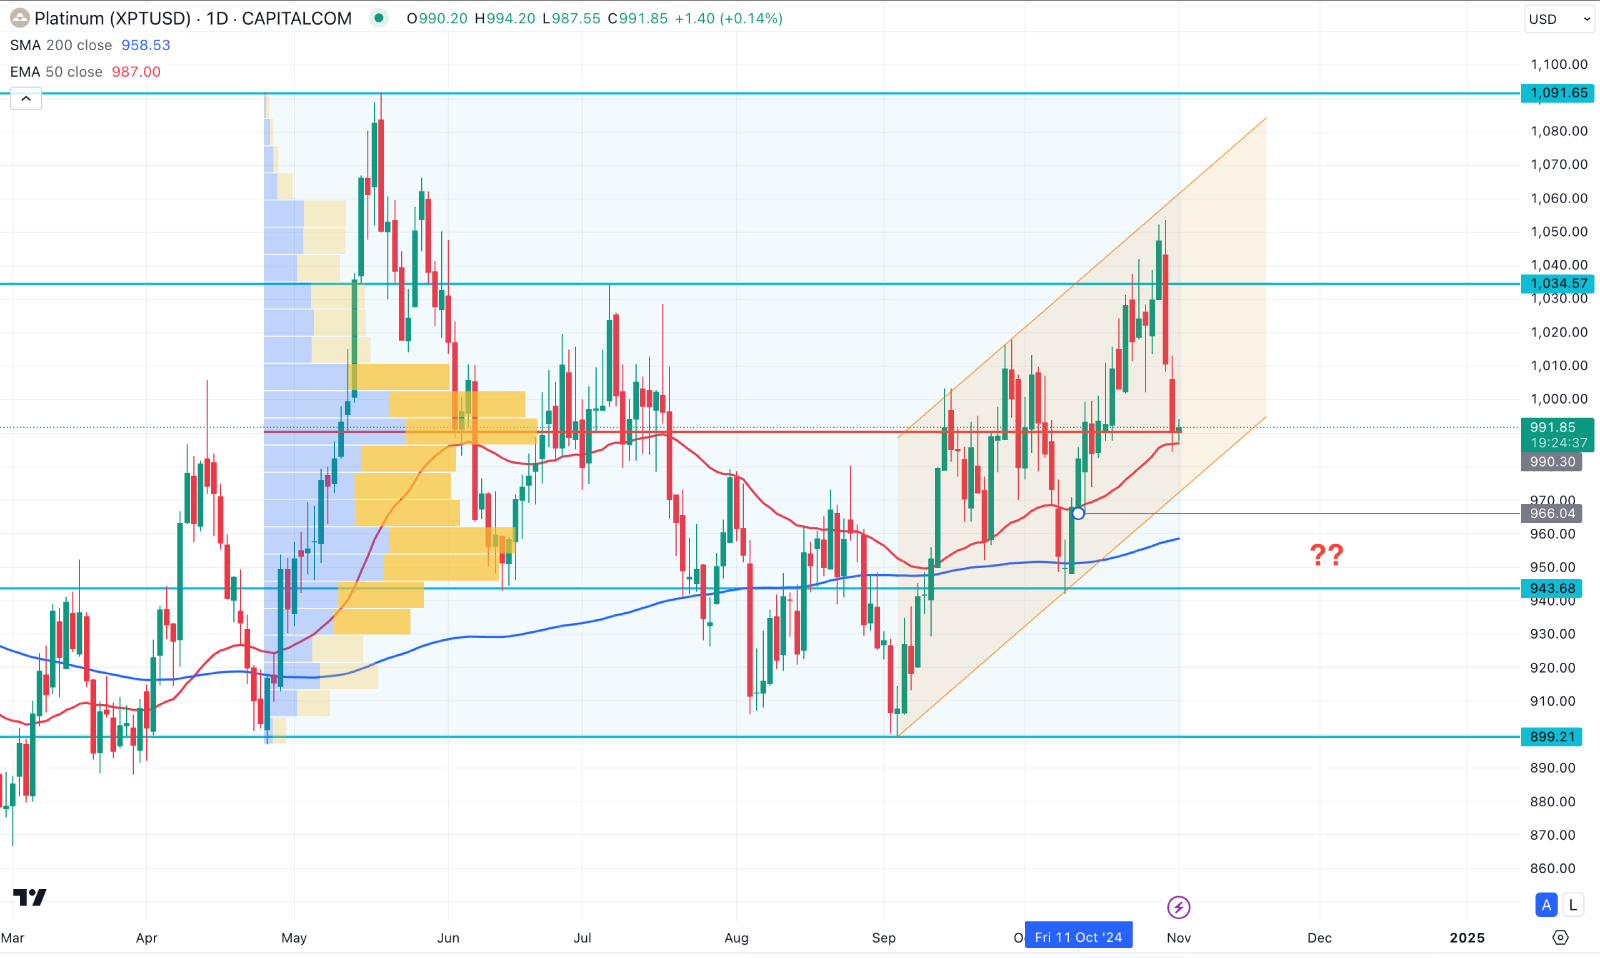
As investors went on to evaluate the prospect of reduced supply, platinum futures benefited from the gold price rally and its positive effect on bullion prices, rising to more than $1,030 per troy ounce by the end of October, its highest level since May.
Why Is the Platinum Price Rising?
Halfway towards the year's last quarter, bullion prices were supported by widespread demand for safeguarding and significant purchases of precious metals by significant central banks, despite the prospect of a less dovish Federal Reserve the following year.
Meanwhile, industry reports predict a 2% decline in overall mined supply in 2024 due to decreased production in South Africa, which also helped to support prices.
Given the continued substantial need for platinum for catalytic converters in the motor vehicle sector, the supply shortage from the previous year is anticipated to be prolonged.
US Dollar Index (USDX) Outlook
Following the announcement of recent economic data, the US Dollar Index (USDX), which compares the worth of the US dollar to a basket of six other currencies, saw a decline. Although the September ADP Employment Change reveal surpassed market projections in October, the USD plummeted due to a decrease in revision in the Q3 GDP growth.
Investors are still wary, though, in anticipation of Friday's Nonfarm Payrolls (NFP) findings, which might present an alternative labor market picture. As per the current projection, the anticipated Nonfarm Payroll is 106K, which is lower than the previous report of 254K.
Platinum Price Technical Analysis
In the daily chart of Platinum, volatility is visible where the current price is trading below the 1000.00 psychological line. Primarily, an ascending channel is visible, from where the immediate trend line support could be a crucial barrier for sellers.

In the volume structure, the price of Platinum is facing immediate support from the high volume line, which is at the 992.00 level. As the current price hovers above this line, we may expect a buying pressure to come.
In the broader context, the 200-day Simple Moving Average hovers below the 966.02 static support level, suggesting a major bullish trend. The 50-day EMA follows the same path, remaining below the high volume line.
Based on the current market context, a bullish reversal from the 970.00 to 943.34 zone could be a potential buy zone. Therefore, a valid bullish price action could open a long opportunity, aiming for the 1091.64 resistance level.
The alternative trading approach is to find a selling pressure below the 200-day Simple Moving Average line. In that case, a bearish daily candle below the 943.68 level could validate the bearish continuation, aiming for the 850.00 psychological line.


