Charles Hoskinson, the founder of Cardano, made a visionary declaration that hinted at the time frame on which a country would operate on Cardano. This statement was highlighted by Cardano creator Input Output Global (IOG). Hoskinson predicts that a nation-state will operate on the distributed ledger Cardano by 2030, hinting at significant advancements in the following six years.
Can Cardano Hard Fork Affect The ADA Price?
The Chang hard fork #1 was successfully implemented on September 1, 2024, marking a significant milestone in Cardano's progress toward decentralized leadership.
Cardano would fully transform into Voltaire's age with the second ruled Chang hard fork. According to the current roadmap, a crucial stage in the growth of Cardano's governance will begin in November 2024 when the Chang upgrade process starts, followed by a trial of Cardano node v10 for assessment.
An excerpt from Charles Hoskinson, the founder of Cardano, talking about the Chang expansion, its importance to Cardano, and the potential future it may bring was recently posted on Input Output Global's blog.
ADAUSD Onchain Metrics Analysis
The present state of the Cardano market indicates a possible difficulty, particularly for short-term investors. According to the current MVRV Long/Short distinction, a measure of market profitability, short-term users are currently profitable. These individuals are more likely to trade during market turbulence and usually hold resources for a month or less.
Their profitability is highlighted by extremely low values based on the MVRV Long/Short distinction, which also indicates a higher chance of selling pressure and could further undermine ADA's price security. An upsurge of short-term selling could halt any prospective gain, particularly if ADA's price doesn't pick up steam again.
ADA Price Prediction Technical Analysis
In the daily chart of ADAUSD, the current market price remains sideways after massive selling pressure. Also, a bearish Symmetrical Triangle breakout is visible, with the current Cardano price hovering below the triangle resistance.
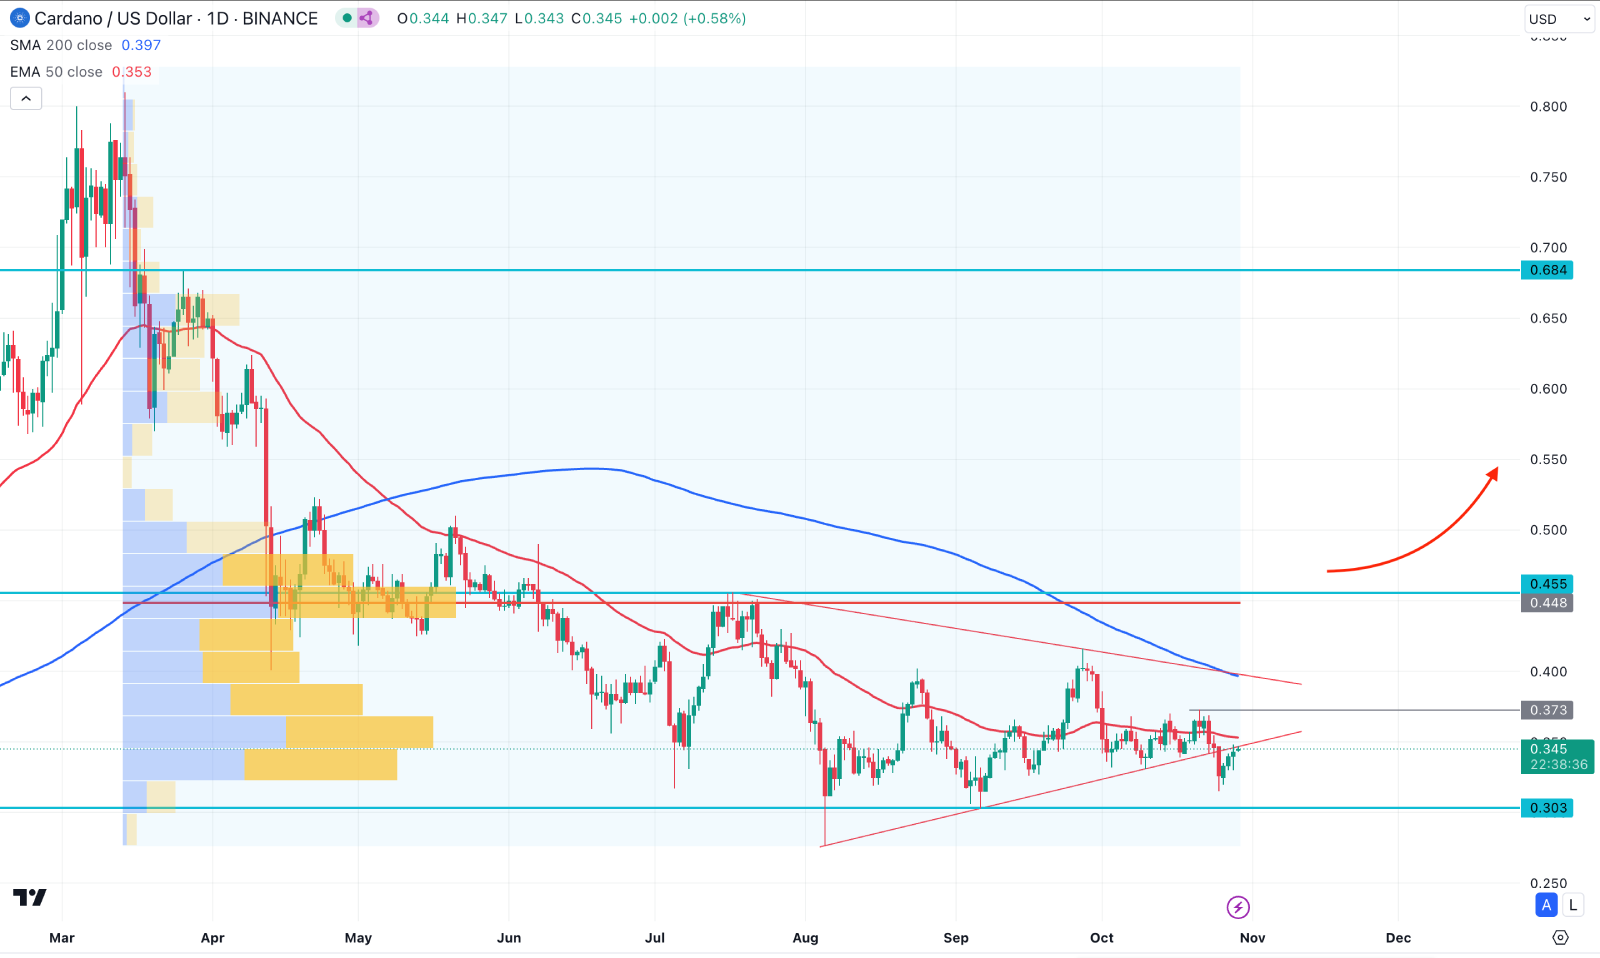
In the broader context, the bearish momentum is potent, as the 200-day Simple Moving Average has a bearish slope, while the 50-day EMA is the immediate resistance.
In the volume structure, the most active level since March 2024 is at the 0.448 level, which is above the 200-day SMA. As the most recent price grabbed sell-side liquidity from the Triangle support, decent buying pressure might come after making a new swing high.
Based on this structure, a bullish continuation with a daily close above the 0.455 high could initiate a market reversal aiming for the 0.684 level.
On the other hand, a failure to move above the 200 day SMA could signal strong sellers presence in the market, opening the room for reaching below the 0.3000 level.
