The USDCAD pair is trading close to its highest point since August 5 in the 1.3920–1.3925 range, and it appears ready to continue its current upward trajectory observed throughout the previous month or so. The Canadian dollar (CAD) may continue to be impacted by several factors, which confirm the currency pair's short-term optimistic outlook when combined with the appearance of certain USD dip-buying.
BOC Governor on Canadian Dollar (CAD)
Governor Tiff Macklem of the Bank of Canada (BoC) seemed dovish when he stated that if population growth in Canada slows down more quickly than anticipated, the overall GDP will fall lower. Additionally, Macklem reaffirmed to the House of Commons financing group on Tuesday that if the global economy developed generally as anticipated, the central bank could lower rates even further. Furthermore, the recent decline in crude oil costs, brought on by worries about slowing global demand expansion, is thought to be hurting the commodity-linked Loonie and driving the USDCAD pair lower.
Fed's Anticipation on The Rate Cut
As it becomes more widely accepted that the Federal Reserve (Fed) will continue implementing smaller rate reductions, the US dollar (USD) draws some dip-buying. It halts the previous day's slight decline from its highest point since July 30.
In addition, worries that Republican candidate Donald Trump and Vice President Kamala Harris' expenditure plans will result in a larger deficit continue supporting high US Treasury bond yields. This implies that the course of the lowest resistance for the USDCAD pair is upward, which supports the outlook for additional USD appreciation.
Economic Releases To Look At
Before important US macro releases, such as the Advance Q3 GDP print and the ADP survey of private-sector jobs, traders may decide to stay out of the market and avoid placing hostile bets.
The market will then focus on the highly anticipated US Nonfarm Payrolls (NFP) data release on Friday and the US Personal Consumption Expenditure Index of Prices on Thursday. The information should offer new insights into the Federal Reserve's interest rate perspective, which will impact the structure of the USD price and help predict the USDCAD pair's following leg of an oriented move.
USDCAD Technical Analysis
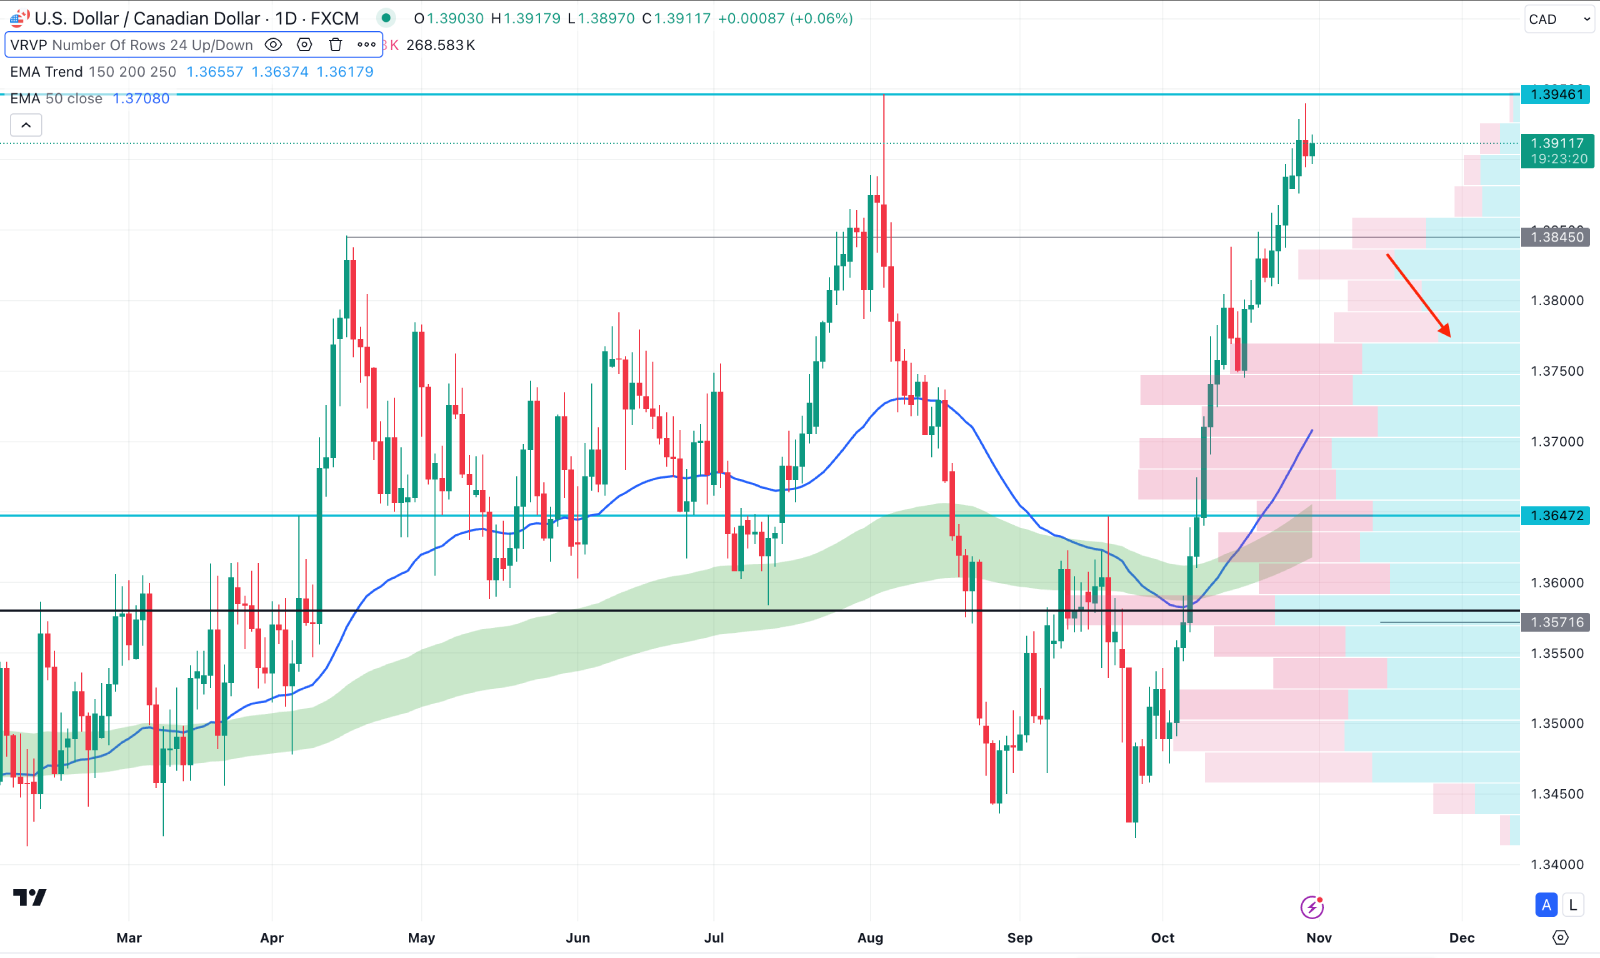
In the daily chart of USDCAD, the recent price showed massive bullish pressure, reaching the crucial supply zone as shown in the above image.

The bullish impulsive momentum with a sell-side liquidity sweep greeted a gap between the price and the visible range high volume line. It is a sign of a bullish overextension from which a bearish correction might come as a mean reversion.
On the other hand, the Moving Average wave consisting of MA 150 to 250 is below the dynamic 50-day EMA with a bullish slope. It is a sign that the major market momentum is still bullish, from where a continuation is possible.
Based on the daily market outlook for USDCAD, a downside correction is possible as long as the current price trades below the 1.3946 resistance level. In that case, a bearish daily candle below the 1.3845 static line could initiate a downside correction towards the 1.3647 level.


