


EURUSD
Fundamental Perspective
EURUSD has sustained its gains for the third consecutive week, reaching the 1.0900 level for the first time since early June. This upward momentum has been primarily fueled by a weakened Dollar, with the US Dollar Index (DXY) hitting five-week lows around 104.00.
Investors now anticipate that the Federal Reserve will cut interest rates twice this year, a shift from the previously expected single reduction. This expectation change follows lower-than-forecast June CPI figures and a cooling labor market, intensifying rate-cut speculation.
Meanwhile, the European Central Bank has maintained a primarily silent stance. Dutch central bank Chief Klaas Knot suggested that while no rate cuts are expected this month, the September meeting could be open to such a move. ECB Governing Council member Fabio Panetta indicated that gradual rate reductions could continue without disrupting the current decline in inflation.
Despite the recent strength of the EUR, driven by weakness in the dollar, the underlying robustness of the US economy suggests this trend may be temporary. The US is likely heading toward a soft landing, and the Dollar's current weakness may soon give way to a rebound, especially with the potential political shifts on the horizon.
EURUSD Forecast Technical Perspective
The last weekly candle closed as solid green, posting three consecutive gaining weeks, leaving optimism that the upcoming candle might be another green one.
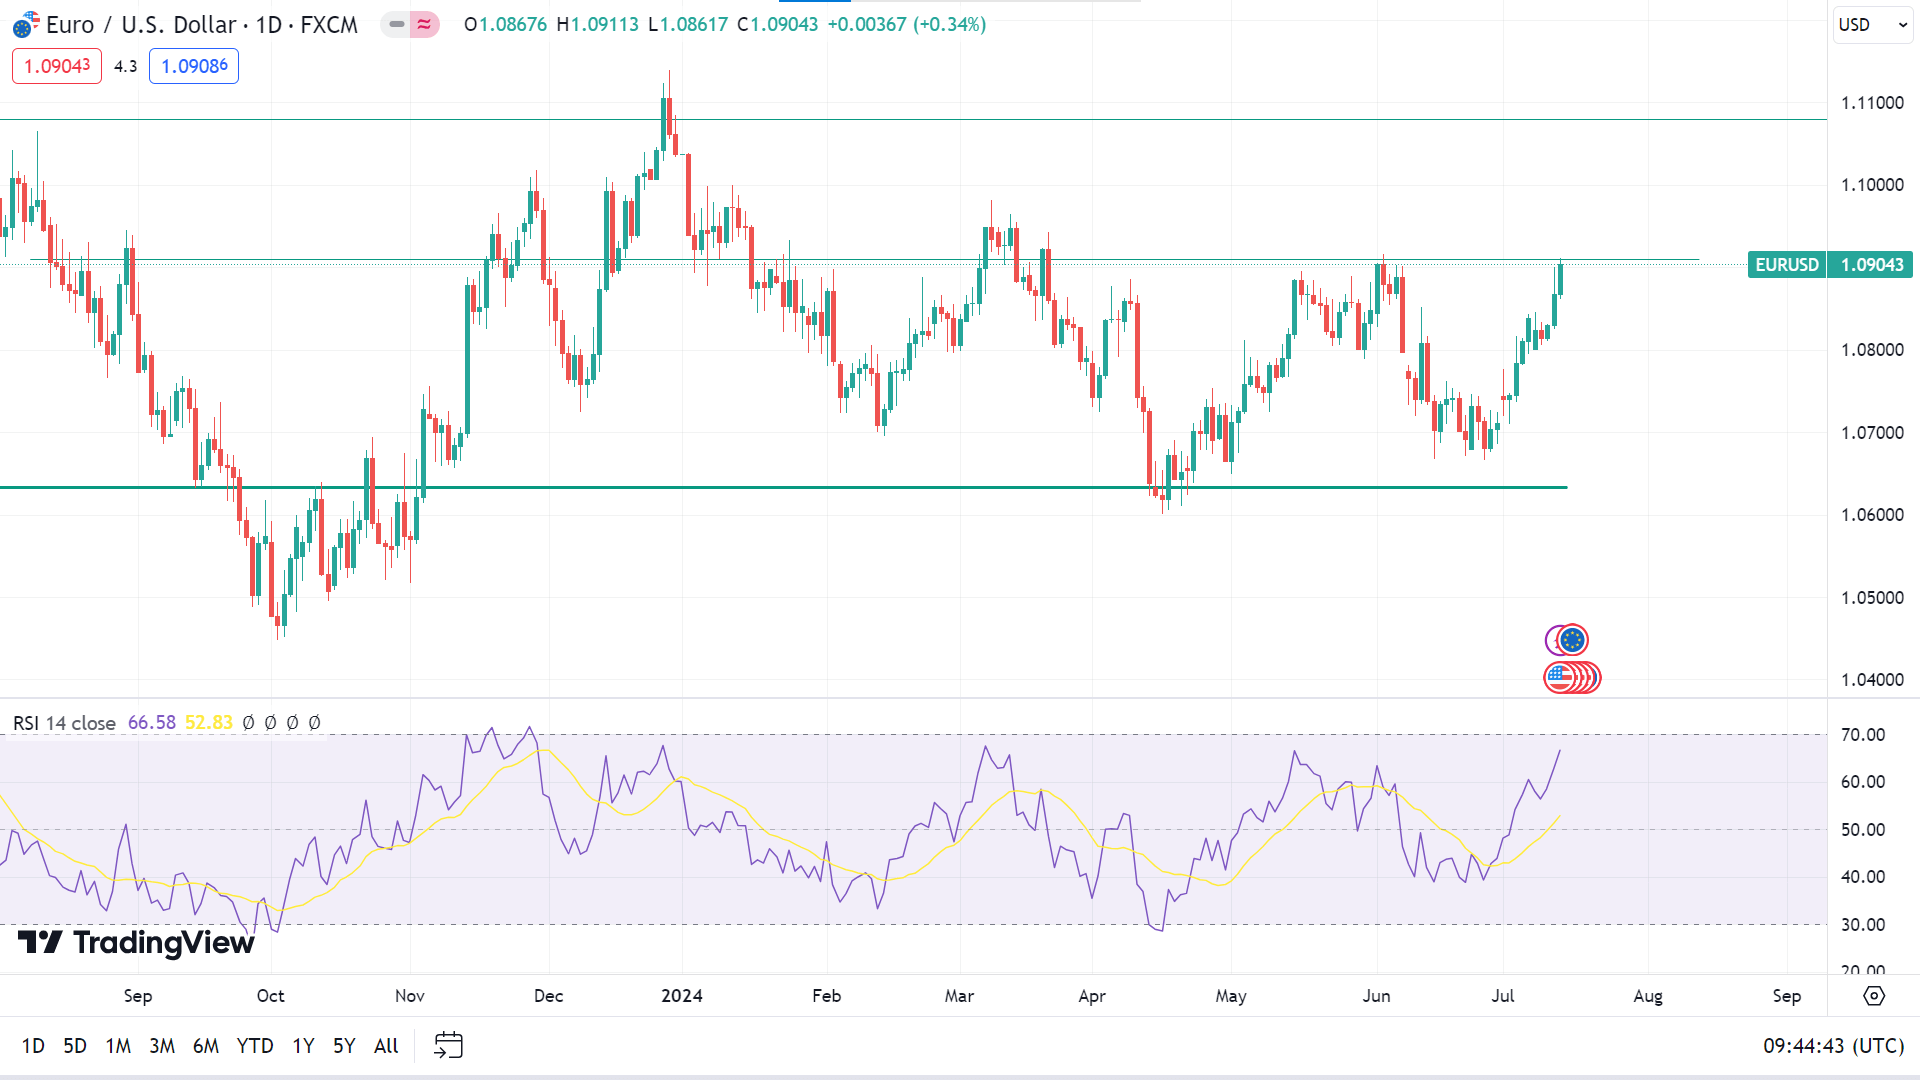
The price is moving upward on the daily chart, as the RSI indicator window shows the signal line sloping upward just below the upper level, reflecting bullish pressure. The price is floating below a previous resistance of 1.0918; a breakout may trigger the price toward the nearest resistance of 1.1014, followed by the next resistance of 1.1264.
Meanwhile, any pause in the current uptrend might turn the price toward the primary support of 1.0820, followed by the next support near 1.0698.
GBPJPY
Fundamental Perspective
Data from the Bank of Japan (BoJ) revealed that Japanese authorities might have spent between JPY3.37 trillion and JPY3.57 trillion on July 11 to curb the yen's rapid depreciation. Chief Cabinet Secretary Yoshimasa Hayashi emphasized the government's readiness to use all available measures for forex stability while leaving monetary policy specifics to the BoJ. He expects the BoJ to take appropriate actions to achieve the 2% price target sustainably.
In contrast, the Pound Sterling displayed notable strength against major currencies, buoyed by Keir Starmer's Labour Party's decisive parliamentary victory, which has brought stability to the UK's political landscape. This political stability enhances fiscal predictability, attracting substantial foreign investments. Chancellor Rachel Reeves has pledged to stimulate growth with a focus on supply, considering the limited scope for government spending.
Additionally, a brighter economic outlook and reduced expectations for the Bank of England (BoE) to cut interest rates in August have bolstered the Pound's appeal. May's GDP data surpassed expectations, raising doubts about a BoE policy shift in September.
Despite this, BoE policy makers remain cautious about early rate cuts due to high wage growth. Catherine Mann of the BoE warned that achieving the 2% inflation target might be fleeting, with inflation potentially rising again and staying above the desired rate for the rest of the year.
GBPJPY Forecast Technical Perspective
After several weeks of gain, the last weekly candle closed with a small red body on the weekly chart, reflecting that buy pressure may pause at this level and continue to gain in the upcoming week.
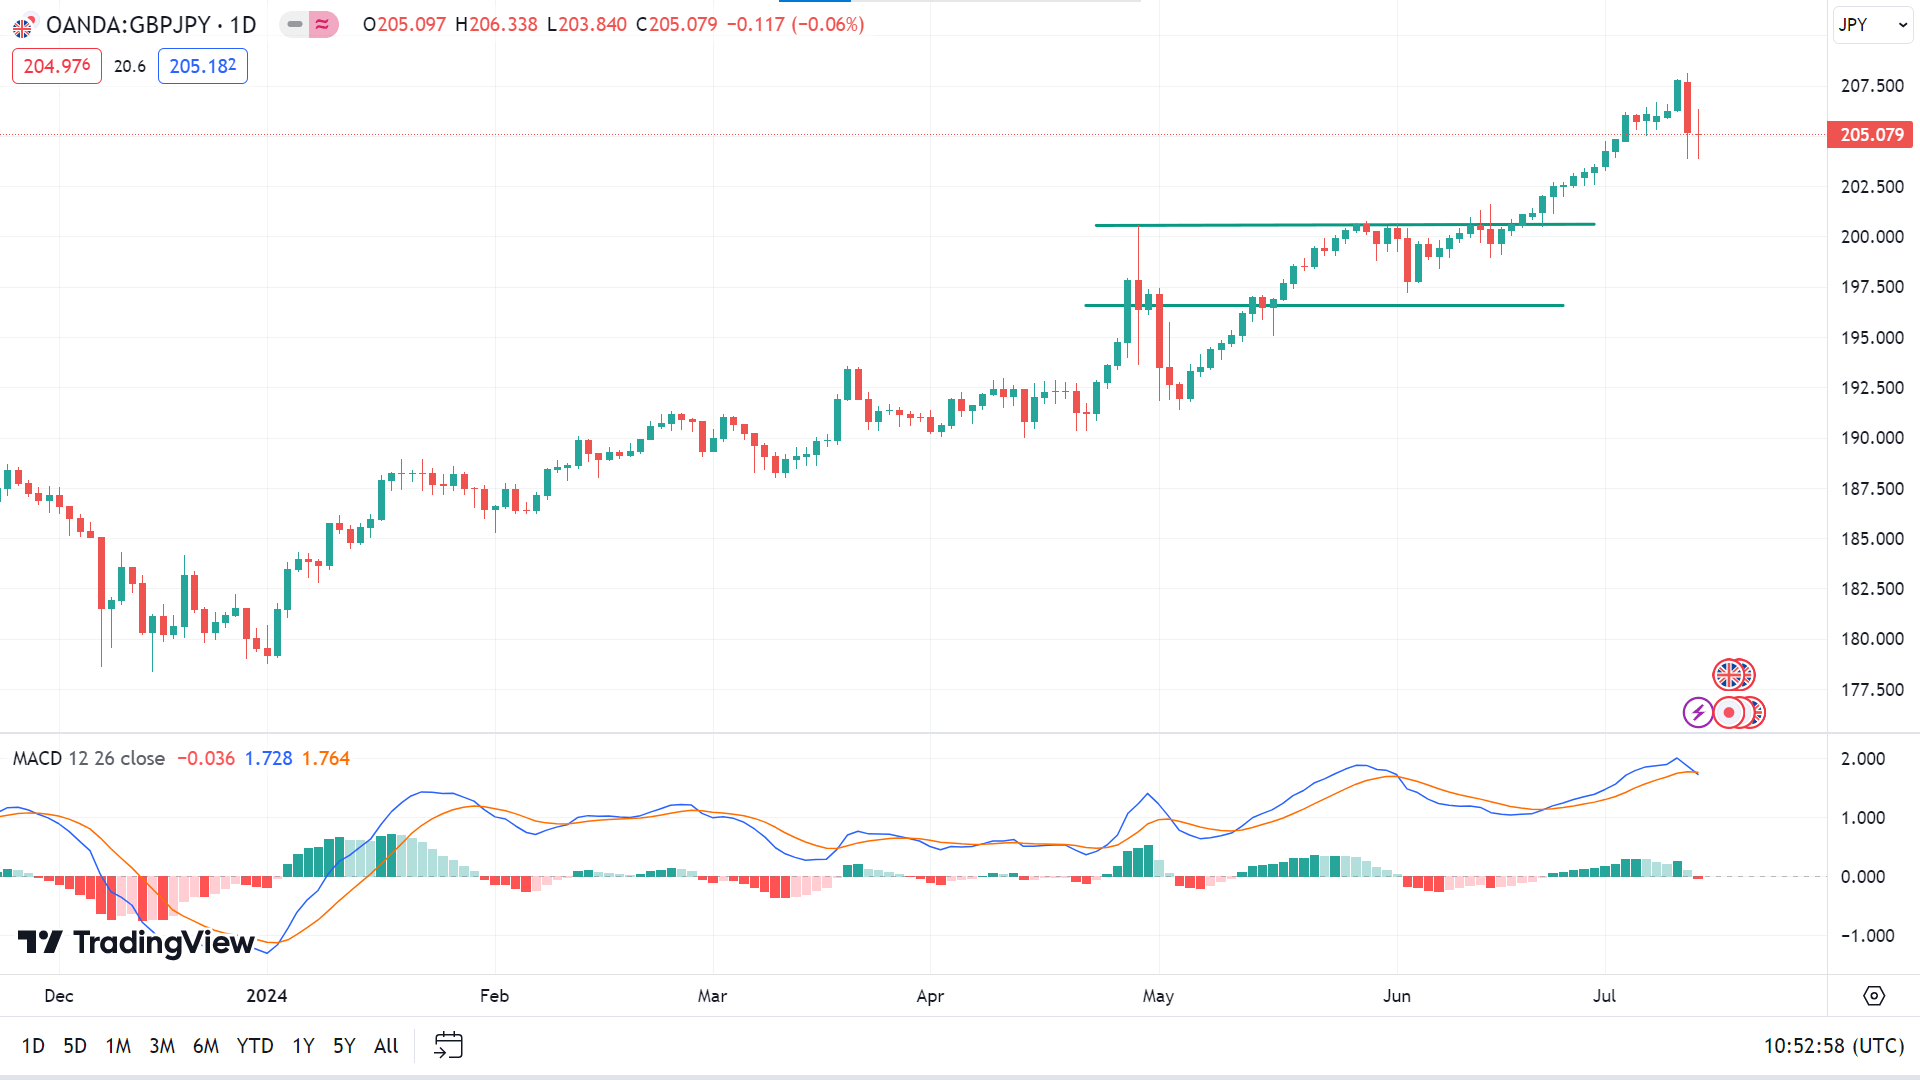
The price slips from an approximate sixteen-year high on the daily chart, reflecting the pause in the current bullish trend. Dynamic signal lines on the MACD indicator window create a fresh sell crossover floating at the overbought level, reflecting a mixed market environment, which indicates that the price may hit the recent peak of 208.12, and a breakout may trigger the price toward the next resistance near 214.19.
Meanwhile, the dynamic signal lines of the MACD indicator window continue to slope downward, and the red histogram bars continue to appear below the midline. In that case, the price might decline at the primary support near 200.65, followed by the next support near 198.25.
NASDAQ 100 (NAS100)
Fundamental Perspective
The second-quarter reporting season began with significant U.S. banks leading the way. JPMorgan Chase and Citigroup exceeded expectations due to strong investment banking performance, but their shares fell by 1.2% and 1.8%, respectively. Wells Fargo declined by 6.0% after missing the estimation of interest income.
Economically, the Labor Department's Producer Prices report was hotter than expected. At the same time, the University of Michigan's initial read on June Consumer Sentiment unexpectedly dipped, which followed a cooler CPI print, which supported Fed Chair Jerome Powell's hint during his congressional testimony that the central bank might cut interest rates as soon as September.
Next week's key economic indicators include Tuesday's retail sales, housing starts, building permits, and industrial output on Wednesday. Significant corporate earnings reports are expected from Goldman Sachs on Monday, Bank of America and Morgan Stanley on Tuesday, and United Airlines and Johnson & Johnson on Wednesday.
Technical Perspective
The last weekly candle closed as a doji with a tiny red body after a solid green candle, reflecting a bit of pause on the current bullish trend. This leaves buyers optimistic for next week.
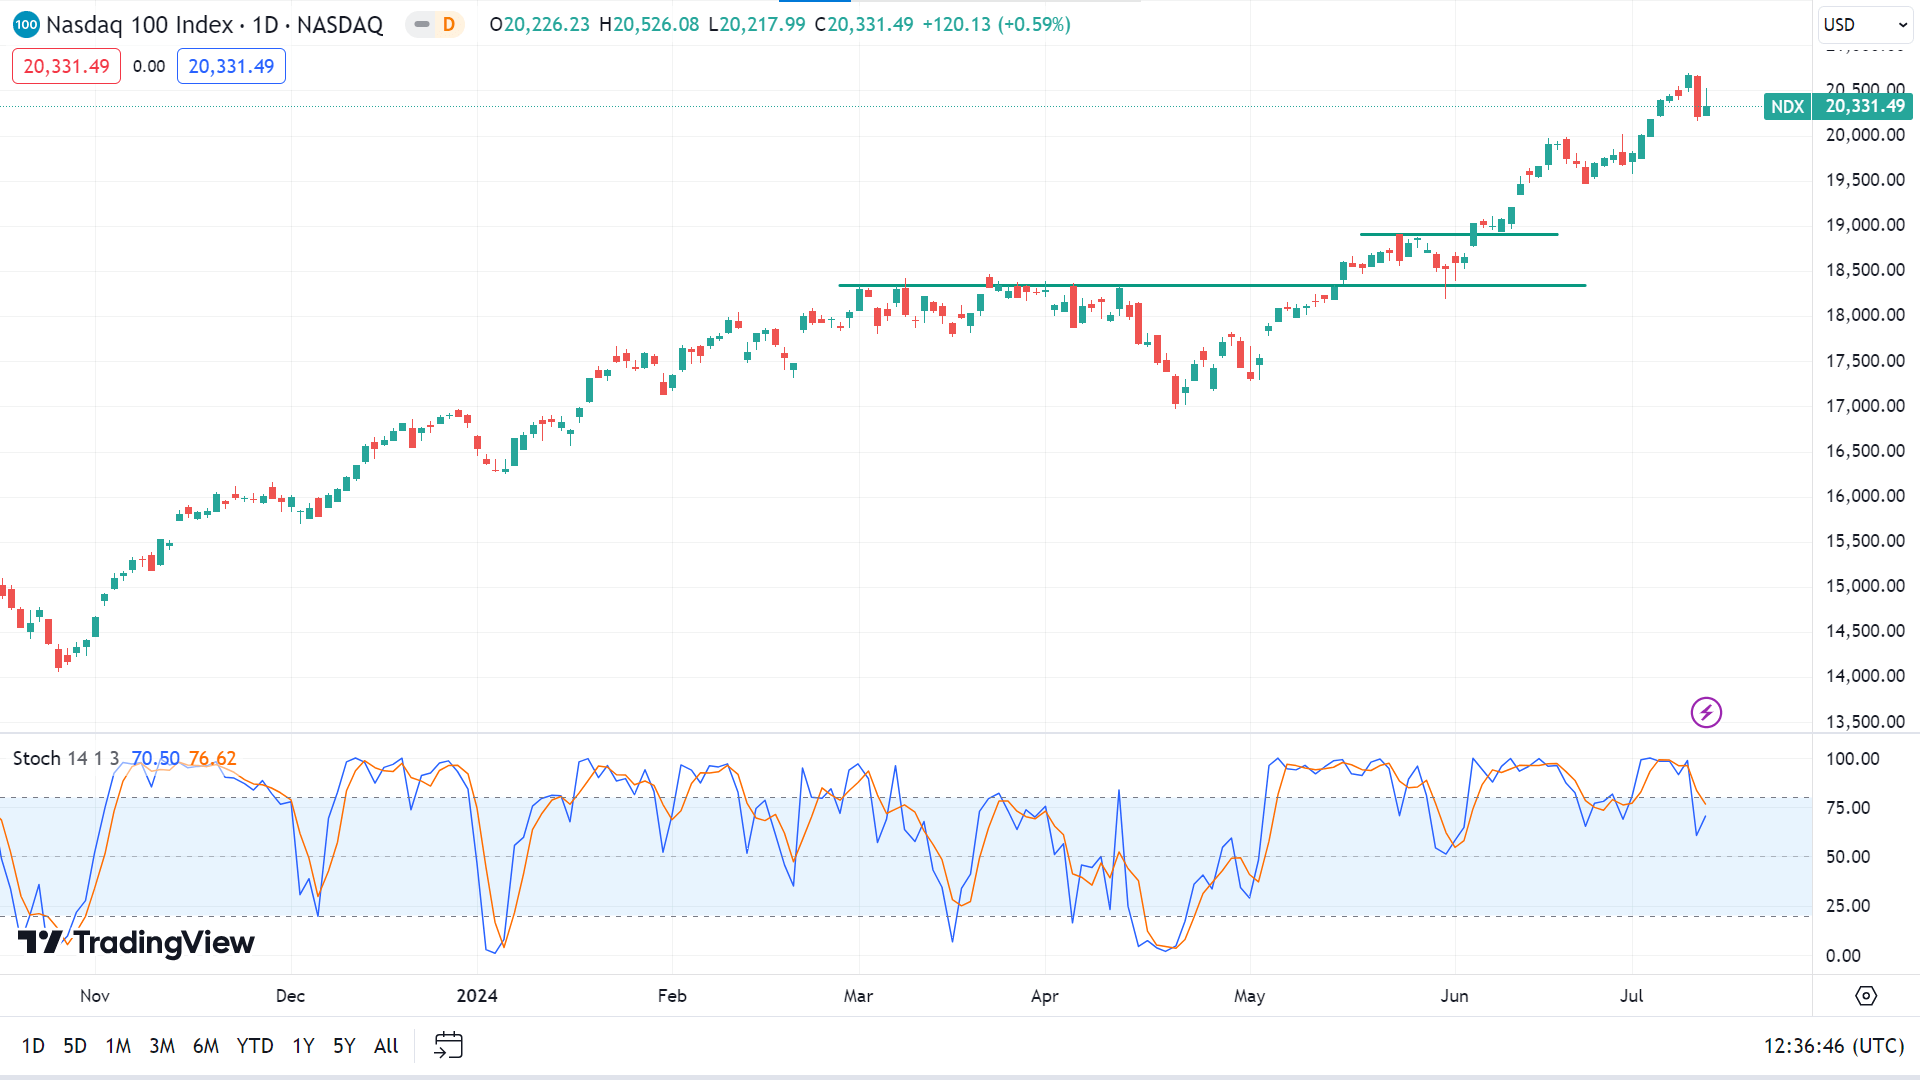
On the daily chart, the Stochastic indicator window signals a fresh sell pressure as the signal lines start to decline below the upper level of the indicator window. The price may head toward the primary support of 19979.93, followed by the next support near 19472.53.
Meanwhile, it can only pause the current uptrend. The price may regain the peak of 20690.97, and a breakout can trigger the price toward the next resistance of 22614.67.
S&P 500 (SPX500)
Fundamental Perspective
The Standard & Poor's 500 index showed resilience this week, climbing 0.9% and hovering near record highs despite mixed inflation data and varied bank earnings reports, closing the week at 5,615.35. July has seen a 2.8% increase in the S&P 500, contributing to an impressive 18% gain for the year.
Inflation reports for the week revealed that US consumer prices declined unexpectedly in June, with the consumer price index (CPI) falling by 0.1%. Annual inflation eased to 3%, down from May's 3.3%, surpassing the Wall Street consensus of 3.1%.
Conversely, June's producer price index (PPI) saw a 0.2% increase, surpassing expectations of a 0.1% rise. Annually, the PPI accelerated to 2.6% from May's 2.4%, exceeding analysts' projections of 2.3%. These economic indicators underscore the market's cautious optimism amid ongoing fluctuations in financial data and corporate earnings, highlighting the resilience of the S&P 500 in the face of mixed signals from the broader economy.
Technical Perspective
The last candle finished solid green on the weekly chart with a small upper wick. It posted more than five consecutive weeks of gain, still leaving hope for buyers for next week.
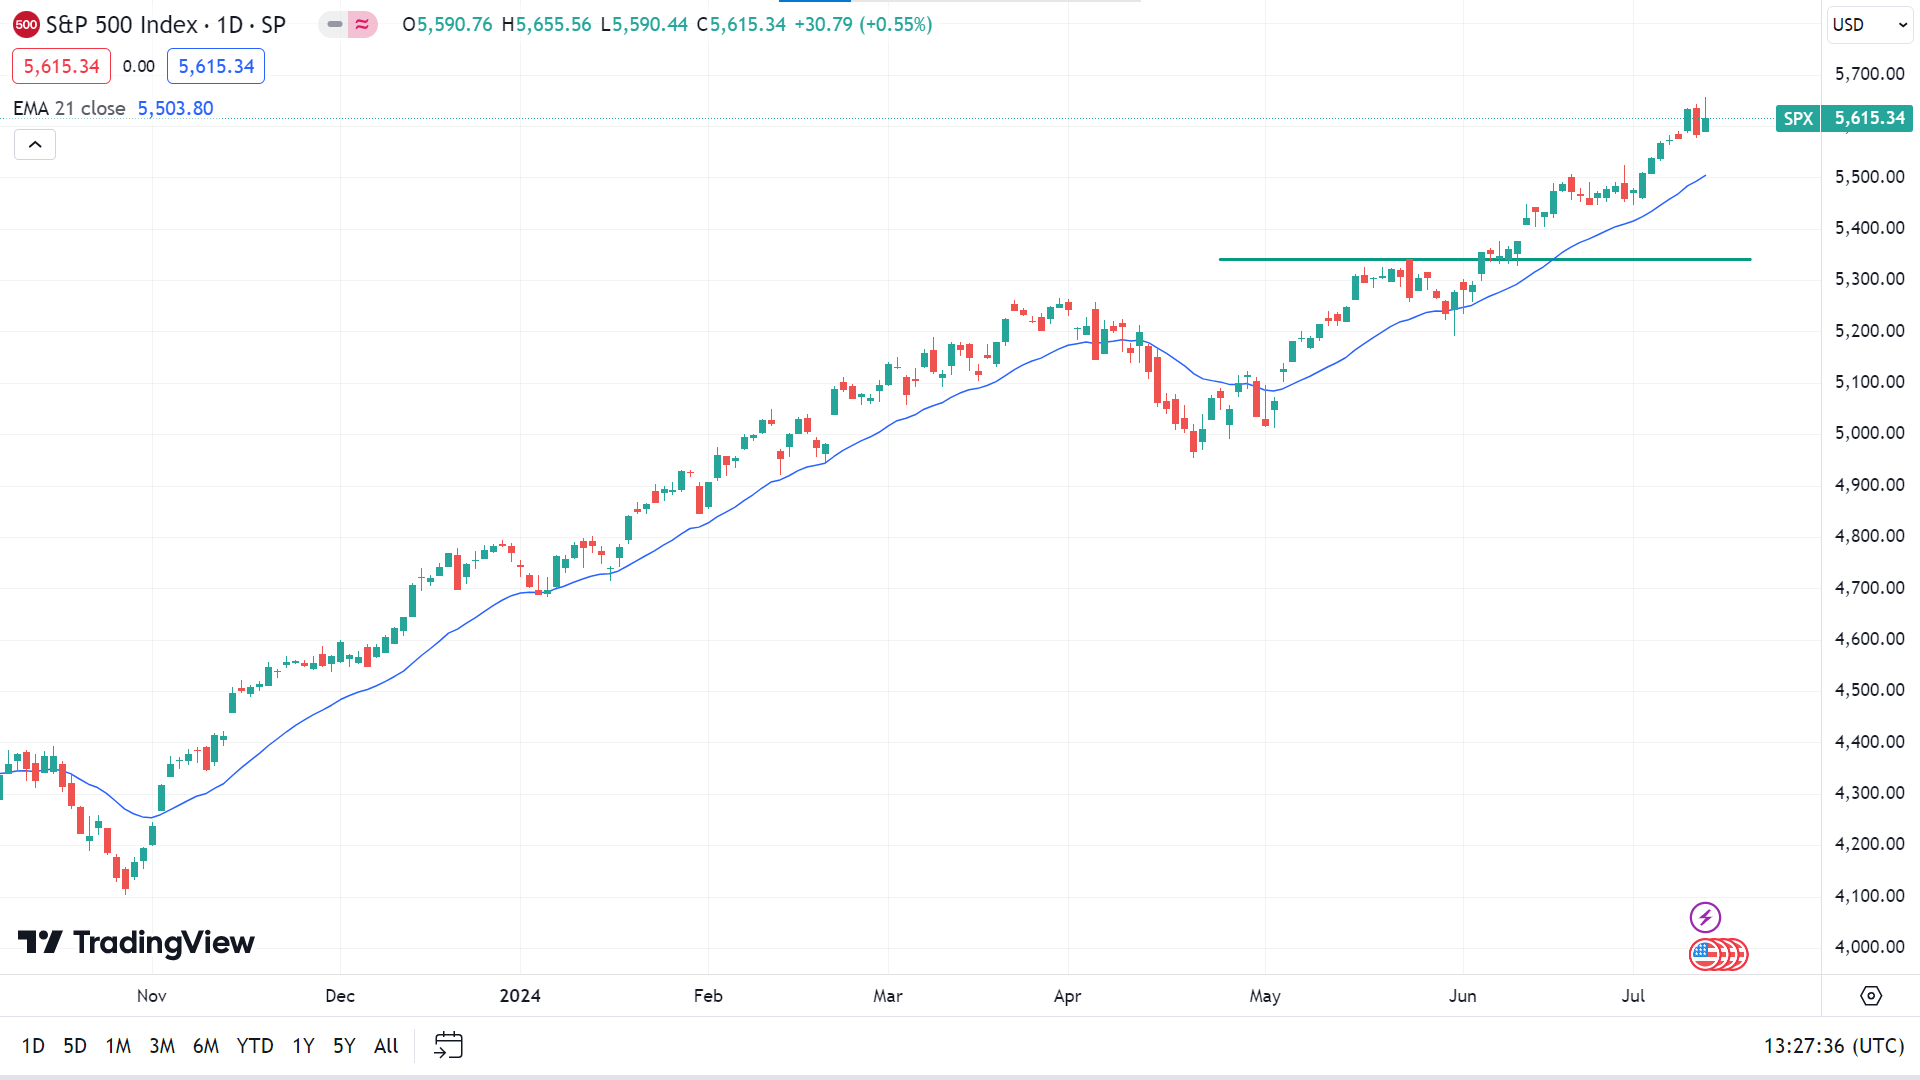
Applying EMA 20 on the daily chart shows that the price, in a smooth uptrend, may regain the ATH of 5655.56, followed by the next possible resistance near 5695.47.
Meanwhile, any pause can trigger the price toward the nearest dynamic support of $5295.63 closer to the EMA 20 line, followed by the next support near 5027.45.
Bitcoin (BTCUSD)
Fundamental Perspective
Bitcoin (BTC) maintained stability around the $57,000 mark this week amid significant developments shaping its market landscape. A notable event was the German Government's substantial reduction of its Bitcoin holdings, from 40,000 BTC to 16,000 BTC. This move, which reduced value from $2.2 billion to $896 million, likely contributed to market uncertainty and potentially influenced recent price fluctuations.
Simultaneously, US spot Bitcoin ETFs continued to attract consistent inflows, totaling $78.90 million on Thursday alone and reaching $737.50 million for the entire week. These inflows underscore increasing investor confidence and suggest a positive outlook for Bitcoin's short-term price performance. Monitoring ETF activities provides valuable insights into broader market sentiment and investment trends.
On-chain data reveals a significant accumulation of BTC by institutional whales, amounting to approximately 101,600 BTC recently. This accumulation marks the largest since March and reflects a strategic "buying the dip" strategy among major institutional players. This trend diverges from previous periods dominated by ETF-related activities, highlighting a shift in market dynamics driven by institutional investment strategies.
In addition, former US President Donald Trump's upcoming appearance at Bitcoin 2024, the world's largest Bitcoin conference in Nashville, signals growing political interest in cryptocurrency. Trump's endorsement of Bitcoin aligns with recent Republican party efforts to incorporate cryptocurrency into their platform, contrasting with President Joe Biden's more cautious approach. This event may underscore divergent policy positions on Bitcoin heading into future electoral debates.
Bitcoin Price Prediction Technical Perspective
The last weekly candle closed green after posting four consecutive losing weeks, making buyers optimistic for the next week.
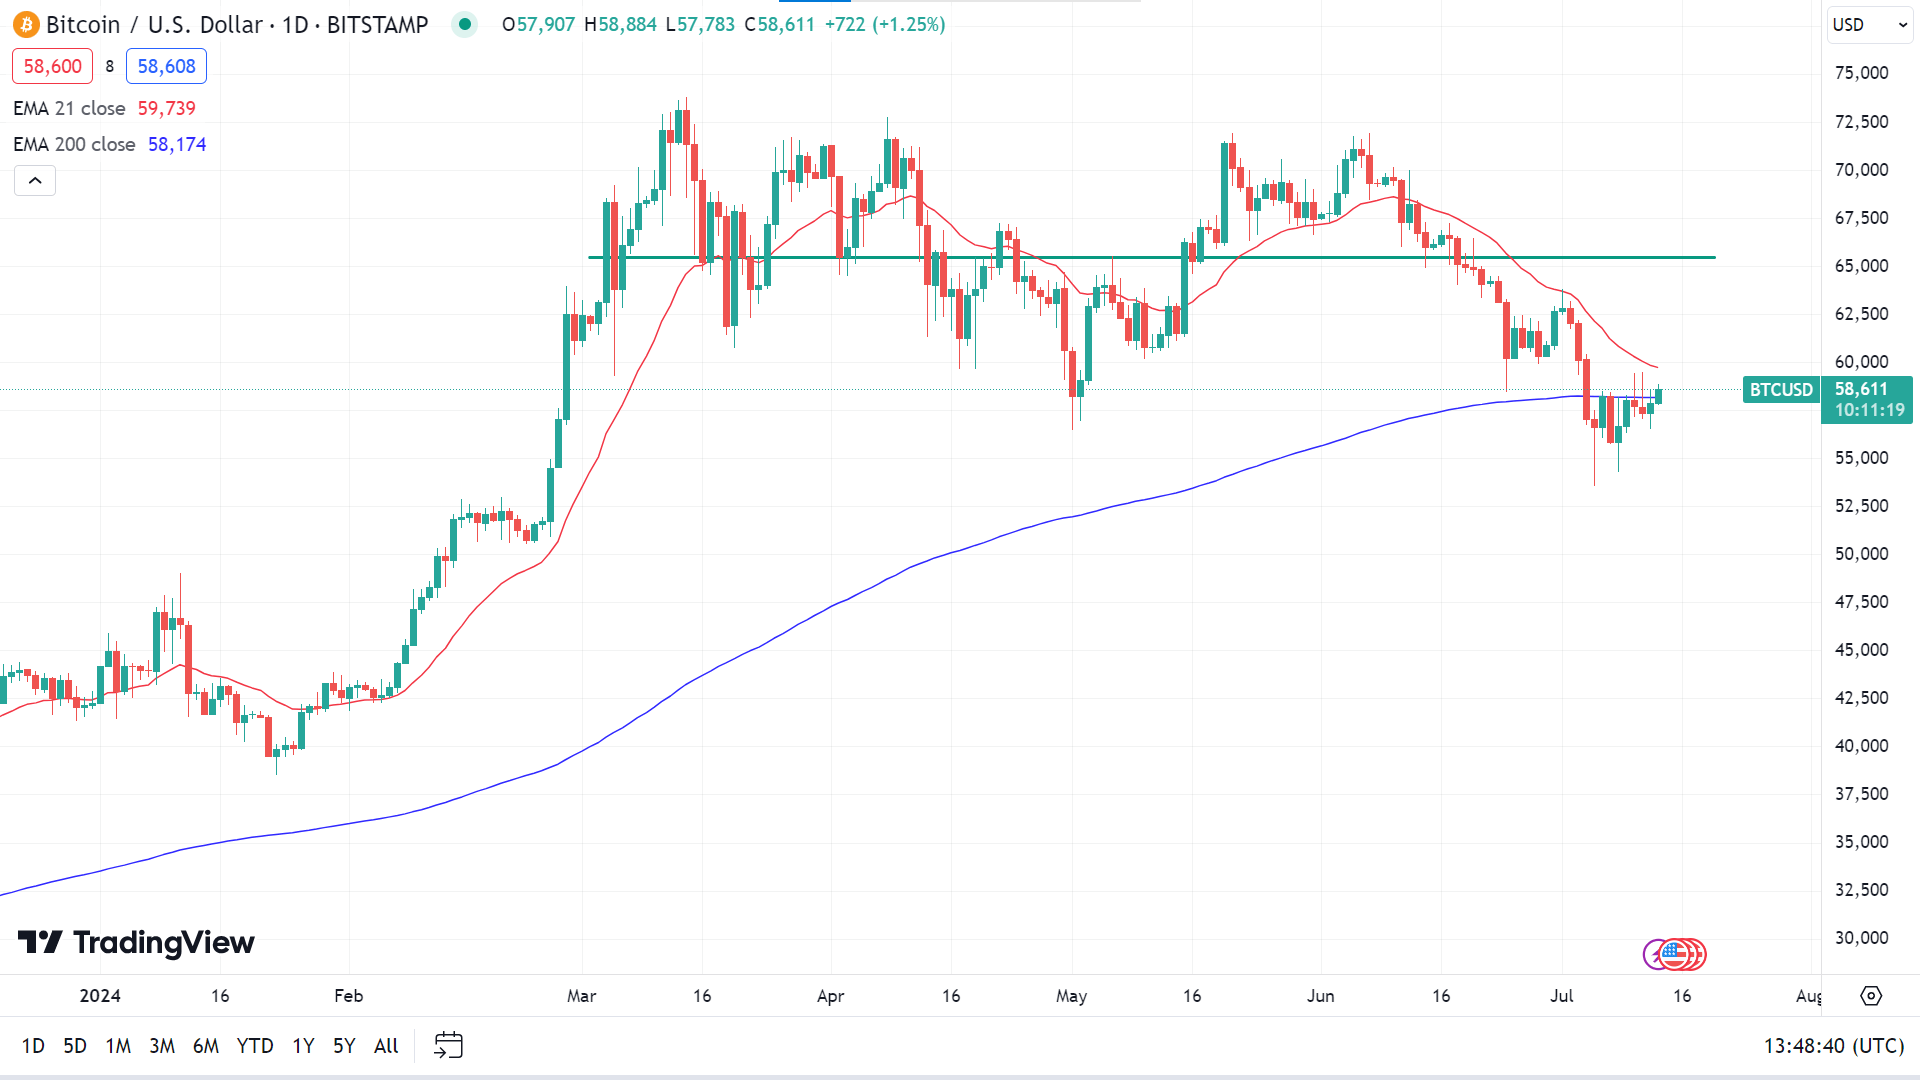
The price remains below the EMA 20 line on the daily chart, supporting current sell pressure, but after consolidation, it reaches above the EMA 200 line, indicating a mixed market situation. If the price goes above the EMA 20 line, it may hit the nearest resistance of 62,905, followed by the next resistance near 65,500.
Meanwhile, if the price declines below the EMA 200 line, it may reach to's nearest support 56,722, followed by the next support near 54,616.
Ethereum (ETHUSD)
Fundamental Perspective
Crypto analysts suggest that Ethereum (ETH) might be ready to regain key resistance levels amid the market slowdown. Investors eagerly anticipate the final approval of spot ETH ETFs, hoping for significant market movements.
The upcoming approval of spot Ethereum ETFs has sparked speculation about its impact on ETH's performance. Daan Crypto Trades, a Renowned investor, believes that the S-1 form approval news will not significantly affect Ethereum's price. He draws a parallel to the market reaction to the 19b-4 approval news in May, which led to a 30% rally in anticipation but did not further impact the price post-announcement.
Daan asserts that the SEC's approval is already "99%+ priced in," suggesting it won't have a bullish or bearish effect. The real test, he argues, will be the actual capital flows once the ETFs are live. He also predicts significant outflows from the Grayscale Ethereum Trust (ETHE), though not as severe as those seen with the Grayscale Bitcoin Trust (GBTC). He estimates that 20% of the inflows seen for spot BTC ETFs can be expected for Ethereum.
In summary, while immediate price impacts from the ETF approval may be limited, the long-term effects will depend on investor behavior once the funds are available.
Ethereum Price Prediction Technical Perspective
The last weekly candle closed green after posting more than five losing weeks, leaving optimism for buyers for the next week.
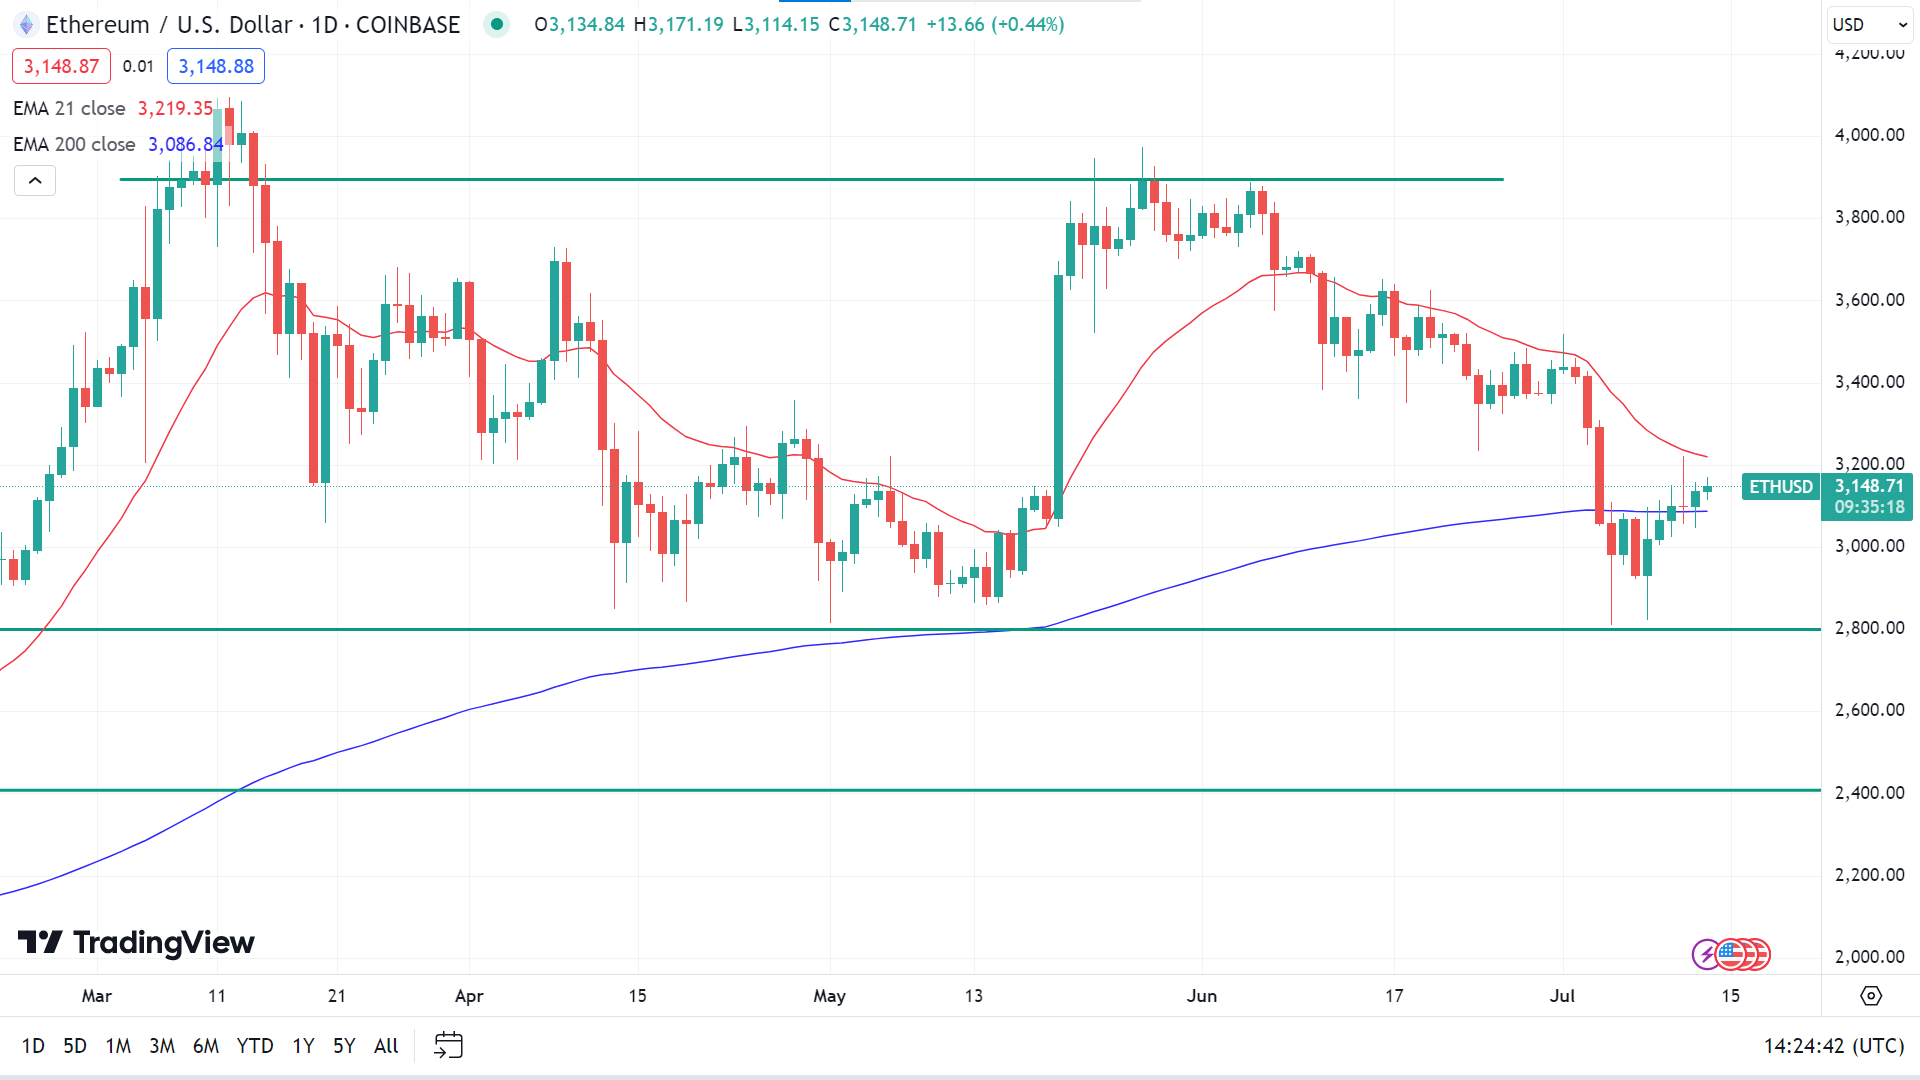
The price is floating between the EMA 20 and EMA 200 lines, indicating a mixed signal for the asset. The EMA 20 line acts as dynamic resistance, and the EMA 200 line acts as dynamic support level. If the price exceeds the EMA 20 line on the upside, it can hit the nearest resistance of 3467.78, followed by the next resistance near 3855.50.
However, if the price declines below the EMA 200 line, it can reach the nearest support of 2929.28, followed by the next support near 2859.27.
Gold (XAUUSD)
Fundamental Perspective
Gold (XAUUSD) corrected on Friday after a notable rally on Thursday following the release of US CPI inflation data. The precious metal continued to pull back as the June US Producer Price Index (PPI) came in higher than expected, trading in the $2,390s during the US session as the weekend approached.
The June PPI showed a 2.6% year-over-year increase, surpassing expectations of 2.3% and the revised 2.4% from the previous month. Every month, the PPI rose by 0.2%, exceeding the forecast of 0.1%. Producer Prices, excluding Food and Energy, also increased more than anticipated, according to the US Bureau of Labor Statistics. As a measure of the prices of goods leaving factories, the PPI is seen as a precursor to broader inflationary trends, suggesting potential future inflation.
Thursday's CPI data showed a slowdown in inflation, boosting expectations of an imminent interest rate cut by the Federal Reserve (Fed). Markets are now fully pricing in a 0.25% cut in the Fed Funds rate in September and over 0.60% of cuts by year-end, enhancing Gold's appeal as a non-interest-bearing asset.
The CPI data indicated headline inflation cooled to 3.0% year-over-year in June, below the estimate of 3.1%, with core CPI slowing to 3.3%, suggesting the Fed might soon reduce rates to stimulate job growth and manage inflation momentum.
Gold Price Prediction Technical Perspective
The last weekly candle closed with a green body, posting three consecutive gaining weeks, which indicates a strong possibility that the next candle might be another green one.
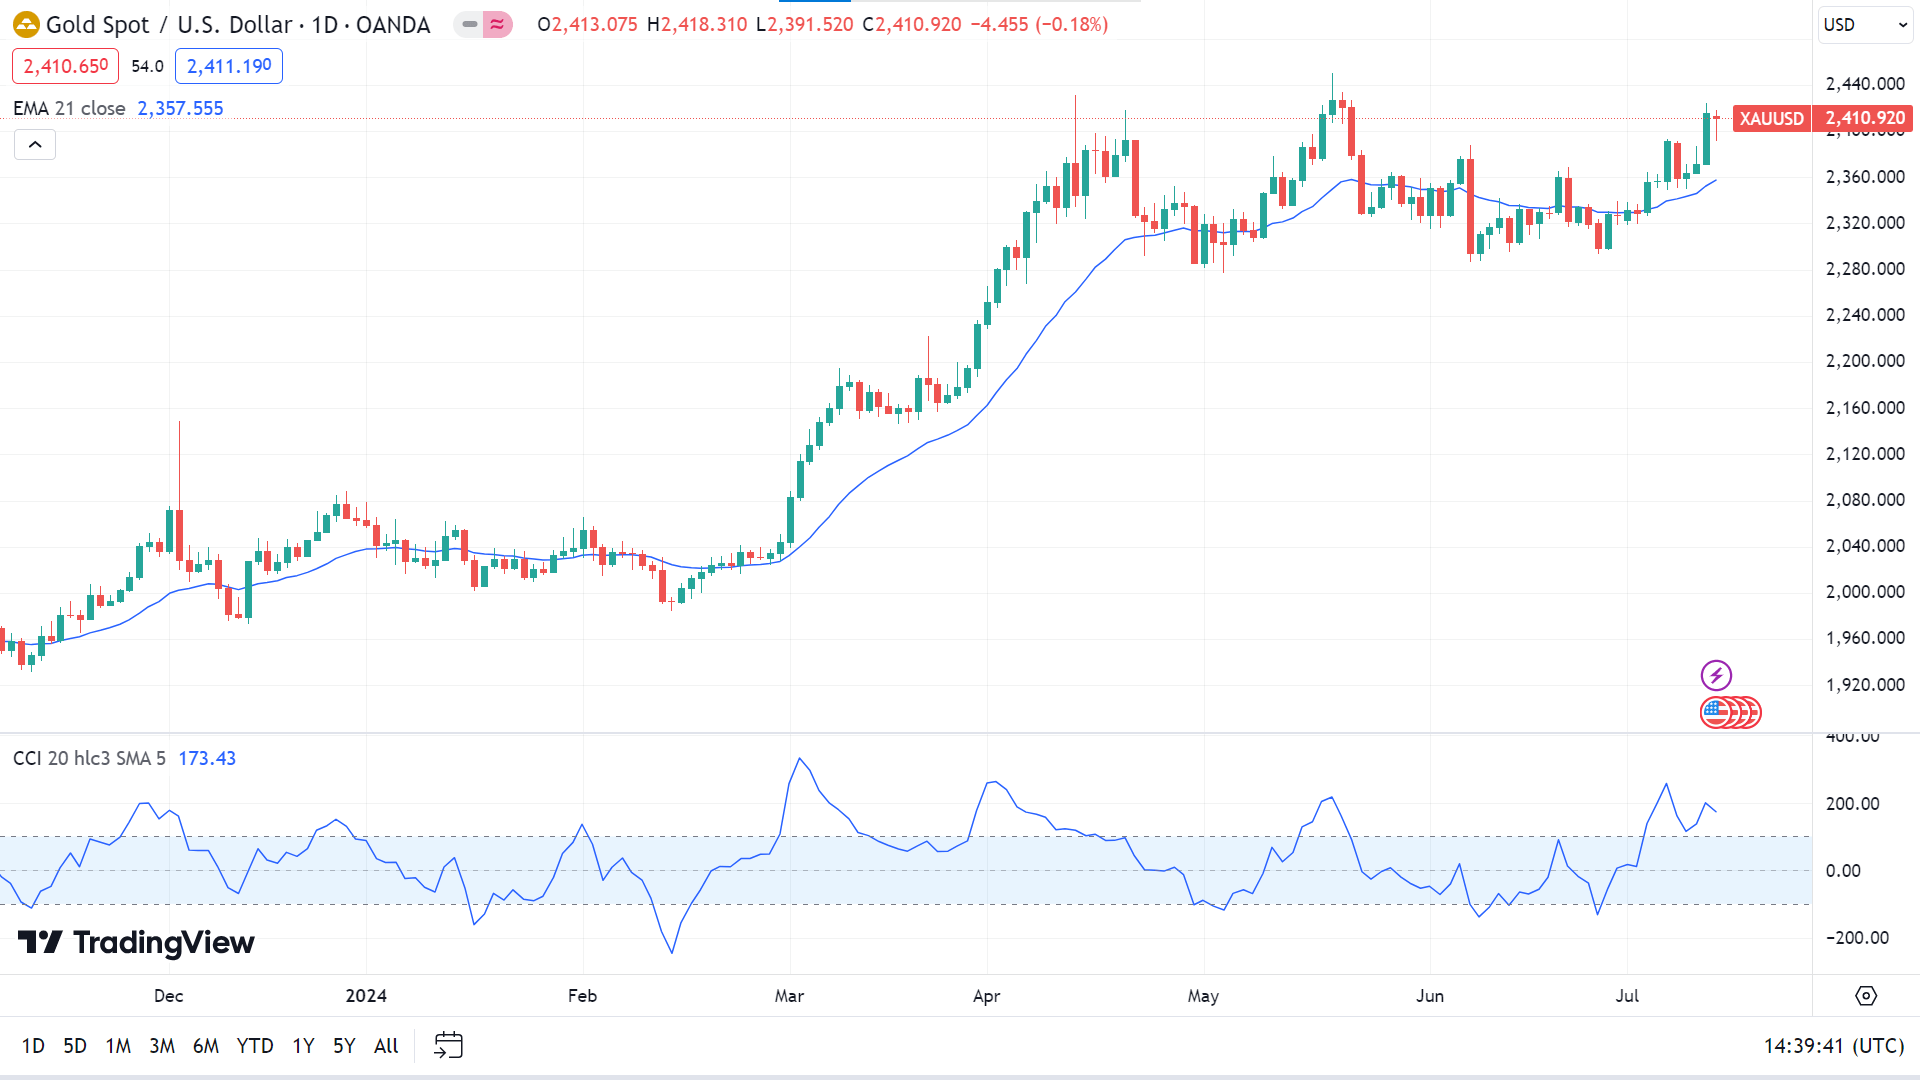
The gold price shows bullish pressure from the pennant breakout, while the signal line of the CCI indicator window starts to slope down above the upper line. It is a sign that a downside correction might appear but the major trend remains still bullish.
Meanwhile, if the price declines below the EMA 20 line, it can reach the nearest support of 2320.36, followed by the next support near 2277.34.
Nvidia Stock (NVDA)
Fundamental Perspective
Nvidia (NVDA) and many other AI chip stocks rebounded on Friday following a sharp sell-off on Thursday, which one analyst termed a "wake-up call" for artificial intelligence investments.
The semiconductor companies and Magnificent Seven stocks tied to the AI trend have experienced substantial gains this year. However, some Wall Street experts warn of a potential bubble. Skeptics include Jim Covello, Goldman Sachs' head of global equity research, and Ed Yardeni, a prominent economist and president of Yardeni Research.
Klein suggested that Thursday's semiconductor sell-off offered a glimpse of what could occur when the anticipated correction in AI stocks happens. "Yesterday's semi-sell-off was a quick preview of what is to come when Nvidia finally guides only 'in line' or misses the whisper number by a real amount," he said. "Yes, that day will eventually happen."
On Thursday, the iShares Semiconductor ETF (SOXX) dropped 3.3%. This exchange-traded fund tracks the performance of the Philadelphia Semiconductor Index (SOX), which includes the 30 most extensive semiconductor stocks traded in the U.S., led by Taiwan Semiconductor Manufacturing (TSM) and Nvidia.
Nvidia Stock Forecast Technical Perspective
On the weekly chart, the last candle was finished with a green body and an upper wick, which reflects bulls may be losing power and indicates the next candle might be red.
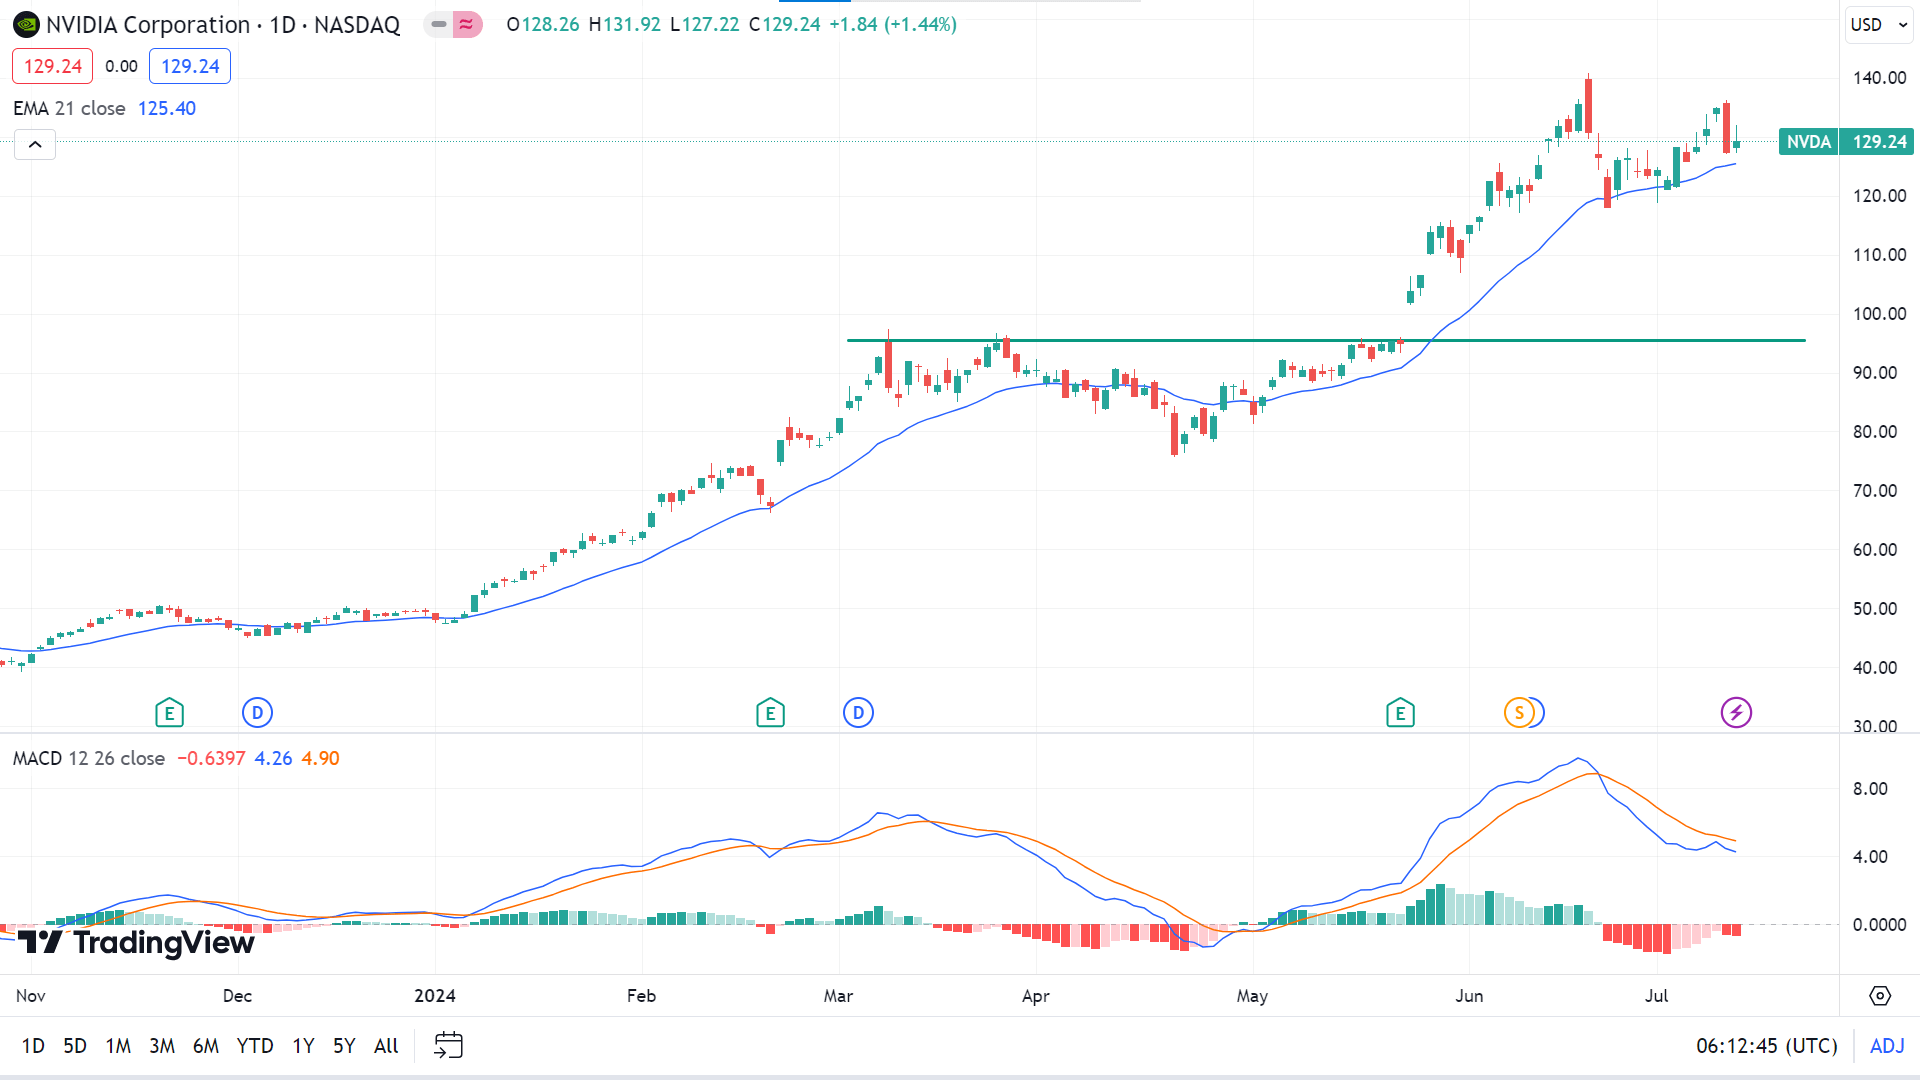
The NVDA stock price floating above the EMA 20 line on the daily chart indicates that bullish pressure is still active, while the MACD indicator window shows seller domination. So, as long as the price stays above the EMA 20 line, it may hit the current peak of 140.76, followed by the next resistance near 143.21.
Meanwhile, if the price reaches below the EMA 20 line, following the MACD reading, the price can drop toward 119.08, followed by the next support near 114.47.
Tesla Stock (TSLA)
Fundamental Perspective
Tesla (TSLA) stock was downgraded to a sell rating on Friday after news broke that the company is delaying its "robotaxi" reveal from August to October. Despite the downgrade, TSLA shares rose after the market opened.
UBS analyst Joseph Spak downgraded Tesla from neutral to sell, though he raised the price target from $147 to $197. Spak highlighted that Tesla's valuation premium has widened recently due to market enthusiasm for artificial intelligence (AI), but he noted that the company's automotive growth opportunities are limited.
Spak values Tesla's AI initiatives, including Full Self-Driving (FSD) technology and the Optimus humanoid robot, at over $500 billion. He projects that realizing this value will take five years, implying a future worth of $1 trillion. However, he cautioned that while Tesla's investments in AI are significant, the costs are high, progress may slow, and returns are long-term.
UBS does not expect Tesla to reach 5 million vehicle deliveries by 2030, predicting 3.9 million instead. UBS values Tesla's auto segment at $57 per share and the energy business at $18 per share. In contrast, Morgan Stanley's Adam Jonas maintained a Tesla stock price target of $310 but increased the valuation of Tesla Energy to $50 per share.
Tesla shares gained 3% to $248.23 on Friday after dropping 8.4% to $241.03 on Thursday following an 11-day consecutive advance.
Tesla Stock Forecast Technical Perspective
After a solid, long green candle, the last weekly candle finished as a doji, reflecting a pause and leaving hope for buyers for the next week.
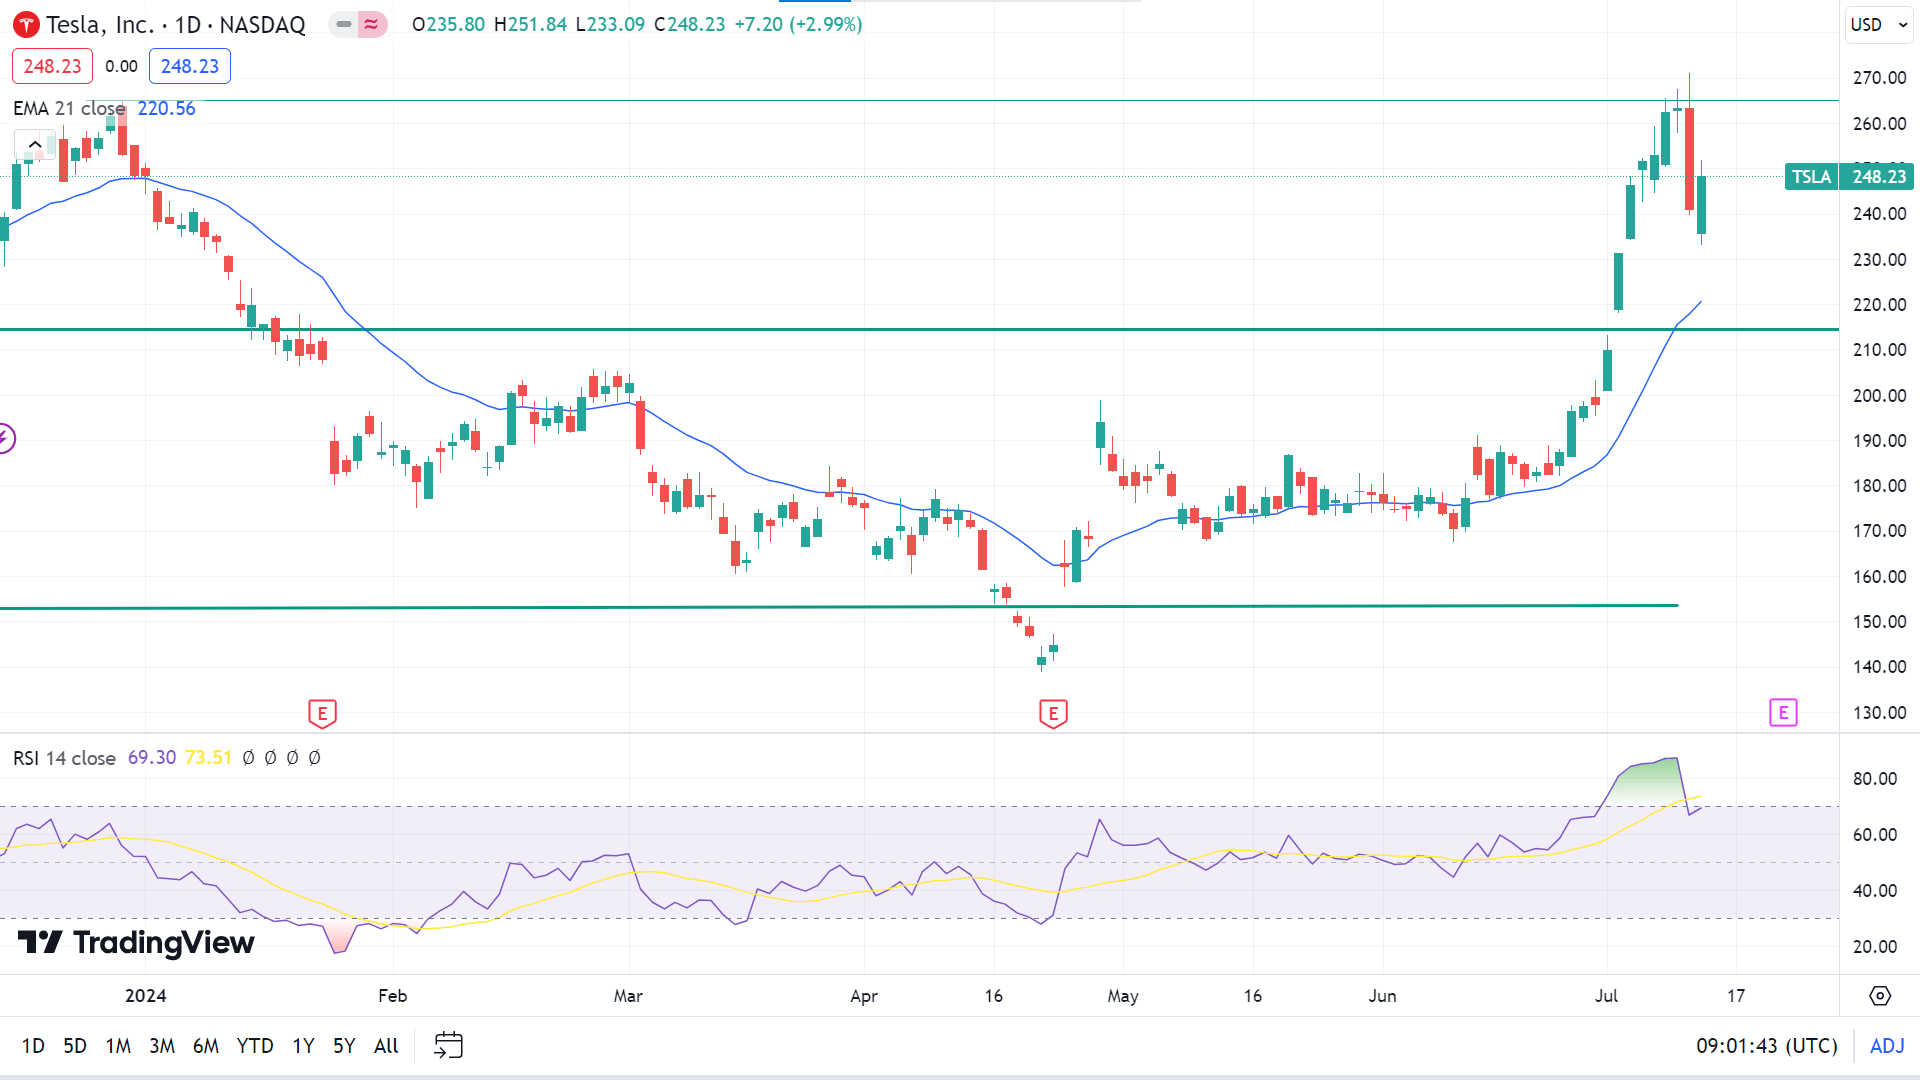
The TSLA stock price is above the EMA 21 line, declaring a bullish force on the daily chart. In contrast, the RSI indicator window reflects bearish pressure as the dynamic signal line slopes below the upper level following seller activities. So, the price may hit the primary resistance of 265.13, followed by the next resistance near 278.40.
Meanwhile, on the downside, the price can decline toward the dynamic support of the EMA 21 line near 220.56. The next possible support is near 198.66.
WTI Crude Oil (USOUSD)
Fundamental Perspective
Oil prices are currently experiencing a mix of bearish and bullish influences. Despite a challenging start to the week, oil seems poised to recover its losses and potentially close flat by Friday. This anticipation is fueled by expectations of an interest rate cut by the US Federal Reserve in September, which many believe will boost demand.
Meanwhile, the US Dollar Index (DXY), which measures the dollar's performance against six major currencies. This drop occurred following June's US Consumer Price Index (CPI) data, which indicated increased disinflation. Markets quickly adjusted to the prospect of a September rate cut, leading to a narrowing rate differential with other currencies and a corresponding dollar value adjustment.
Oil Prices Forecast Technical Perspective
After four consecutive gaining weeks, the last candle closed red, reflecting buyers' possible loss of interest at that level or a pause in the current bullish trend. Thus, the next candle can be either green or red.
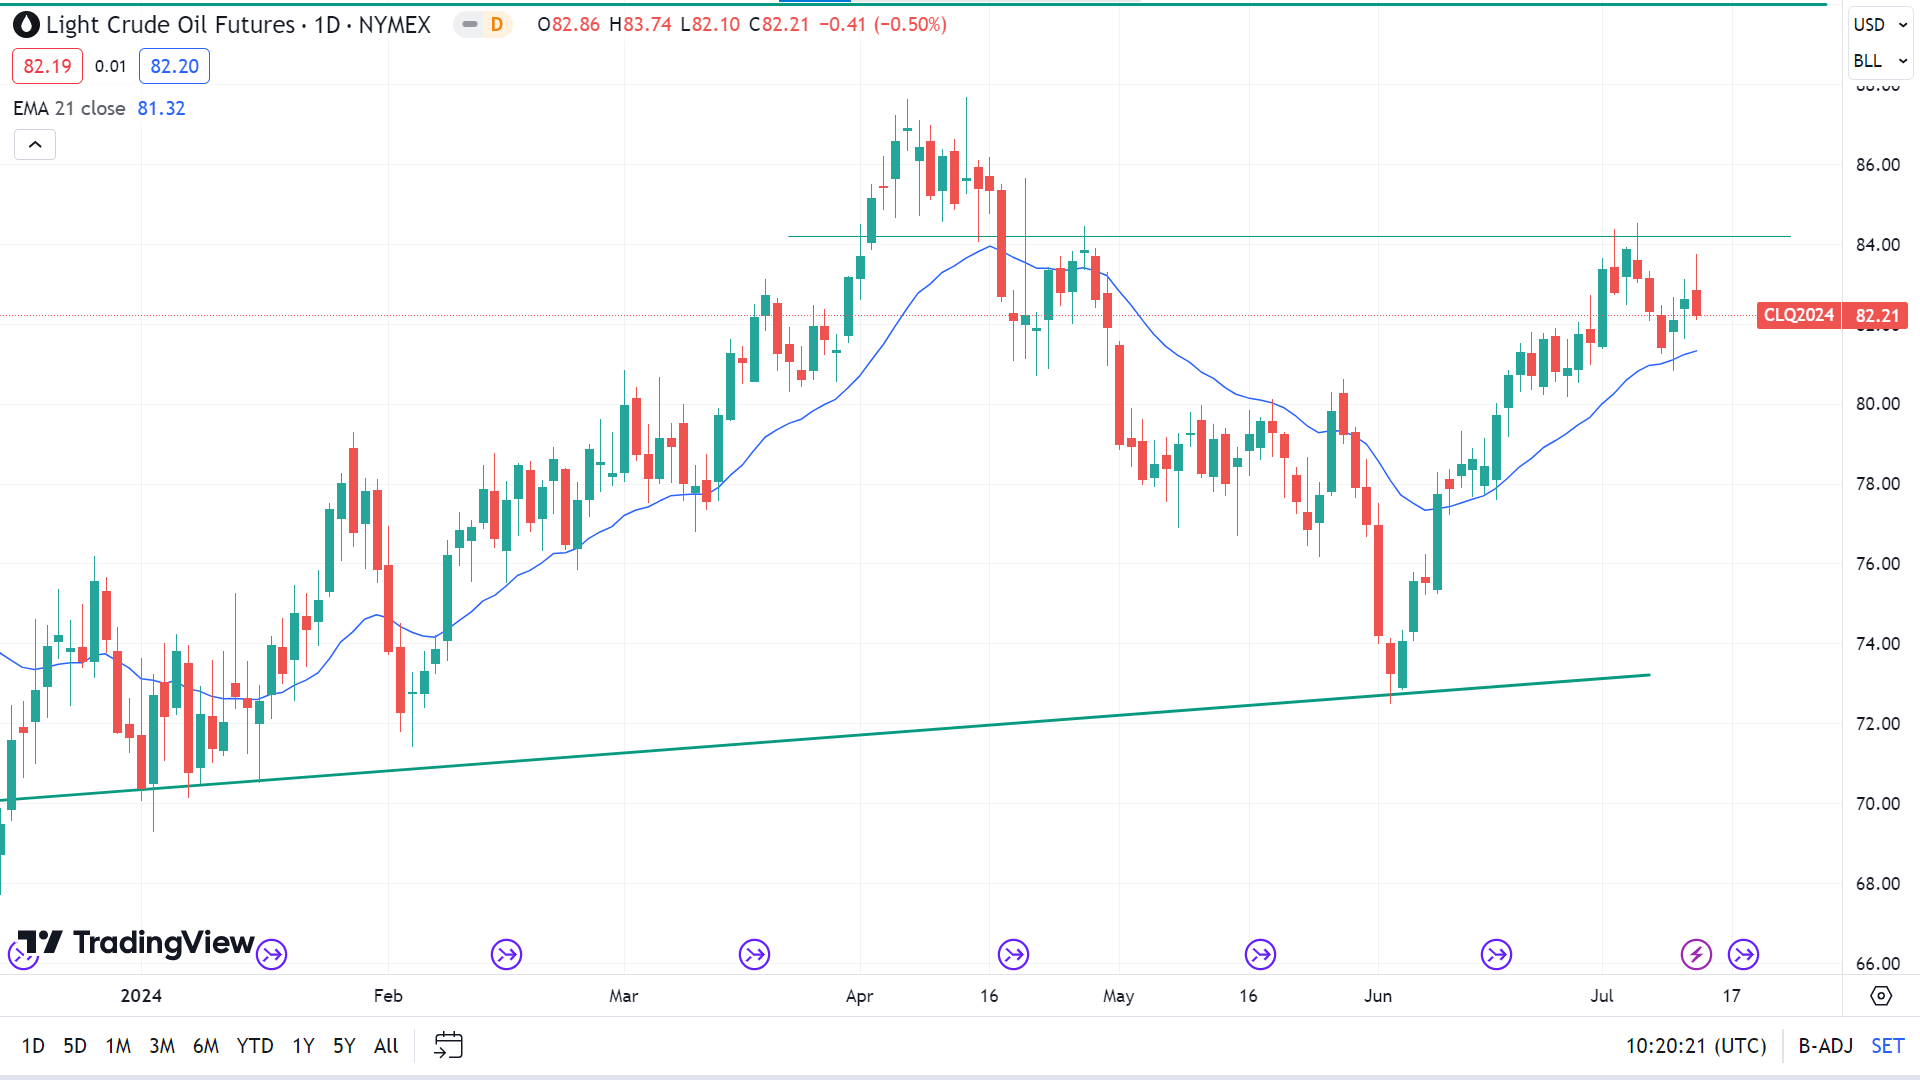
The price still floats above the EMA 21 line, indicating a bullish dominance on the daily chart. Therefore, the price may regain the recent peak of 84.52, followed by the next resistance near 87.39.
On the downside, if the price declines below the EMA 21 level, it can reach the primary support of $80.36, followed by the next support near 78.03.