When JPMorgan Chase & Co. (JPM) will release the outcomes for the quarter that ended in December 2024. The market anticipates that the company will present a yearly profit rise on greater revenue. If these important figures exceed projections, the stock may rise. However, if they fail, the stock might decline.
JPM Quarterly Revenue Forecast
It's worthwhile handicapping the likelihood of a favorable EPS surprise, even though the longevity of the current price move will primarily depend on the company's assessment of business conditions during the earnings call.
This firm anticipates disclosing quarterly profits of $3.99 per share in its next report, which would be a +0.5% increase from the previous year.
Revenues are anticipated to reach $40.92 billion, a 6.1% increase over the previous quarter. Over the past 30 days, the consensus EPS forecast for this period has increased by 0.33% to its current level. The covering experts' combined reevaluation of their initial estimates throughout this time is reflected in this.
JPM's Anticipation On Earnings Call
Investors should remember that each covering analyst's guidance of projection revisions may not necessarily be reflected in an aggregate adjustment.
Analysts frequently consider how well a company has historically met consensus forecasts when estimating its future profits. Therefore, examining the surprise history is worth assessing its impact on the next number.
JPMorgan Chase & Co. surprised everyone by posting earnings of $4.37 per share for the most recent quarter, which was +8.71% more than the predicted $4.02 per share.
The company has exceeded consensus EPS projections four times in the past four quarters.
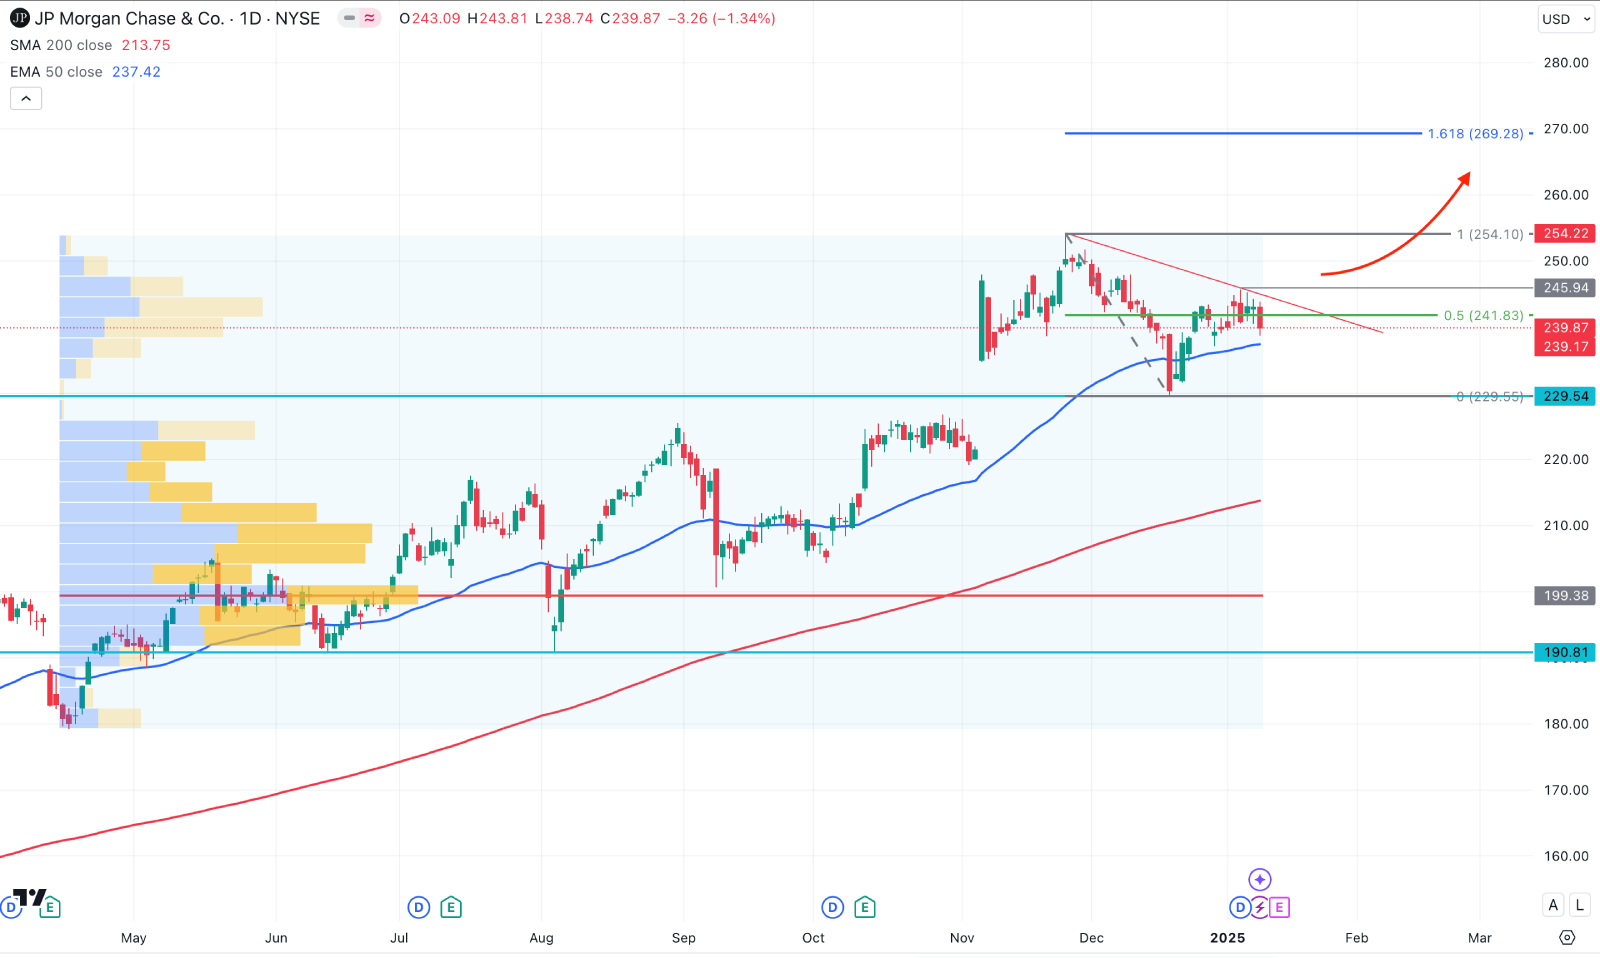
JPM Stock Forecast Technical Analysis

In the daily chart of JPM stock price, a prolonged buying pressure is clear as the price keeps moving higher from the April 2034 low. Moreover, the buying pressure is supported by crucial dynamic lines that are working as supports.
On the other hand, the highest activity level since March 2024 is below the current price, signalling an institution's activity on the bullish side. However, a wider gap is possible, which might result in a bearish recovery as a mean reversion.
In the major structure, the 200 day Simple Moving Average is below the current price, working as a major support. Moreover, the 50 day EMA is the immediate support, from where a bullish recovery is visible.
Based on this outlook, a bullish break from the trendline resistance could be a trend trading opportunity. A daily candle above the 245.94 high could extend the bullish momentum towards the 269.28 level in the coming days.
On the other hand, a downside recovery is possible where the immediate support is at the 229.54 level. A break below this static l;ine could extend the loss and find support from the 200 day SMA line.


