The European Central Bank (ECB) is expected to reduce rates on Thursday, continuing an aggressive rate tightening cycle. The IBEX 35 (ESP35) is already at the record high before the ECB meeting where a potential downside signal is visible from the rising wedge pattern.
A Rate Cut By ECB: Possible Or Not?
Uncertainty surrounds the future trajectory of ECB rates following the June cuts. Existing market anticipations for rate cuts this year are below 60 basis points, corresponding to two rate adjustments with a probability of less than 50% for a third reduction. This is less than the three reductions anticipated for April and a minimum of five for January.
Citi strategists have raised their terminal ECB rate forecasts by 50 basis points to 2%, notwithstanding the decelerating tempo. Potential supply shocks precipitated by geopolitical tensions and climate policies are accountable for this adjustment. Such shocks can increase inflation volatility and the mean inflation rate in the years ahead.
Citi reports that throughout history, European equities have exhibited the highest average monthly performance during ECB policy rate regimes ranging from 2% to 3%.
Financials, constituting around 30% of European earnings, might experience advantageous outcomes from increased rates, as such rates would enhance their profit margins. The higher inflation breakeven points might favor cyclical equities over defensive ones, which would be advantageous for Europe, which is more exposed to cyclicality than the United States.
Economic Releases To Look At
The manufacturing PMI showed a positive outlook, coming at 54.00, which helped to maintain the growth for IBEX 35 (ESP35).
Now, Spanish Services PMI is the only date to examine on Wednesday. The current projection is 56.5, up from 56.2 in the previous month. A higher-than-expected report on services PMI would suggest business growth, supporting IBEX 35.
However, all eyes will be on the ECB rate decision, which currently projects a rate cut of 25 basis points to 4.25%.
IBEX 35 (ESP35) Technical Analysis
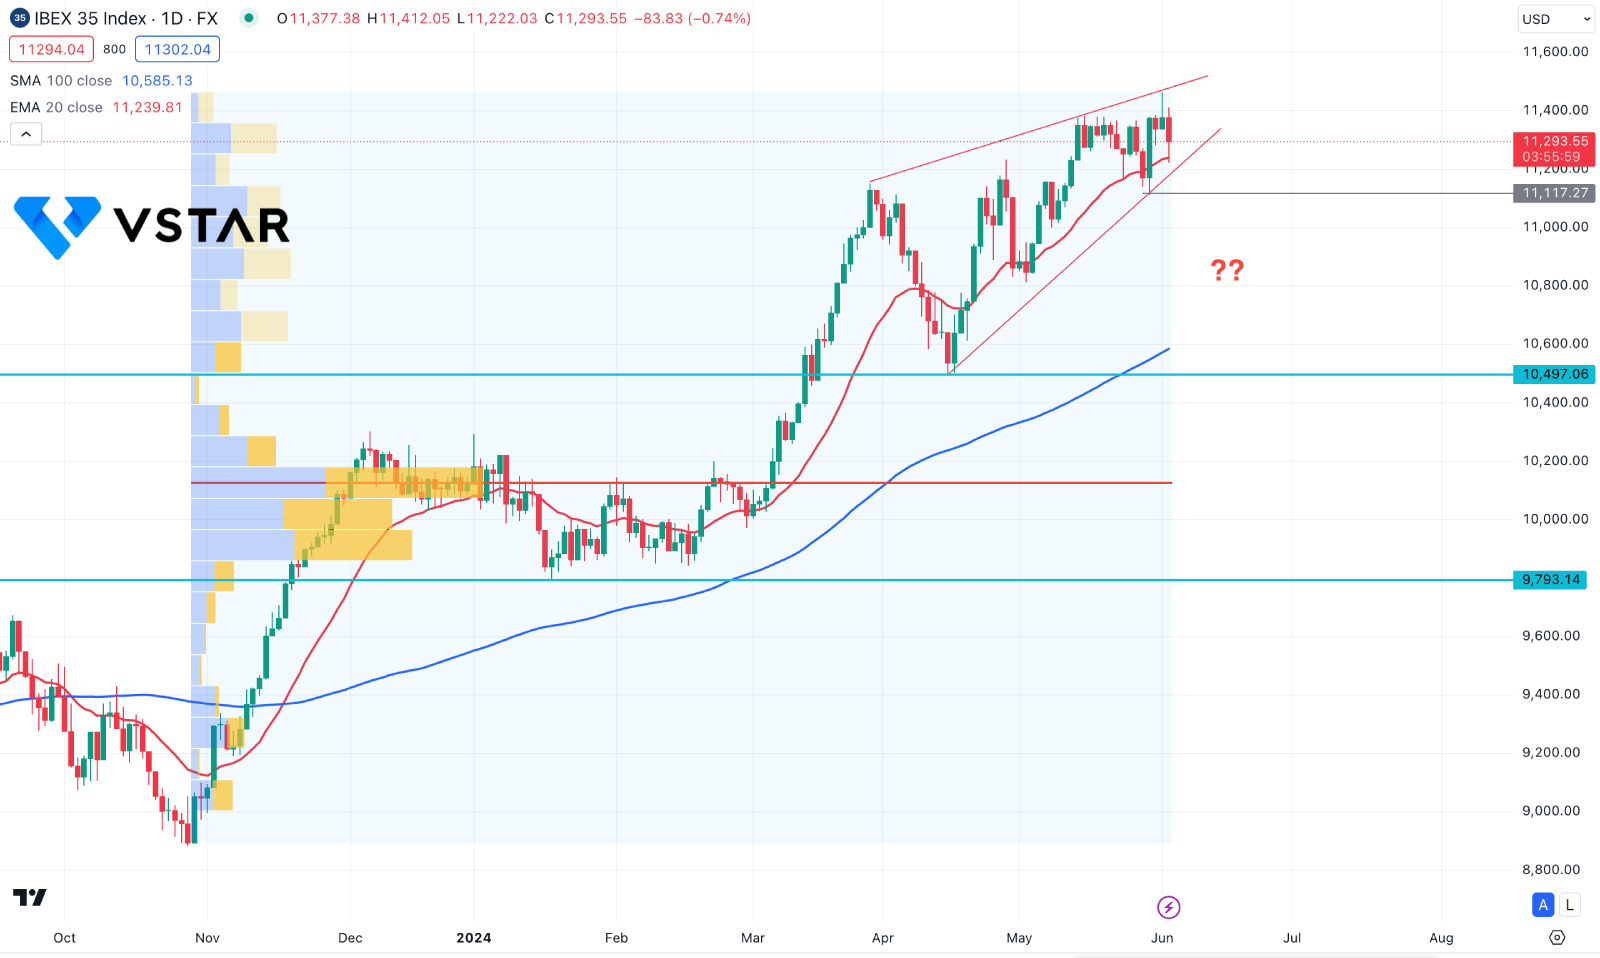
In the daily chart of IBEX 35, an ongoing bullish pressure is visible, where the most recent price shows a corrective momentum.
The 100-day Simple Moving Average remains below the current price, acting as major support. Moreover, the 20-day Exponential Moving Average is immediate support, above the 11117.27 static support line.
Moreover, the high volume level since November 2023 is also way below the current price, which suggests a potential downside correction as a mean reversion.
Based on this outlook, a bearish signal might come after having a valid rising wedge breakout. In that case, a stable market below the 11000.00 level could lower the price towards the 10497.06 support level.
On the other hand, a rebound is possible from the 20-day EMA area, which might extend the giant towards the 11600.00 area.