EURUSD
Fundamental Perspective
Donald Trump will assume office as the 47th president of the United States on Monday, marking his second term. This transition comes as the US Dollar trades near multi-year highs, with the EURUSD pair stabilizing around 1.0300 after briefly hitting 1.0177 earlier in the week.
Speculation surrounding Trump's trade policies is driving market expectations. His promises of substantial tariffs on goods from China, Mexico, and Canada aim to create jobs and reduce the federal deficit. However, such measures could also amplify global financial instability and elevate domestic inflation, influencing the Federal Reserve's monetary strategy. The Fed has already indicated a likely slowdown in the pace of rate cuts in 2025, citing increased uncertainties around trade and immigration policies.
In contrast, the European Central Bank maintains a dovish stance. ECB policymakers recently considered a more prominent rate cut but opted for gradual adjustments. Tepid economic data further underscores the Eurozone's sluggish recovery. Meanwhile, US economic growth remains robust, supported by a strong job market and inflation stabilizing near the Fed's 2% target.
With a resilient US economy and a hawkish Fed contrasting a weaker Eurozone and dovish ECB, EURUSD appears poised to fall below parity. Upcoming economic data could provide direction, but Trump's initial trade moves will likely dominate market sentiment.
Technical Perspective
The last weekly candle ended with a green body and wicks on both sides, reflecting a pause in the current bearish trend and a continuation.
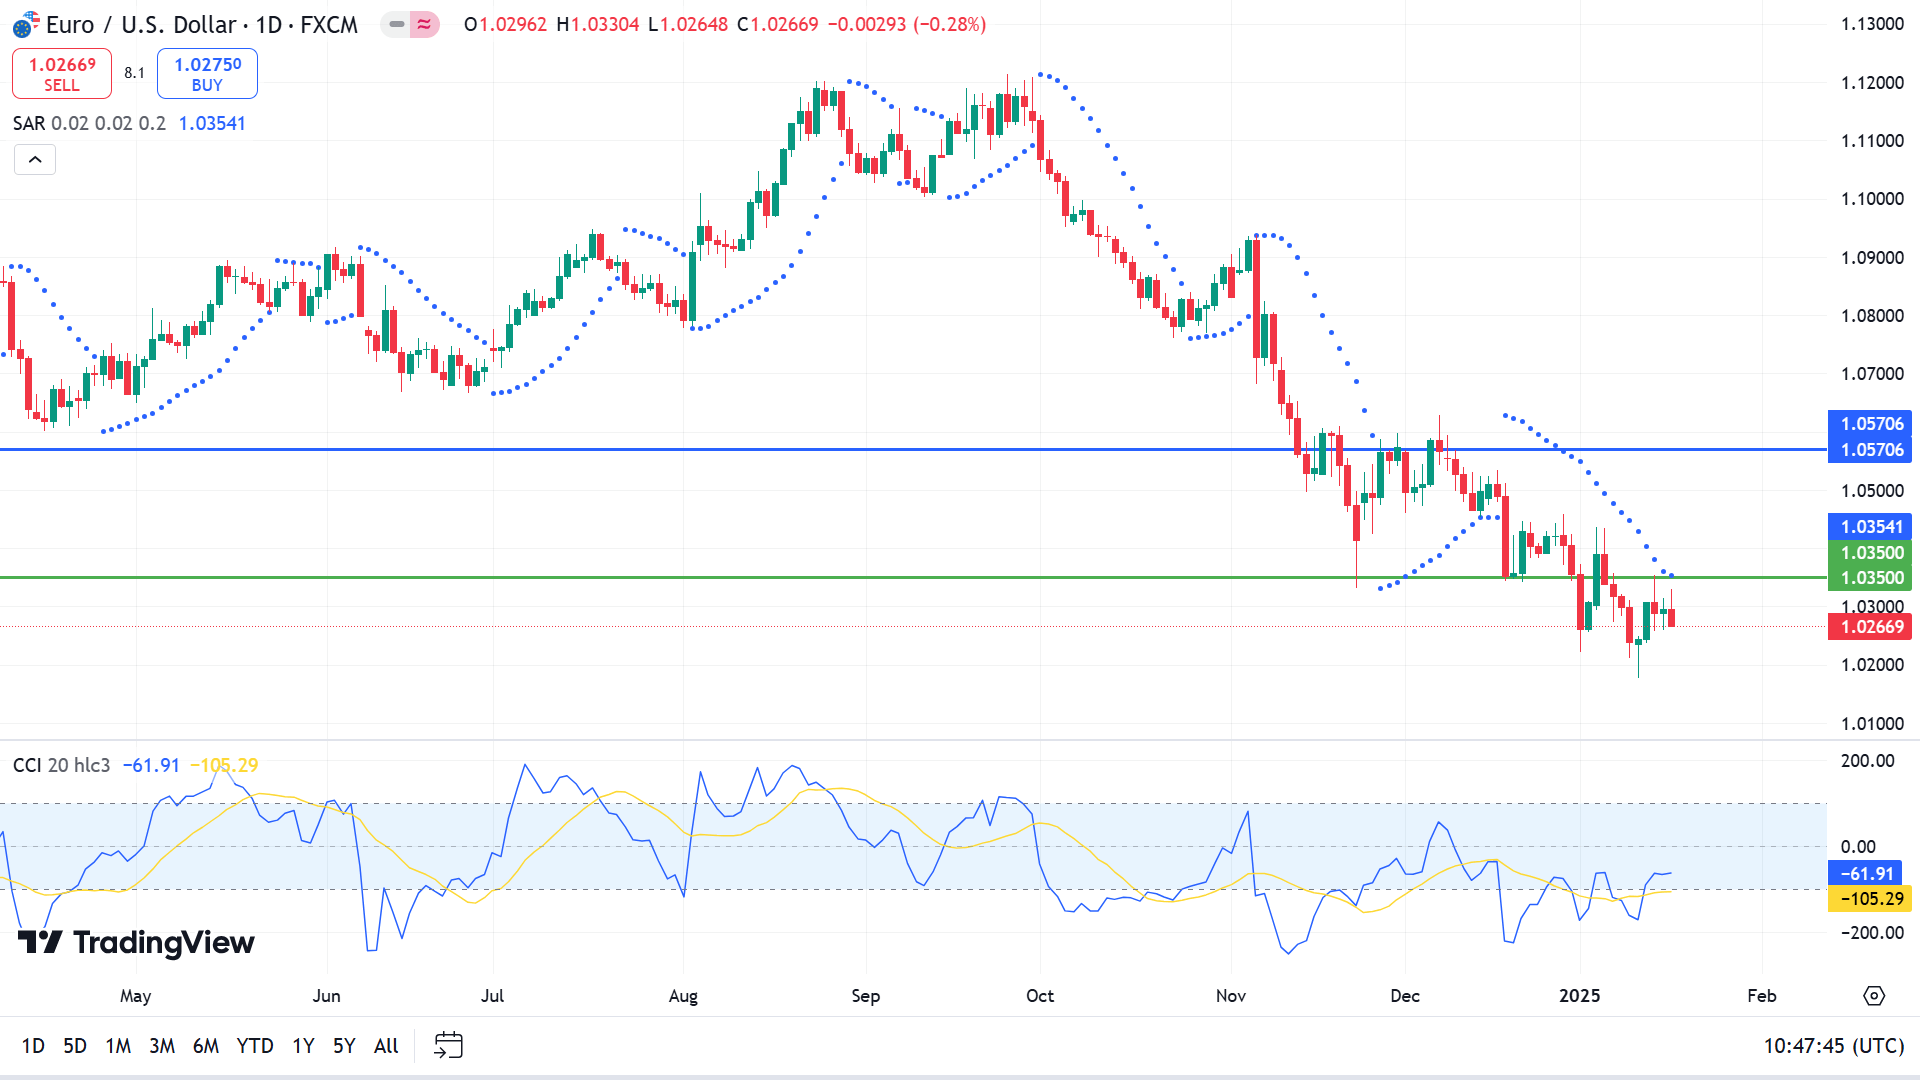
The parabolic SAR dots continue creating dots above the price candles, indicating a bearish trend on the daily chart. The CCI indicator reading remains neutral, with the signal line floating near the lower line of the indicator window.
According to the current scenario, traders might observe the 1.0350 level to open short positions, which can drive the price toward the support of 0.9955.
Meanwhile, a daily green candle closing above 1.0350 might invalidate the current bearish signal and spark optimism for short-term buyers toward the nearest resistance near 1.0570.
GBPJPY
Fundamental Perspective
The Pound Sterling (GBP) fell sharply as the UK Office for National Statistics (ONS) reported a surprise contraction in December Retail Sales, highlighting the economy's fragility. Retail Sales, a key consumer spending measure, declined by 0.3% month-on-month, against expectations of a 0.4% increase. Food store sales volumes dropped 1.9%, the lowest since April 2013, with declines across supermarkets, specialist food outlets, and alcohol and tobacco stores.
The disappointing data has fueled expectations that the Bank of England (BoE) may cut interest rates by 25 basis points to 4.5% in February. Market speculation around rate cuts has grown amid easing inflation and surging government borrowing costs. December's Consumer Price Index (CPI) revealed a sharper-than-expected slowdown in headline inflation, while core inflation grew more modestly than projected. Additionally, 30-year UK gilt yields climbed to 5.48%, their highest level over 26 years, as concerns over inflation and trade risks, particularly potential tariffs under incoming US President Donald Trump, weighed on sentiment.
Looking ahead, UK labour market data for the three months ending in November, due Tuesday, will be closely monitored for signs of economic strain. This data will also reflect the impact of increased employer contributions to National Insurance, which was announced in Chancellor Rachel Reeves's Autumn budget.
The Japanese Yen (JPY) softened after a two-day rally despite reports suggesting that the Bank of Japan (BoJ) may consider raising interest rates in its January 23-24 policy meeting. Governor Kazuo Ueda emphasized the importance of data analysis before any decision.
Technical Perspective
The GBPJPY pair reaches near an adequate demand zone on the weekly chart, posting three consecutive losing candles and leaving sellers optimistic.
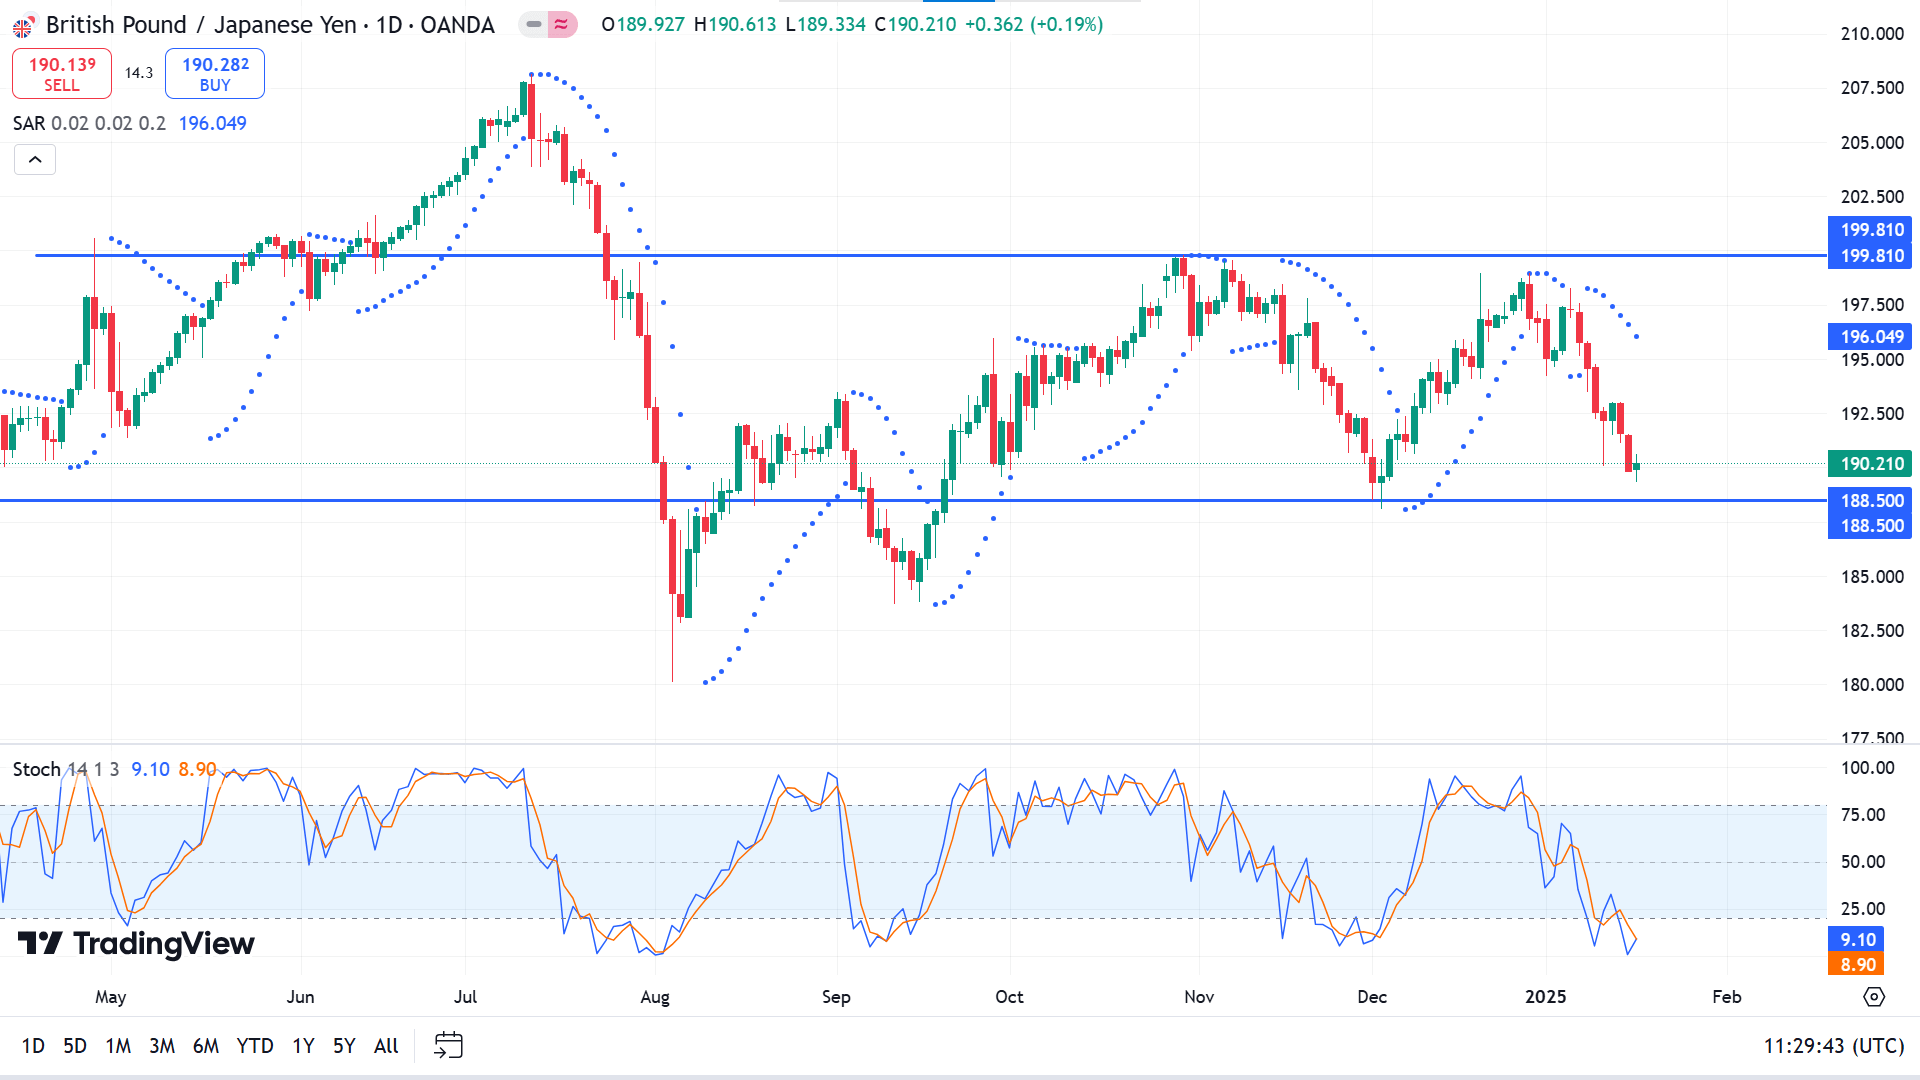
On the daily chart, the Parabolic SAR continues creating dots above the price candles, declaring bearish pressure on the asset price. The Stochastic indicator reading remains neutral, but the dynamic signal lines float below the lower line of the indicator window.
Based on the market context, buyers may observe support at 188.50, which can trigger the price toward resistance near 199.81.
Meanwhile, the price decline below the support of 188.50 might disappoint buyers and enable selling opportunities toward the support near 184.21.
Nasdaq 100 (NAS100)
Fundamental Perspective
US equity markets ended higher as investors analyzed key economic data and the International Monetary Fund's (IMF) improved 2025 growth outlook for the US. The Nasdaq Composite gained 1.5% to close at 19,630.2, while the S&P 500 advanced 1% to 5,996.7, and the Dow Jones Industrial Average increased 0.8% to 43,487.8. Technology and consumer discretionary sectors led the gains, while real estate was flat, and health care was the sole laggard.
For the week, the Dow jumped 3.7%, the S&P 500 increased 2.9%, and the Nasdaq surged 2.5%. US markets will remain closed Monday in observance of Martin Luther King Jr. Day.
In economic developments, December housing starts exceeded expectations, driven by sharp gains in multi-family projects. TD Economics noted that while homebuilding activity will likely trend higher in 2025, fiscal policy uncertainty and its implications for Federal Reserve decisions may constrain short-term growth. According to Federal Reserve data, US industrial production and manufacturing output surpassed projections in December.
The IMF raised its global and US growth forecasts for 2025 but warned of medium-term downside risks. Economic Counsellor Pierre-Olivier Gourinchas highlighted that renewed inflationary pressures could hinder rate cuts, necessitate rate hikes, strengthen the dollar, and widen US external deficits.
Technical Perspective
The last weekly candle finished with a solid green body, covering most of the previous red candle body, declaring buyers may be back on the asset, pushing the price upwards.
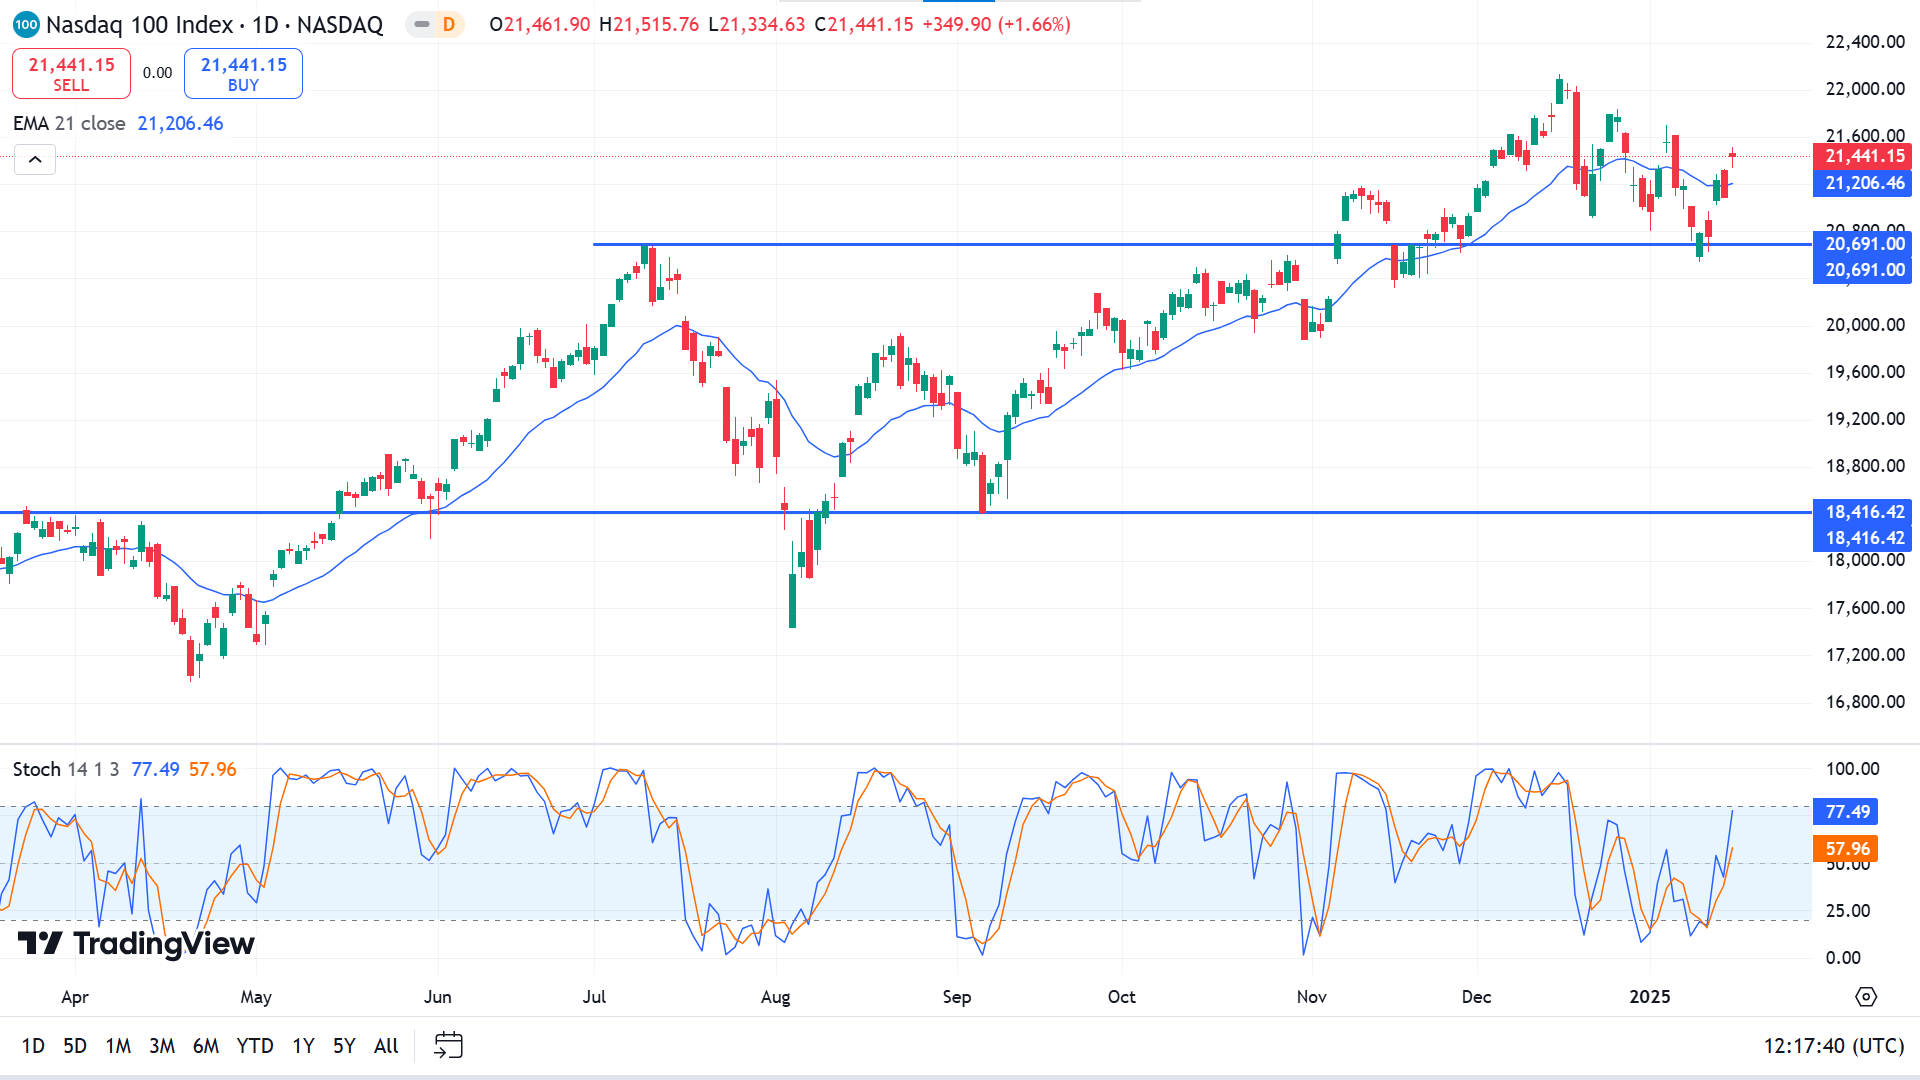
The price hovers above the EMA 21 line on the daily chart, indicating a bullish trend continuation. The Stochastic indicator reading remains neutral, with the signal lines sloping upside.
Based on the current market context, 21,094.20 is a primary buy zone to beat the ATH of 22,133.22. Meanwhile, if the price declines below 20691.00, it might invalidate the current bullish signal besides sparking selling opportunities toward 19,869.65, followed by the next support near 18416.42.
S&P 500 (SPX500)
Fundamental Perspective
The U.S. stock market continued its rally last week, with all S&P 500 sectors posting gains as falling bond yields alleviated investor concerns. The S&P 500 and Dow recorded their most muscular weekly advances since the week of Donald Trump's 2016 presidential election.
A broadening market rally is evident, with the equally weighted S&P 500 outperforming the traditional benchmark, which is heavily weighted toward large-cap tech stocks. Louis Navellier, chief investment officer at Navellier, highlighted the significance of this development, describing it as a positive sign of market recovery driven by the recent correction in interest rates. After a volatile start to 2025, characterized by surging Treasury yields, the market's breadth expands as Trump's inauguration approaches.
FactSet data showed that financials, energy, and materials emerged as the top-performing sectors in the S&P 500, each surging approximately 6%. Financials were bolstered by strong fourth-quarter earnings from major banks, including Citigroup, Goldman Sachs, and Morgan Stanley, all of which saw weekly gains of around 12%.
Technical Perspective
The last weekly candle ended with a solid green body exceeding the range of the previous red candle, indicating significant bullish pressure on the asset.
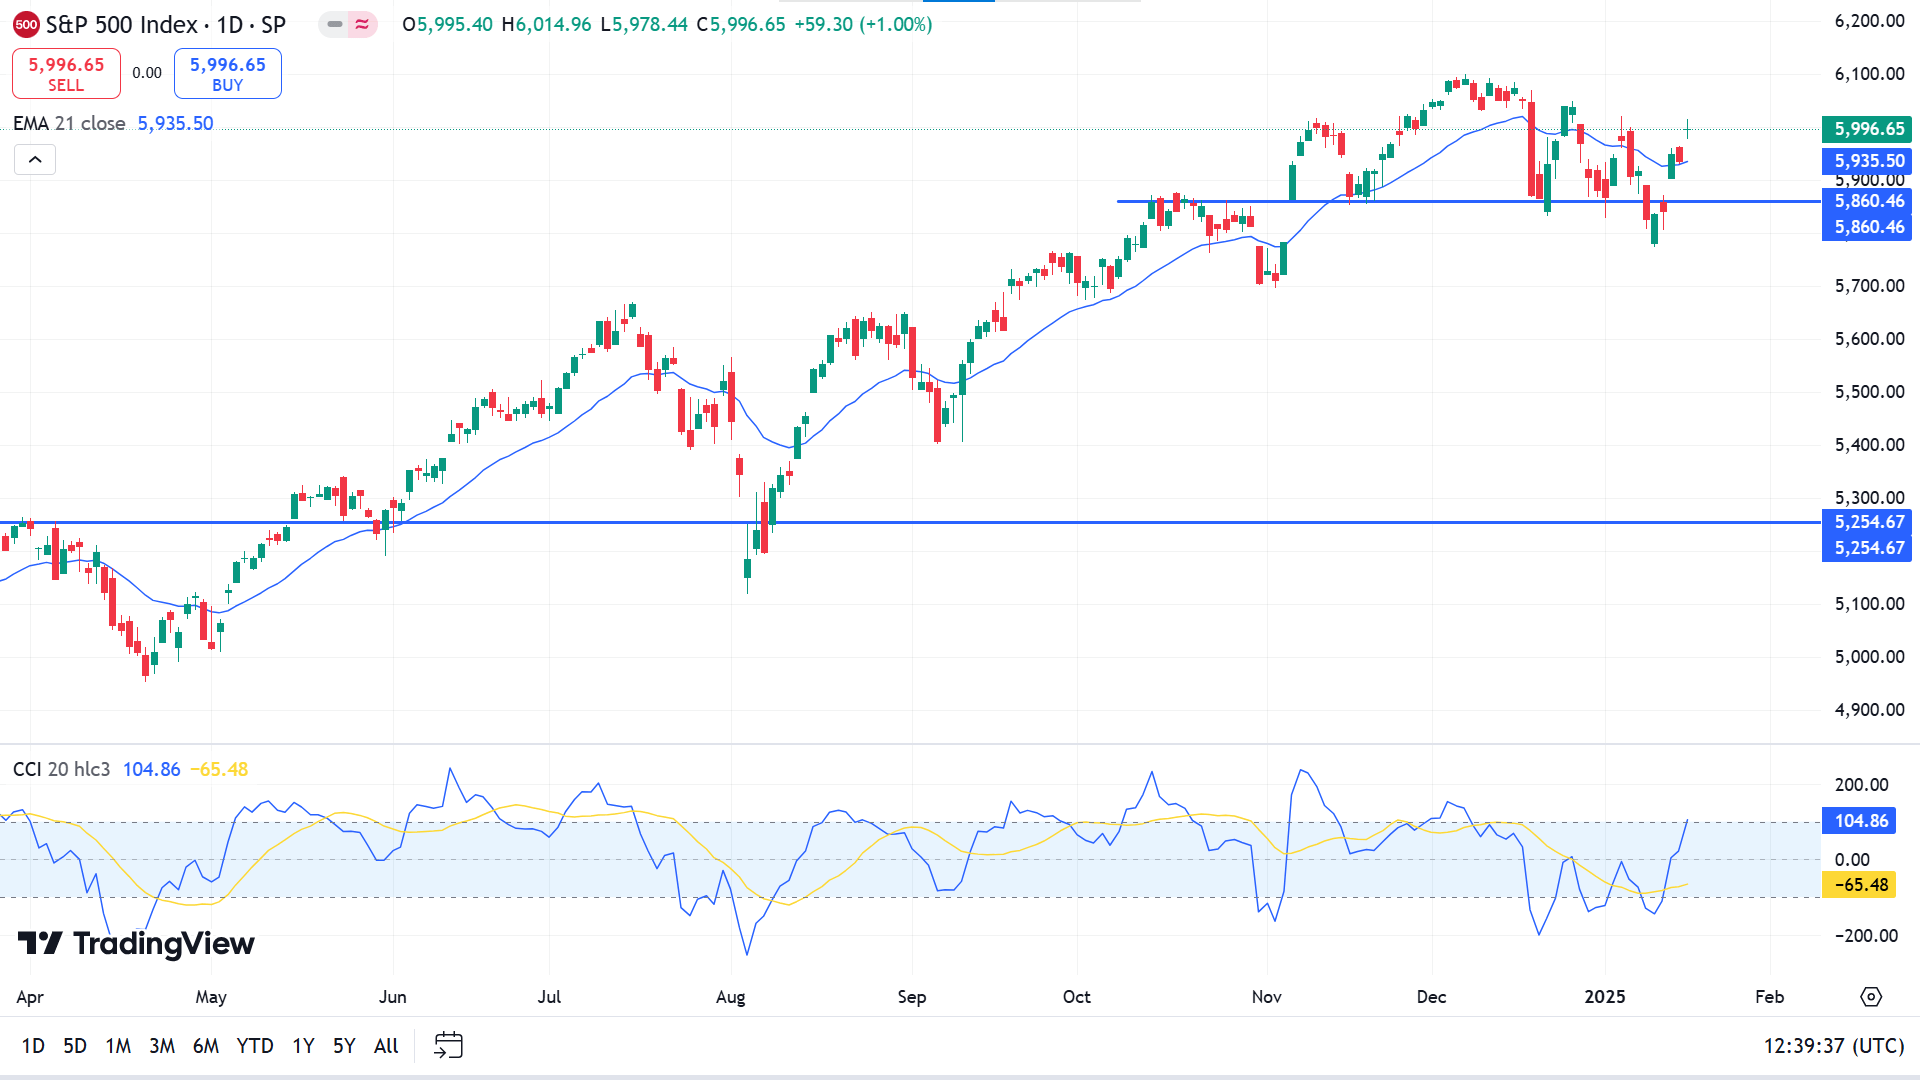
The price is above the EMA 21 line on the daily chart, indicating a bullish trend. The CCI reading remains neutral, with the dynamic signal line sloping upside closer to the upper line of the indicator window.
According to this price action, the buy zone starts near 5,902.80, which might drive the price toward the ATH of 6,099.97 or beyond.
On the other hand, buyers might reconsider their positions if the price drops below the support of 5860.46, invalidating the current bullish signal. It would spark short-term selling opportunities toward 5,626.77, followed by the next support near 5254.67.
Gold (XAUUSD)
Fundamental Perspective
Gold (XAUUSD) continued its upward trajectory last week, surpassing $2,720 per troy ounce for the first time since mid-December, where initial resistance has emerged. The precious metal rally began early in the year and gained momentum as the US Dollar (USD) weakened.
The US Dollar Index (DXY) reversed its six-week winning streak, retreating despite reaching fresh cycle highs earlier. Softer-than-expected US Consumer Price Index (CPI) data renewed speculation that the Federal Reserve (Fed) could maintain its rate-cutting path this year. This outlook pushed US Treasury yields lower, further pressuring the USD and enhancing Gold's appeal as a safe-haven asset.
Additional support for Gold comes from concerns over potential inflationary pressures stemming from the Trump administration's proposed tariffs on European and Chinese imports, alongside looser corporate regulations and fiscal policies. These measures could fuel consumer price increases, potentially altering the Fed's easing trajectory or even prompting tighter monetary policy.
The possibility of rising US inflation and its impact on Fed decisions will likely sustain Gold's upward momentum. Should tariffs and fiscal measures take effect, they may further support the metal's recovery as investors reassess the economic landscape.
Technical Perspective
The three consecutive gaining candles on the weekly chart declare a bullish trend and leave buyers optimistic.
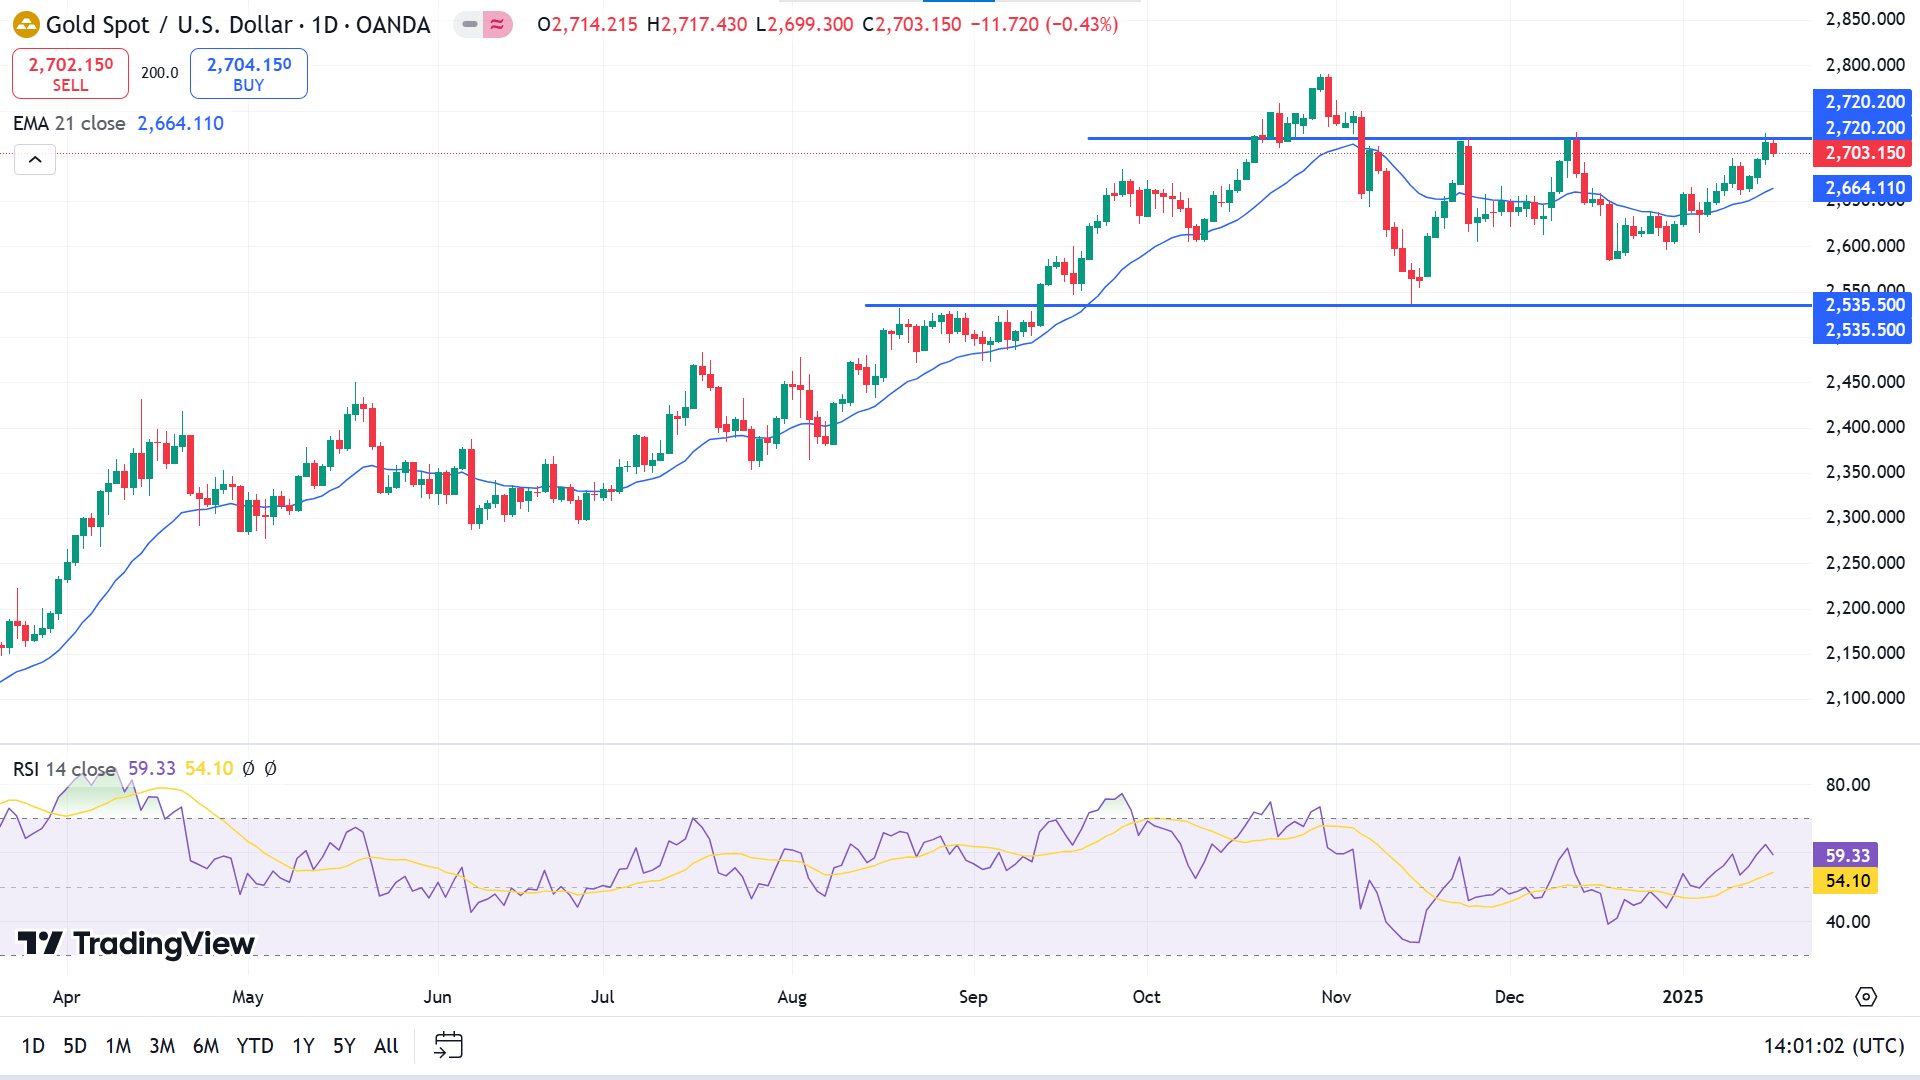
On the daily chart, the price floats above the EMA 21 line, declaring buyers' domination on the asset price. The RSI indicator reading remains neutral, with the dynamic line hovering below the upper line of the indicator window, edging downside.
The price reaches an adequate resistance near 2720.20, creating a possible triple-top pattern. According to the current market scenario, sellers are optimistic about the resistance as the level previously worked as a buy barrier, which might turn the price toward the support near 2535.50.
On the other hand, if the price breaks above 2720.20, it will indicate significant bullish pressure to regain the ATH of 2790.17 or beyond that level.
Bitcoin (BTCUSD)
Fundamental Perspective
Bitcoin (BTC) soared to $104,254, fueled by speculation of a Trump-driven rally ahead of Monday's inauguration. The crypto market's capitalization surpassed $3.78 billion, climbing over 4% in 24 hours, as traders and investors anticipated the first-ever “crypto president” designating cryptocurrency a national priority.
A Bloomberg report suggests that President-elect Donald Trump plans to issue an executive order declaring cryptocurrency a “national priority,” potentially directing government agencies to collaborate with the crypto industry. Sources close to the matter indicate the order could also lead to the creation of a crypto advisory council. While details remain under wraps, the announcement may come as soon as Monday.
The President-elect's approach has garnered significant support from crypto firms and political action committees funded by major players like Ripple Labs and Coinbase. During the Biden administration, the industry faced mounting lawsuits from regulators such as the Securities and Exchange Commission (SEC), creating friction between the government and crypto firms.
Bloomberg speculates that Trump's administration may prioritize building a national Bitcoin reserve, halting legal actions against crypto companies, and formalizing crypto's role in the U.S. economy. These measures could signal a transformative era for the crypto industry under Trump's leadership.
Technical Perspective
BTC's price hovered below the ATH, recovering the loss of previous weeks. It ended with a large green candle, leaving buyers optimistic on the weekly chart.
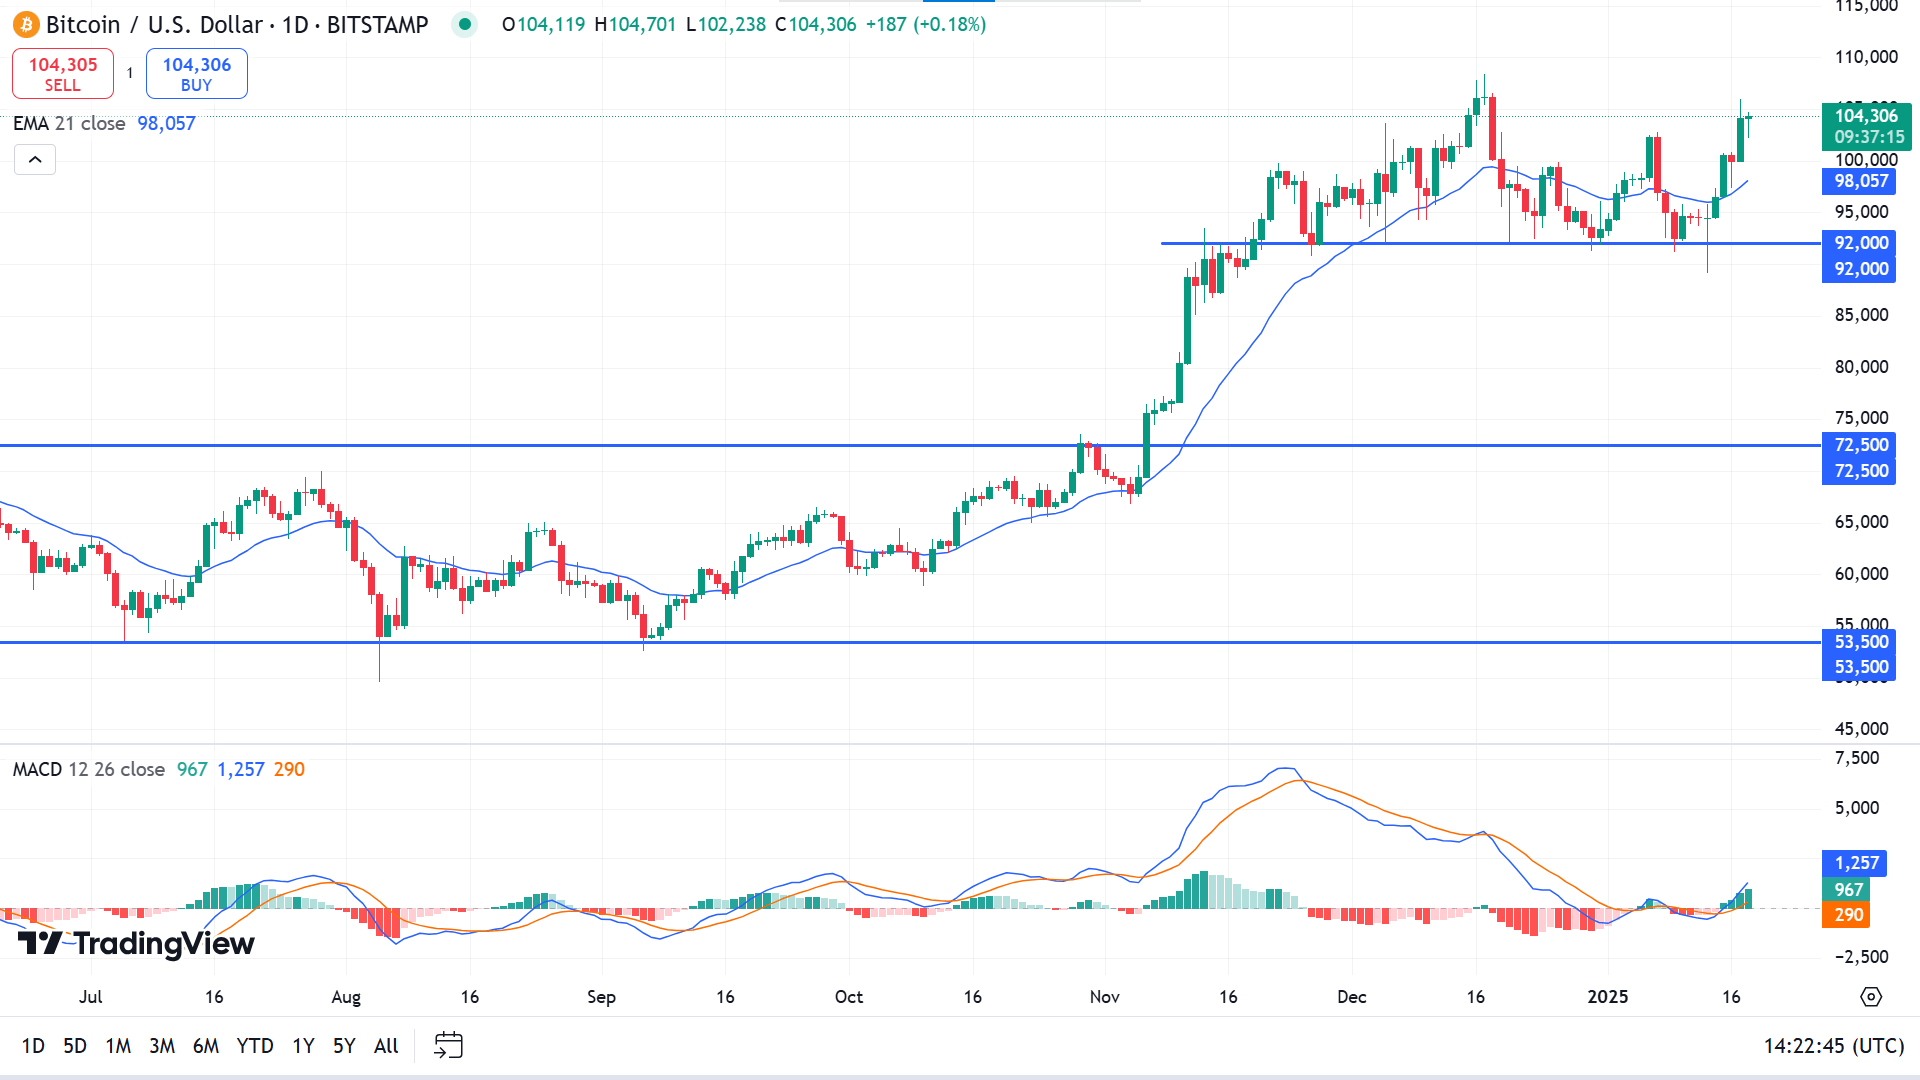
The price recovers from support and moves above the EMA 21 line, indicating solid bullish pressure on the asset price. The MACD indicator reading supports the buoyant buying force, with dynamic signal lines sloped upside down and green histogram bars above the midline of the indicator window.
Based on the broader market context, buyers are active near 94,666 to regain the ATH of 108,364, following the next anticipated Fibonacci resistance near 114,736.
On the other hand, if the price declines below the support of 92,000, it might disappoint buyers and enable short-term selling opportunities toward the next support near 80,735.
Ethereum (ETHUSD)
Fundamental Perspective
PostFinance AG unveiled its Ethereum staking service, allowing customers to earn passive income by securing the network. The bank, which began offering crypto services last year, plans to expand into other digital assets. Staking, a process that rewards users for locking their ETH, has seen growing adoption. Staked ETH reached a record 35,000 ETH—about 30% of Ethereum's supply—before retreating following the recent crypto rally.
With the incoming Trump administration favouring crypto, many anticipate Wall Street firms may introduce similar staking services. Standard Chartered and Bernstein Analysts predict staking will soon become integral to Ethereum ETFs, potentially transforming ETH into a financial instrument akin to an “internet bond.”
Initially, issuers excluded staking from ETH ETF filings due to the SEC's opposition. However, a leadership change to pro-crypto Paul Atkins as SEC Chair could shift regulatory perspectives, paving the way for staking integration. Ethereum ETFs could see significant inflows if approved, with experts projecting they may eventually outpace Bitcoin ETFs in assets under management.
Technical Perspective
The last weekly candle, shaped as a green doji candle after a solid red, reflects a pause and sparks optimism for buyers as it occurs above an acceptable support level.
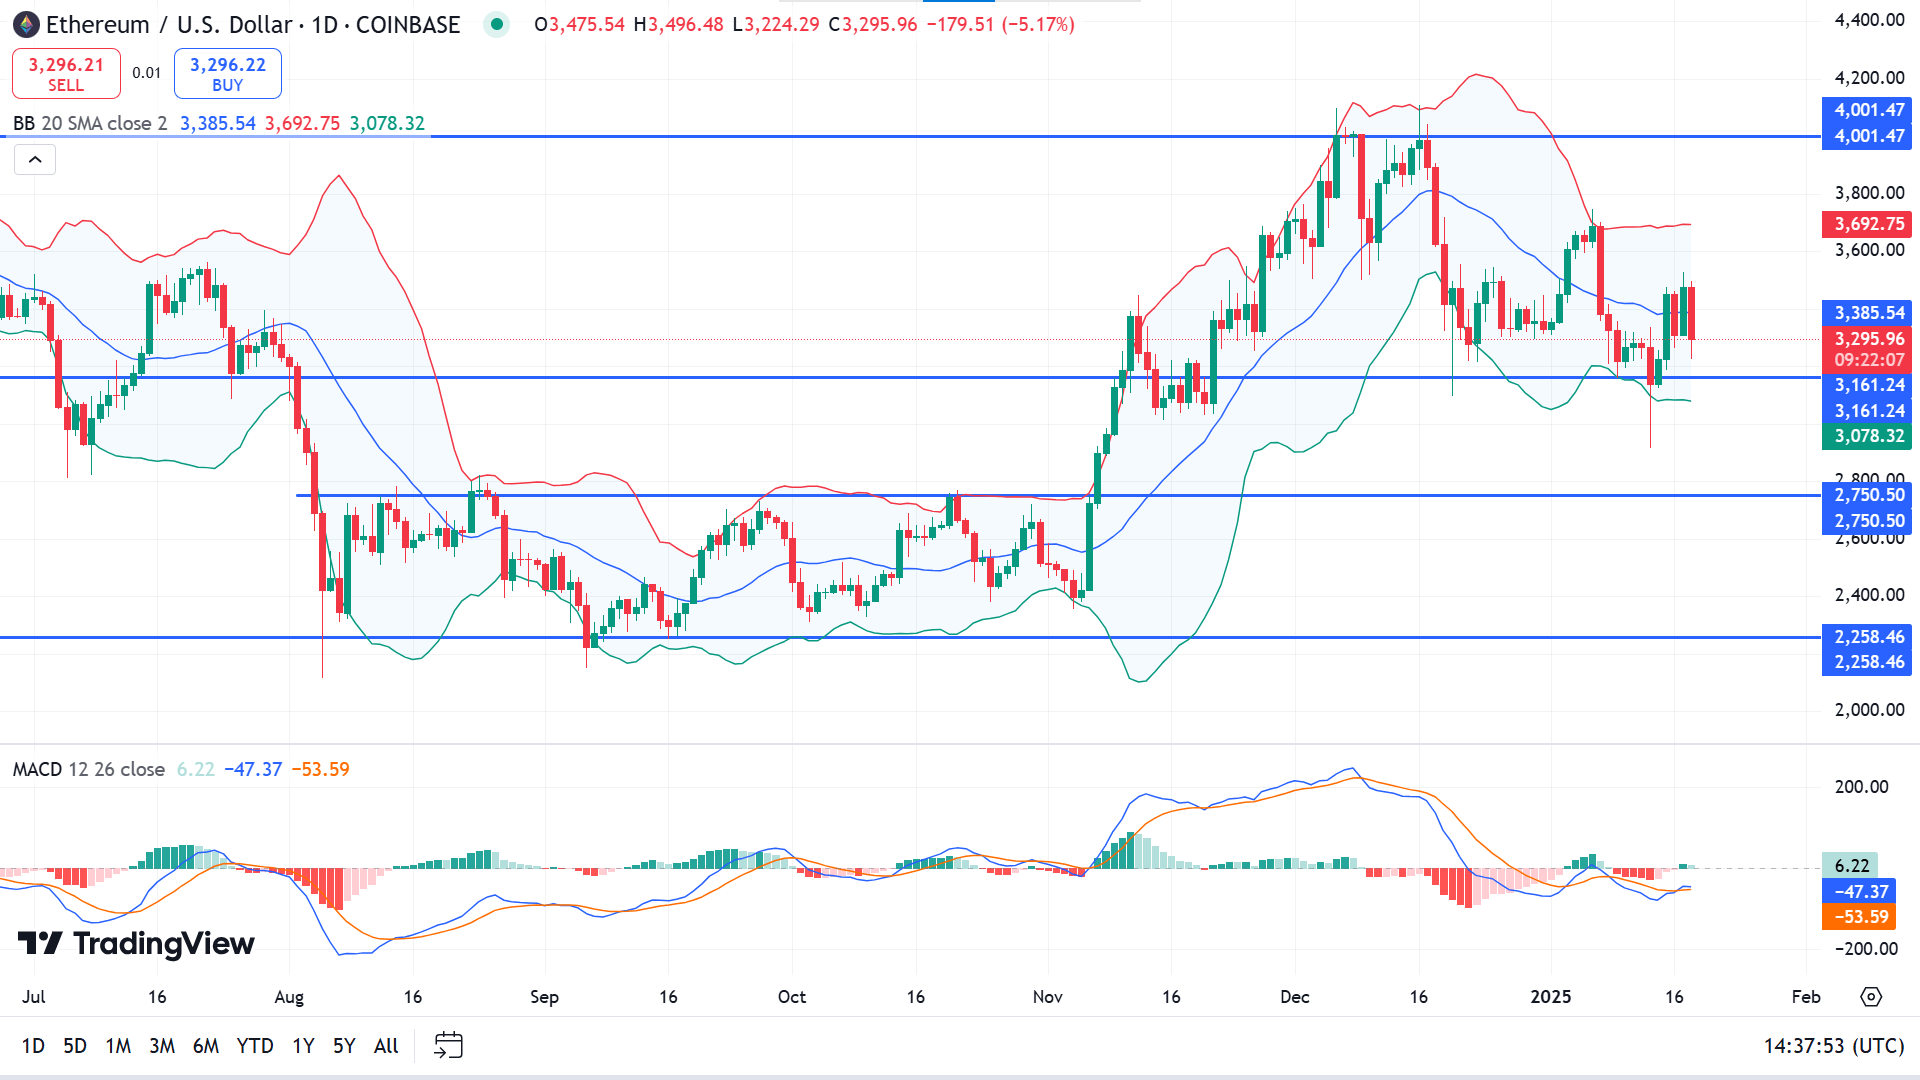
The price consolidates at the middle band of the Bollinger band indicator, leaving mixed signals, with the current trend remaining bearish. The MACD indicator reading remains bullish, with the dynamic signal lines creating a bullish crossover below the midline, and green histogram bars appear.
Based on the indicators' readings, the adequate buy level is above 3161.24, which would beat the resistance of 4001.47. Meanwhile, if the price declines below 3161.24, it might invalidate the current bullish signal and enable short-term selling opportunities toward the following support near 2750.50.
Tesla Stock (TSLA)
Fundamental Perspective
Tesla (TSLA) remains one of the most volatile mega-cap tech stocks, where timing often plays a pivotal role in investor outcomes. While the company's advancements in electric vehicles (EVs) and artificial intelligence (AI) are promising, a cautious stance is prudent as Jan. 20 approaches—a potentially key date for Tesla investors.
Between Jan. 1 and Nov. 4, 2024, Tesla's stock dropped 2.3%, underperforming the S&P 500, with a steep decline of 42.8% at its lowest. However, the stock rebounded sharply after Donald Trump's election victory on Nov. 5, surging 66.3% by year-end and reclaiming its trillion-dollar market cap. Elon Musk's vocal support for Trump sparked investor optimism, with many viewing their alignment as a strategic advantage for Tesla's growth.
Despite this rally, Tesla's stock has stumbled, dropping 14.3% since Christmas Eve. The sell-off reflects a mix of profit-taking after significant short-term gains and disappointing Q4 delivery and production figures that fell short of Wall Street estimates.
As Jan. 20 approaches—a date seen as significant for Tesla due to potential policy changes or announcements—the stock may rebound. While recent performance raises concerns, investors remain focused on Tesla's long-term prospects in EVs and AI and its potential to capitalize on favorable political tailwinds.
Technical Perspective
The last weekly candle ended in solid green, recovering from the previous two weeks' loss, leaving buyers optimistic.
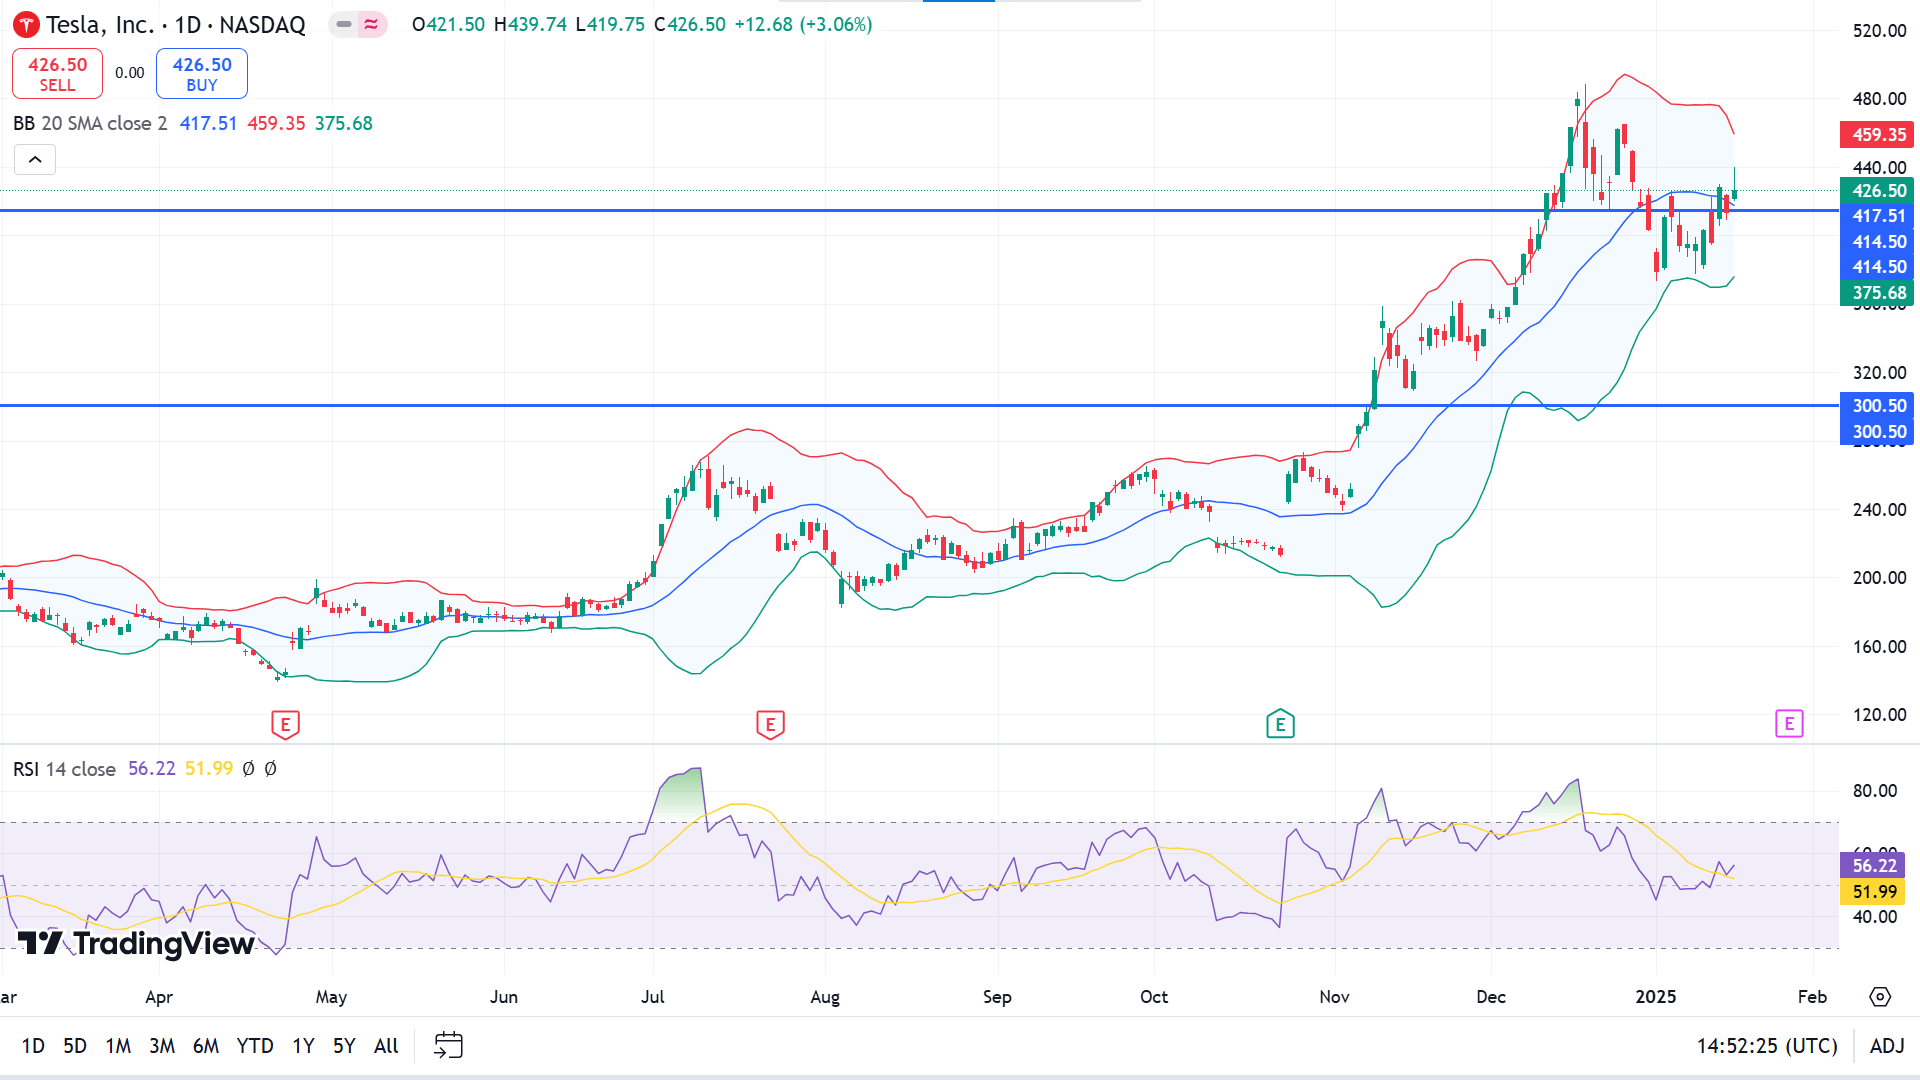
The price exceeds the midline of the Bollinger band, declaring a bullish trend. The RSI indicator reading remains neutral, supporting the bullish pressure through the dynamic line edging upside above the midline of the indicator window.
According to the current scenario, buyers above 414.50 to beat the ATH and reach the anticipated 500 level. However, buyers would be disappointed if the price drops and remains below the 414.50 support; it might trigger the price toward the primary support of 353.78.
Nvidia Stock (NVDA)
Fundamental Perspective
Nvidia (NVDA) has cemented its position as a leader in the artificial intelligence (AI) accelerator market, driving remarkable revenue growth and solidifying its status as the most extensive semiconductor stock by market cap after Apple. Over the past three years, its data centre segment, powered by AI chips, has grown to contribute 88% of its revenue, underscoring its dominance in this fast-expanding industry.
According to Grand View Research, the AI chip market is projected to grow at a compound annual rate of 29% through 2030, and Nvidia is well-positioned to benefit. Its innovative accelerators, supported by the CUDA software platform, give it a significant edge. At CES, Nvidia unveiled cutting-edge products, including a Blackwell architecture graphics card and AI-driven technologies designed for humanoid robots and autonomous vehicles, reinforcing its pivotal role in shaping the future of technology.
Financially, Nvidia's performance is impressive, with fiscal Q3 2024 revenue of $35 billion—a 94% increase year-over-year—and net income surging 109% to $19 billion. However, triple-digit growth rates are unsustainable, and Nvidia's lofty valuation poses risks. Its price-to-earnings ratio of 53 and price-to-book ratio of 51 significantly exceed industry averages, raising concerns about potential overvaluation.
While Nvidia's innovation and leadership position remains compelling, its high valuation and exposure to the semiconductor industry's cyclicality could make it vulnerable to market corrections. Investors should weigh these factors carefully before considering the stock.
Technical Perspective
The last weekly candle ended green, recovering from the loss after a decline toward the support near 130.50.
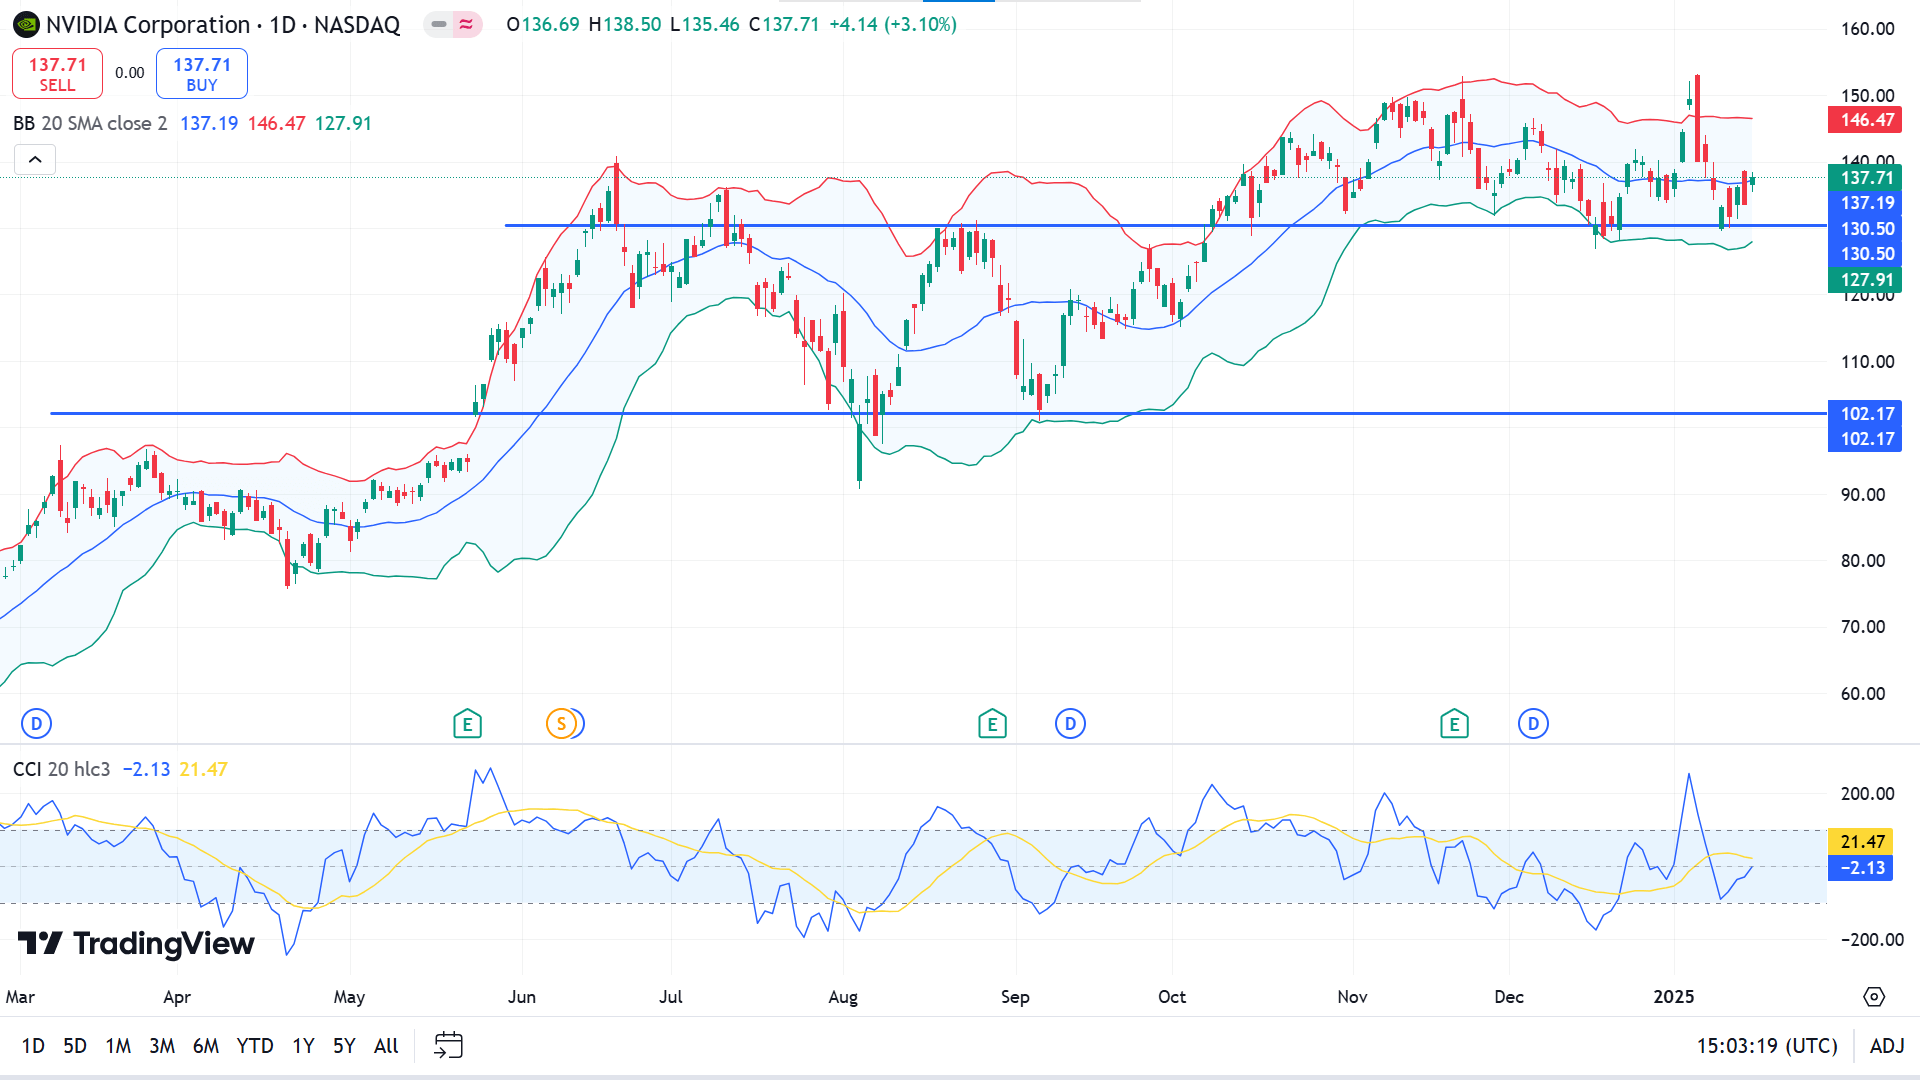
The Bollinger band indicator shows the price remains sideways, closer to the middle band of the indicator. The CCI indicator reading remains neutral, with the dynamic line hovering closer to the midline of the indicator window, edging upside.
According to the current scenario, buyers might be observing the primary support of 130.50 to beat the ATH of 153.13 or beyond.
Meanwhile, if the primary support of 130.50 fails to hold and the price declines below the level, it might disappoint buyers. A breakout below the support might trigger short-term selling opportunities toward the nearest support of 117.92.
WTI Crude Oil (USOUSD)
Fundamental Perspective
WTI crude oil is trading near $77.85 on Friday, dipping slightly as expectations rise that Houthi attacks on shipping in the Red Sea will cease following a ceasefire between Israel and Hamas in Gaza. Maritime security officials anticipate a formal announcement from the Houthi militia, which could ease the security concerns that have previously kept oil prices elevated.
Additionally, strong U.S. retail sales in December signal robust economic demand. The Federal Reserve's cautious approach to interest rate cuts may support the U.S. dollar, potentially weighing on the price of dollar-denominated oil. With the Federal Open Market Committee meeting set for January 28-29, markets are not pricing in any significant rate changes.
On the demand side, analysts forecast a 1.4 million barrels per day increase in oil consumption, driven by increased travel in India for a major festival and the upcoming Lunar New Year in China. Oil traders will also watch for China's fourth-quarter GDP data, retail sales, and industrial production figures, as any signs of recovery in the Chinese economy could further support WTI prices.
Technical Perspective
Four consecutive gaining candles on the weekly chart declare a demand surge for the asset, but the upper wick of the last green candle draws the seller's attention.
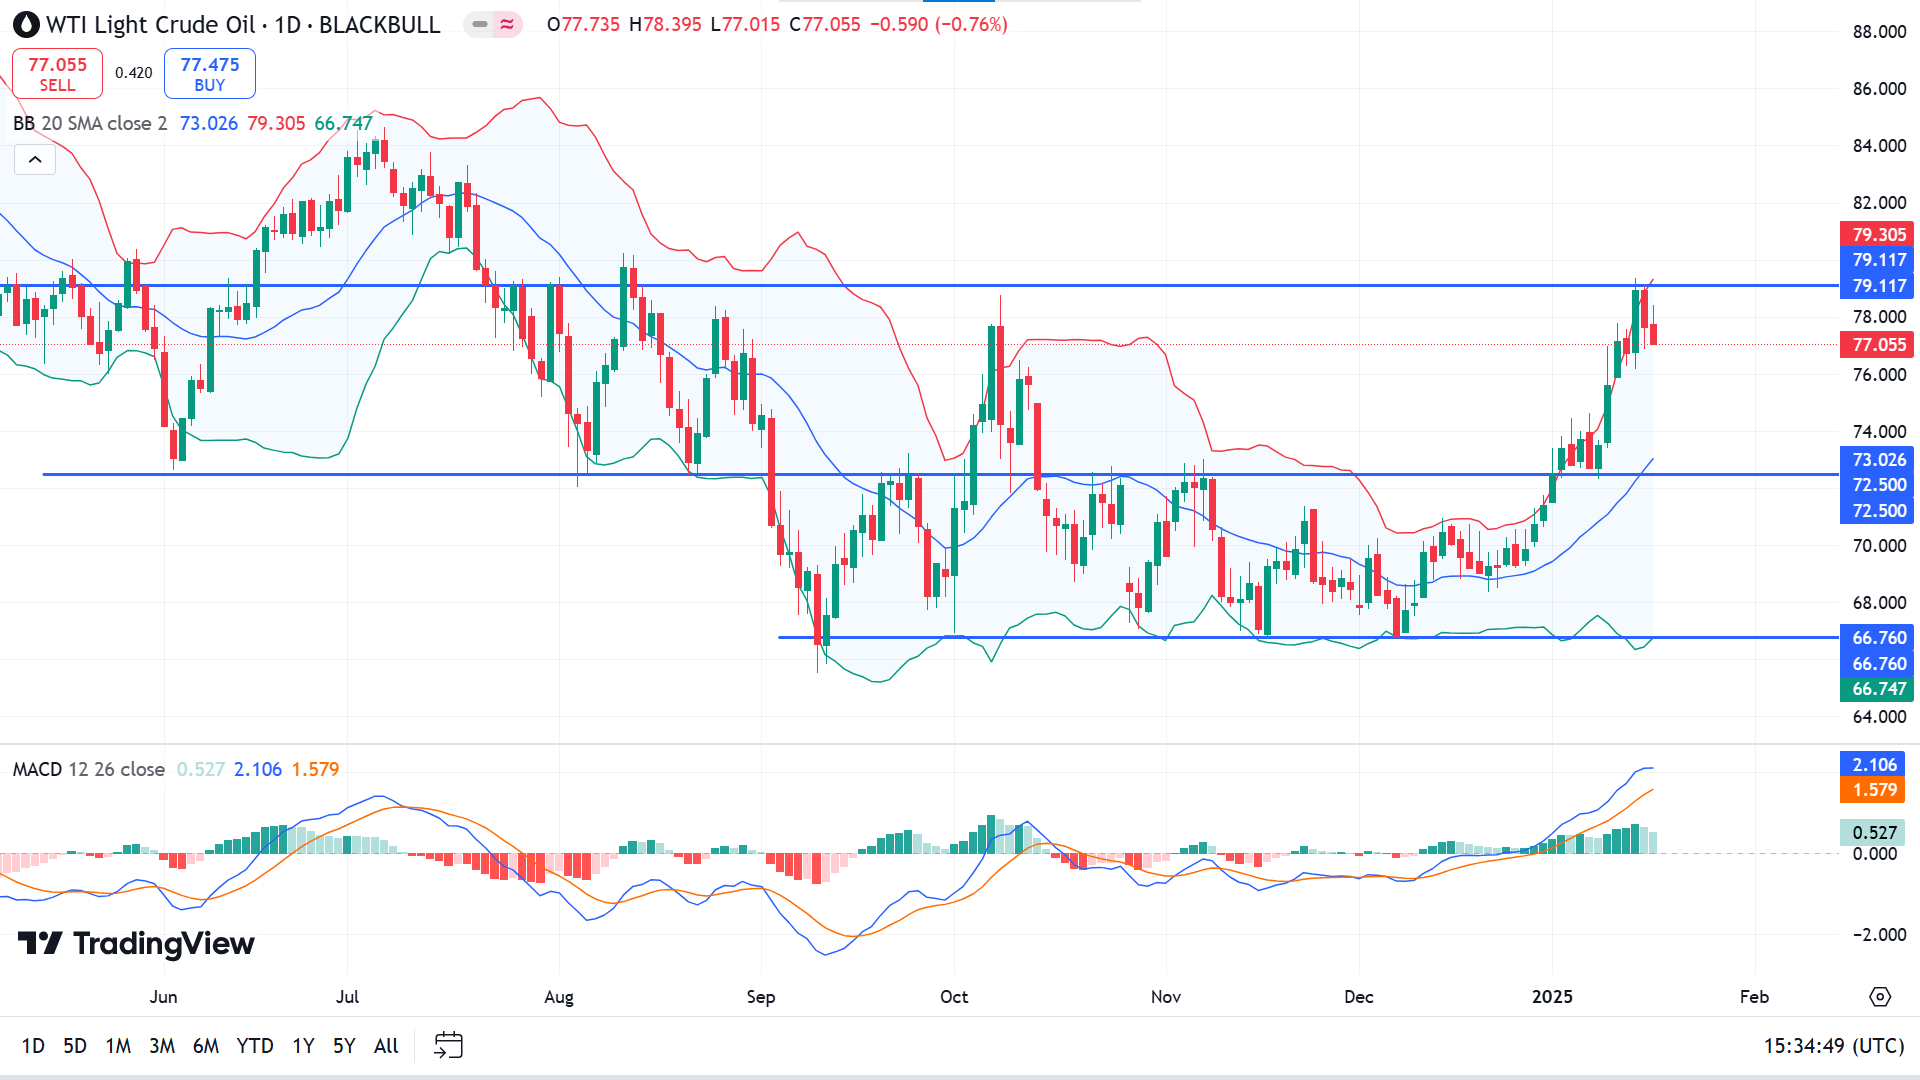
The price reaches the upper Bollinger band on the daily chart, which indicates hugely bullish pressure and sometimes overbought. The MACD reading suggests buy, but the green histogram bars are fading, indicating decreasing bullish pressure.
Based on the indicators' readings, the price reaches a resistance near 79.11, an adequate demand zone that might trigger the price toward the nearest supply zone near 72.50.
On the other hand, the current bearish signal would be invalidated if the price surpasses the resistance of 79.11. It might trigger buyers to be optimistic toward the nearest resistance of 83.42.


