For the quarter ending in November 2024, the market expects Jefferies (JEF) to report earnings greater than they were the previous year due to increasing revenues. This consensus outlook provides a crucial context for assessing the company's profit performance. However, the degree to which the actual outcomes match or differ from these expectations will be a significant determinant of the stock price shortly.
JEF Earnings Projection
On January 8, 2025, Jefferies is expected to publish its earnings report. The stock may gain momentum if the published numbers exceed analysts' projections. On the other hand, the stock can experience downward pressure if there is a deficiency compared to expectations.
Jefferies is expected to report quarterly earnings of $0.85 per share, representing an increase of +183.3% over the previous year. Over the last 30 days, the consensus EPS estimate has not changed, suggesting that analysts have mainly reiterated their projections for the business. It is crucial to remember that this consensus stability could not adequately capture the subtleties of individual analyst revisions.
JEF Earnings Growth Analysis
Jefferies reported $0.75 per share for the prior quarter, a negative surprise of -6.25%. The company was expected to report $0.80 per share. However, the company's EPS surpassed consensus predictions in three of the last four quarters, highlighting its track record of exceeding expectations.
Management's comments about business circumstances during the earnings call will significantly impact the sustainability of any immediate price movement and the future course of earnings forecasts. In light of this, estimating the probability of a positive earnings surprise is useful.
Jefferies Stock (JEF) Technical Analysis

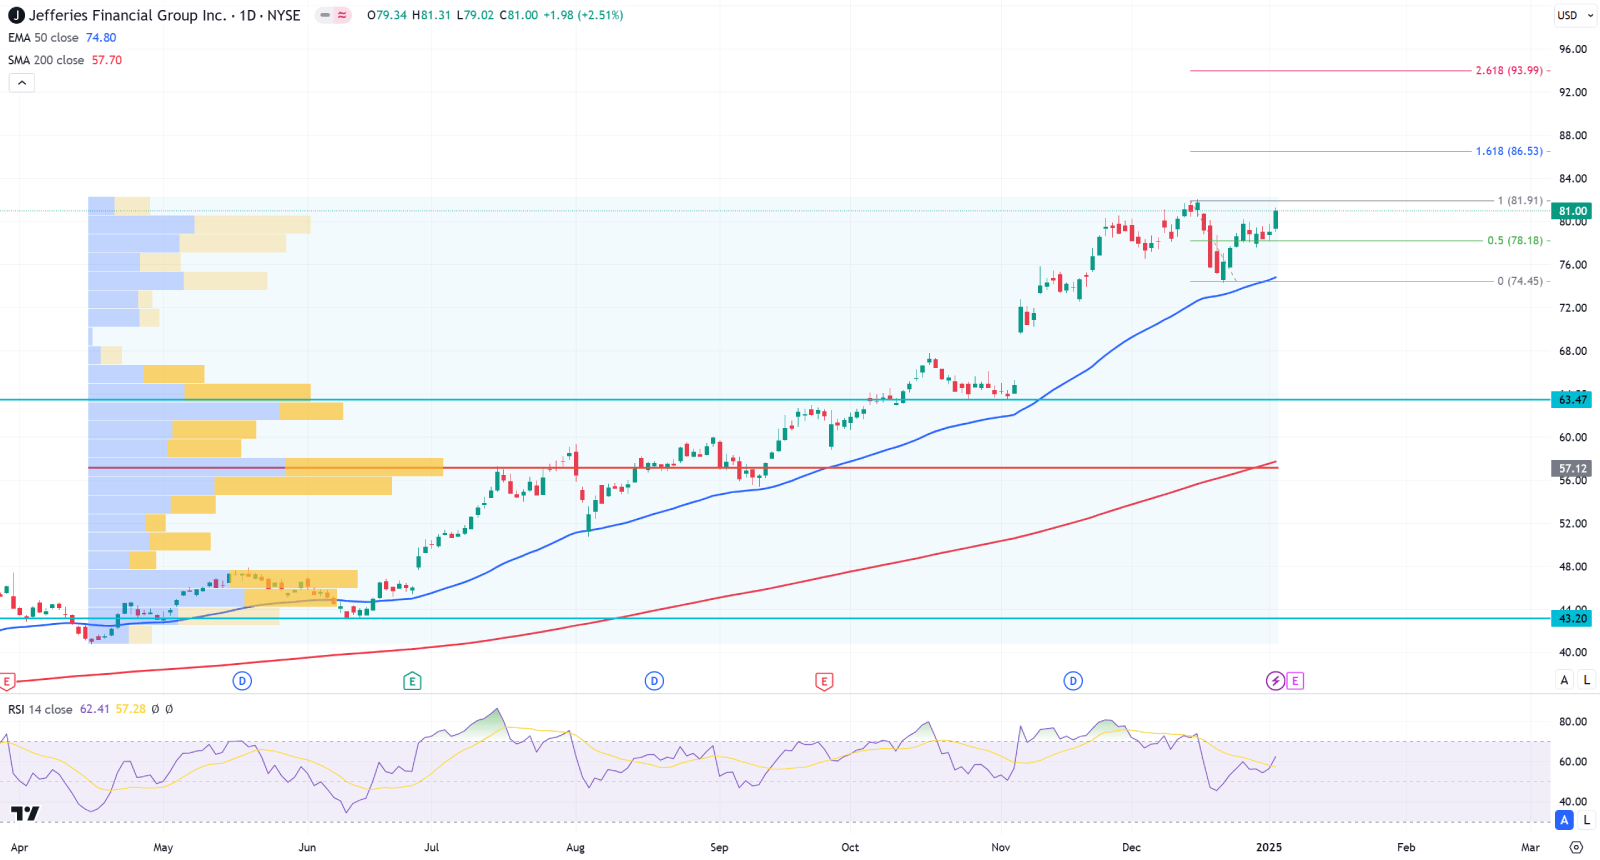
In the daily chart of JEF stock, the broader market momentum is bullish as the 50-day EMA line supports the current price.
In the volume structure, the buying pressure is visible as the highest activity level since April 2024 is at 57.12 level, which is below the current price. However, the gap between the current price and the high volume line has expanded, which signals a minor downside correction as a mean reversion.
Following the current context, the ideal trend trading strategy is to look for a continuation, aiming for the 93.99 Fibonacci Extension level. Moreover, a daily candle above the 81.91 resistance level could signal a bullish fakey formation, boosting the buying pressure.
On the bearish side, the immediate support is at the 50 day EMA line, which could be the primary target of a bearish pressure. A bearish break below this line might lower the price towards the 62.42 support level from where another bullish attempt might come.


