
EURUSD
Fundamental Perspective
The EURUSD pair approached the 1.1200 mark again last week but settled at 1.1160, holding moderate gains. The pair have struggled to surpass this level since mid-August, and they are awaiting the Federal Reserve's (Fed) policy announcement. The Fed introduced a 50-basis-point rate cut, leading to a brief drop in the USD. Chair Jerome Powell emphasized that future decisions will depend on economic data and be made on a meeting-by-meeting basis. Projections suggest an additional 50 bps cut this year, followed by 100 bps in 2025 and another 50 bps in 2026, targeting a terminal rate of 2.9%.
Although concerns about economic growth persist, the Fed's actions helped calm recession fears. Treasury yields eased, with the 2-year yield falling below the 10-year, signaling growing optimism for a potential recovery. Meanwhile, European data, mainly from Germany, continued to disappoint, with worsening economic sentiment and assessments of the current situation. In contrast, US Retail Sales rose by 0.1% in August, exceeding expectations. Investors now focus on upcoming economic data, particularly US inflation figures, as they speculate on the Fed's next move. Financial markets expect a 25 bps rate cut, though further disinflation could spark talks of a 50 bps reduction.
Technical Perspective
The last weekly candle finished solid green after a red hammer candle, reflecting that bulls are currently controlling the asset price, which leaves buyers optimistic for next week.
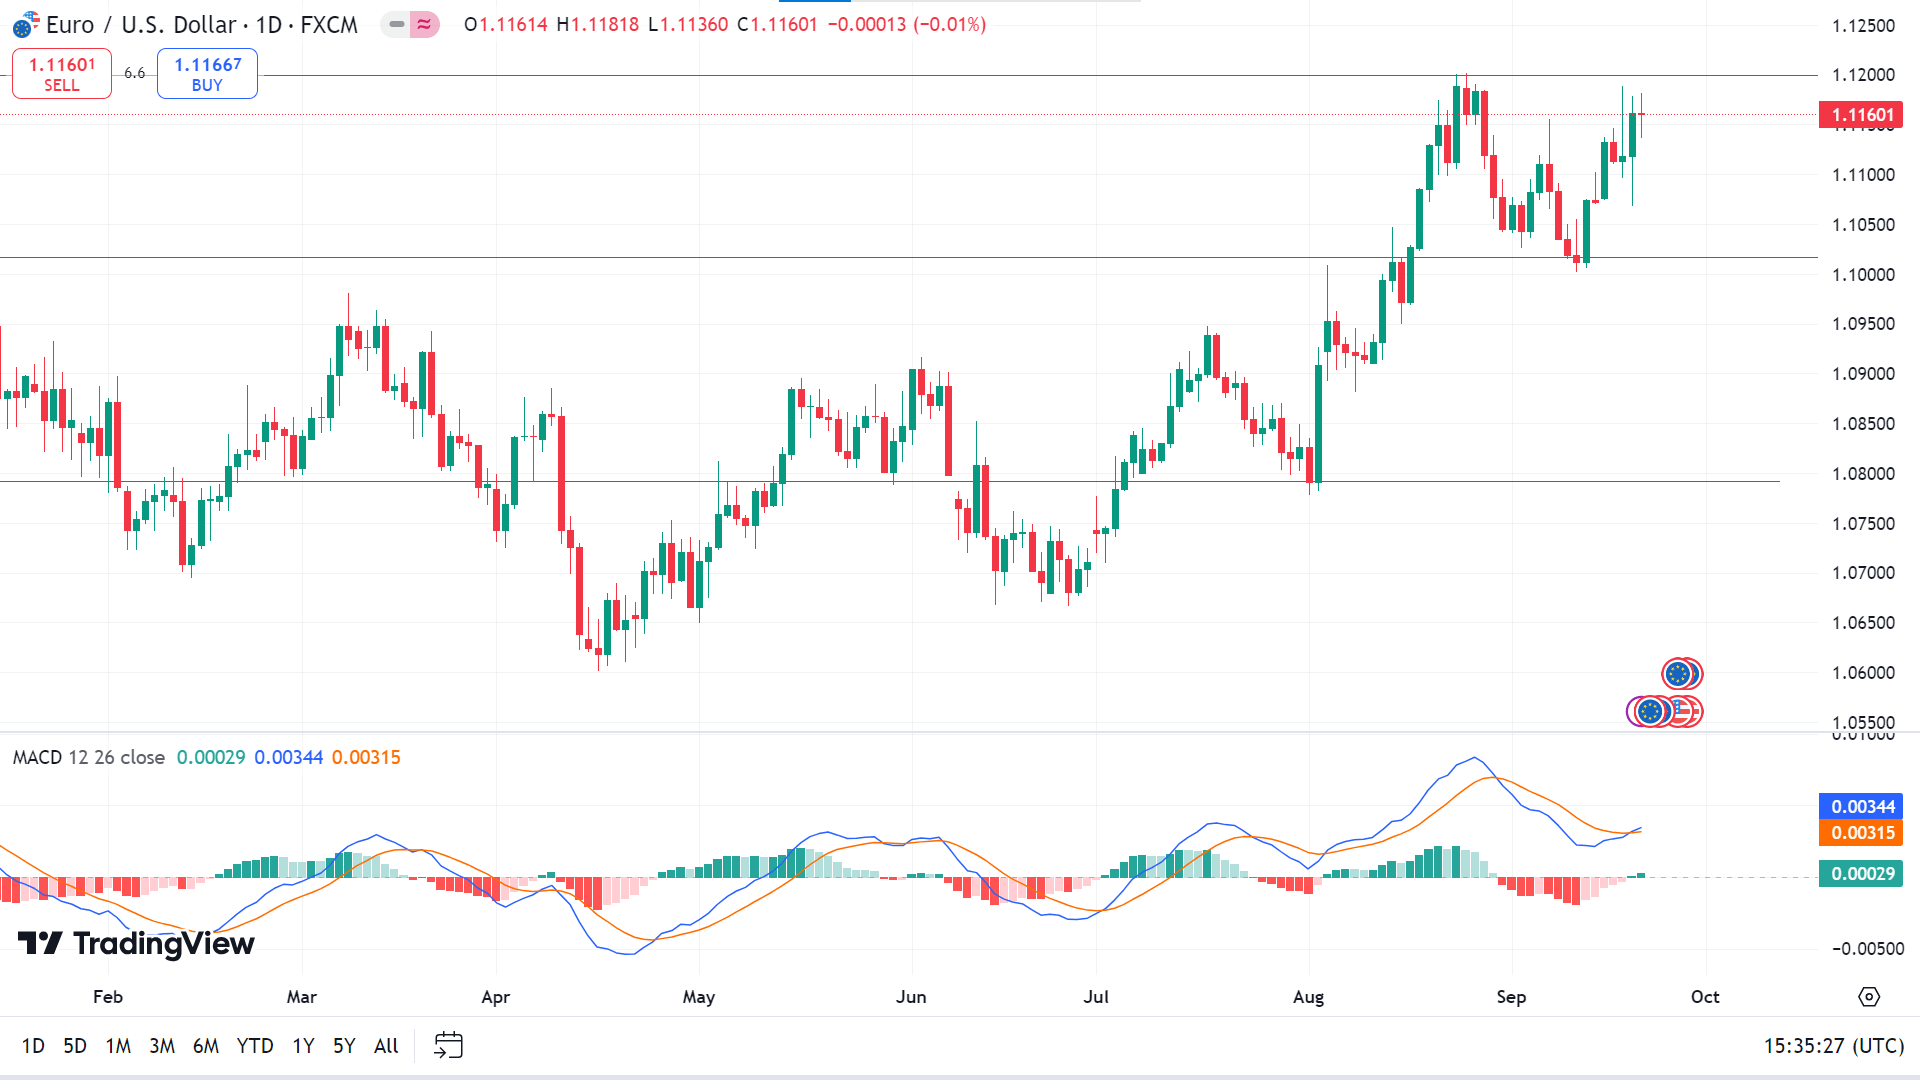
The bullish continuation is aiming higher, as the current price hovers above the 1.1000 crucial support level. Also, the MACD indicator window reveals that the price is currently in an uptrend on the daily chart. The dynamic signal line creates a fresh, bullish crossover, and green histogram bars appear. The price may head toward reaching the nearest resistance near 1.1270, followed by the next resistance near 1.1432.
Meanwhile, any pause in the current uptrend may guide the price to decline at the primary support level near 1.1015. If the MACD window indication turns bearish again, the EURUSD pair can drop to the next support level near 1.0855.
GBPJPY
Fundamental Perspective
On Thursday, the Bank of England (BoE) kept its policy rate unchanged at 5.0%, with Governor Andrew Bailey urging caution against cutting rates too quickly or sharply. This decision, alongside diverging central bank policies, pushed the GBP/USD pair to a 30-month high of 1.3315. Despite renewed concerns over China's economic slowdown, buyers remained in control heading into the weekend.
UK Retail Sales data from the Office of National Statistics (ONS) showed a 1.0% rise in August, following a 0.5% increase in July, surpassing the forecasted 0.4% growth.
Meanwhile, Japan's inflation climbed further, with the National Consumer Price Index (CPI) increasing 3.0% year-on-year in August, up from 2.8% in July, marking a ten-month high. The CPI excluding food and energy rose by 2.0%, while the CPI excluding fresh food reached 2.8%, aligning with forecasts. This sustained rise in inflation has fueled expectations that the Bank of Japan (BoJ) might eventually raise its historically low interest rates, potentially strengthening the Yen.
Although the BoJ left rates unchanged after its September meeting, Governor Kazuo Ueda was cautious, citing uncertainties in Japan's economic activity. The inflation data lent support to the Yen.
Technical Perspective
The last weekly candle closed solid green, erasing the previous two weeks' loss, which indicates bullish pressure for the next week.
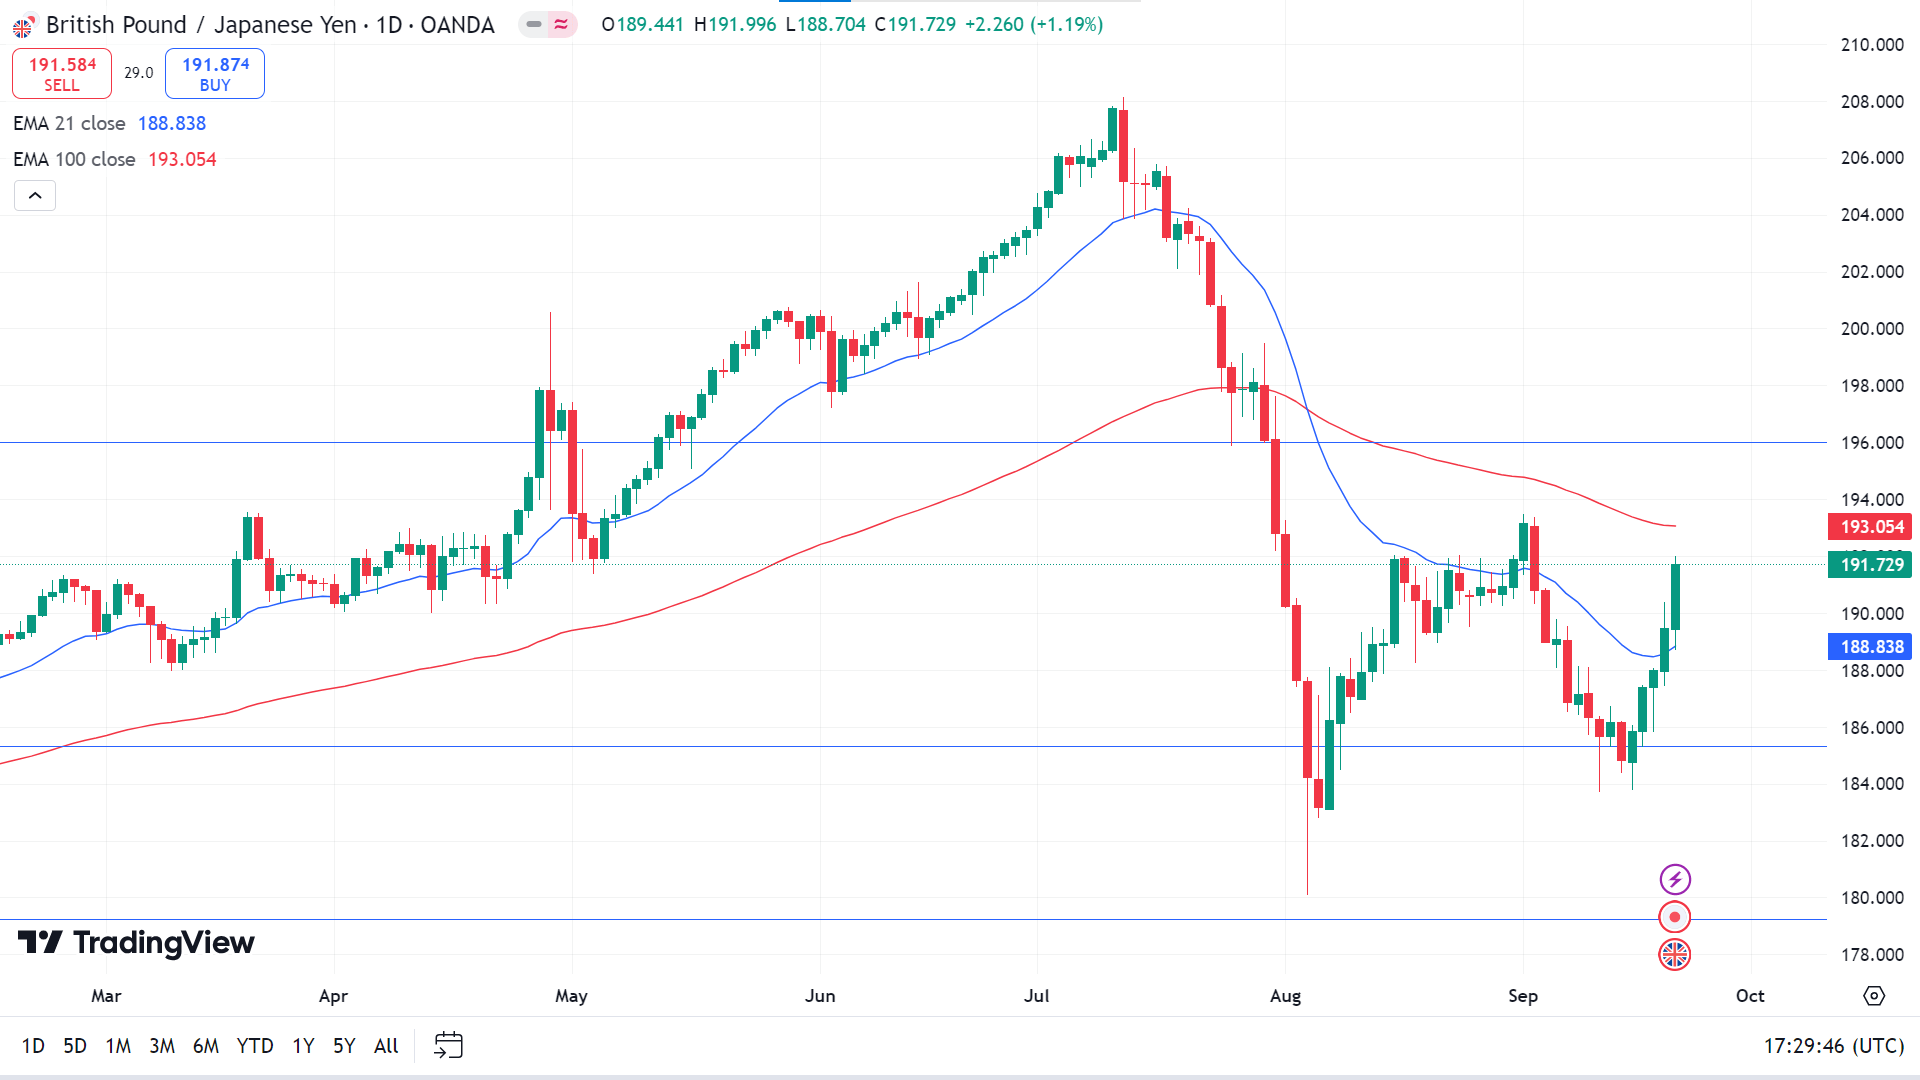
On the daily chart, the price is floating between the EMA 100 and EMA 21 lines, indicating a mixed signal, whereas the EMA 100 line acts as a dynamic resistance and the EMA 21 line acts as a dynamic support. If the price exceeds the EMA 100 line, it may hit the resistance of 196.00, followed by the next resistance near 200.56.
Meanwhile, if the bears take control and the price declines below the EMA 21 line, it may reach the primary support of 185.33, followed by the next support near 181.90.
NASDAQ 100 (NAS100)
Fundamental Perspective
The Federal Reserve's Open Market Committee reduced its benchmark rate by 50 basis points on Wednesday, setting it within a range of 4.75% to 5%. While Fed Governor Michelle Bowman favored a more modest 25-basis-point reduction, Governor Christopher Waller supported the more significant cut, noting that inflation was cooling faster than he had anticipated, according to CNBC.
In the bond market, the two-year US Treasury yield dipped by one basis point to 3.6%, while the 10-year yield remained unchanged at 3.74%.
In corporate news, Constellation Energy (CEG) entered into a 20-year agreement with Microsoft (MSFT) to supply carbon-free power to its data centers, which will involve restarting the Three Mile Island nuclear plant. Constellation's stock soared 22%, leading gains on the S&P 500 and Nasdaq, while Microsoft's shares dropped 0.8%.
Nike (NKE) gained 6.8%, topping the Dow and ranking among the best performers on the S&P 500. The athletic company announced that CEO John Donahoe will retire next month, and longtime executive Elliott Hill will return to take over leadership.
According to The Wall Street Journal, Qualcomm (QCOM) made a takeover offer for Intel (INTC). Intel shares rose 3.3%, while Qualcomm dropped 2.9%, making both stocks notable movers on the Dow and Nasdaq.
Technical Perspective
The last weekly candle closed solid green, posting two consecutive gaining weeks, confirming bullish pressure on the asset price.
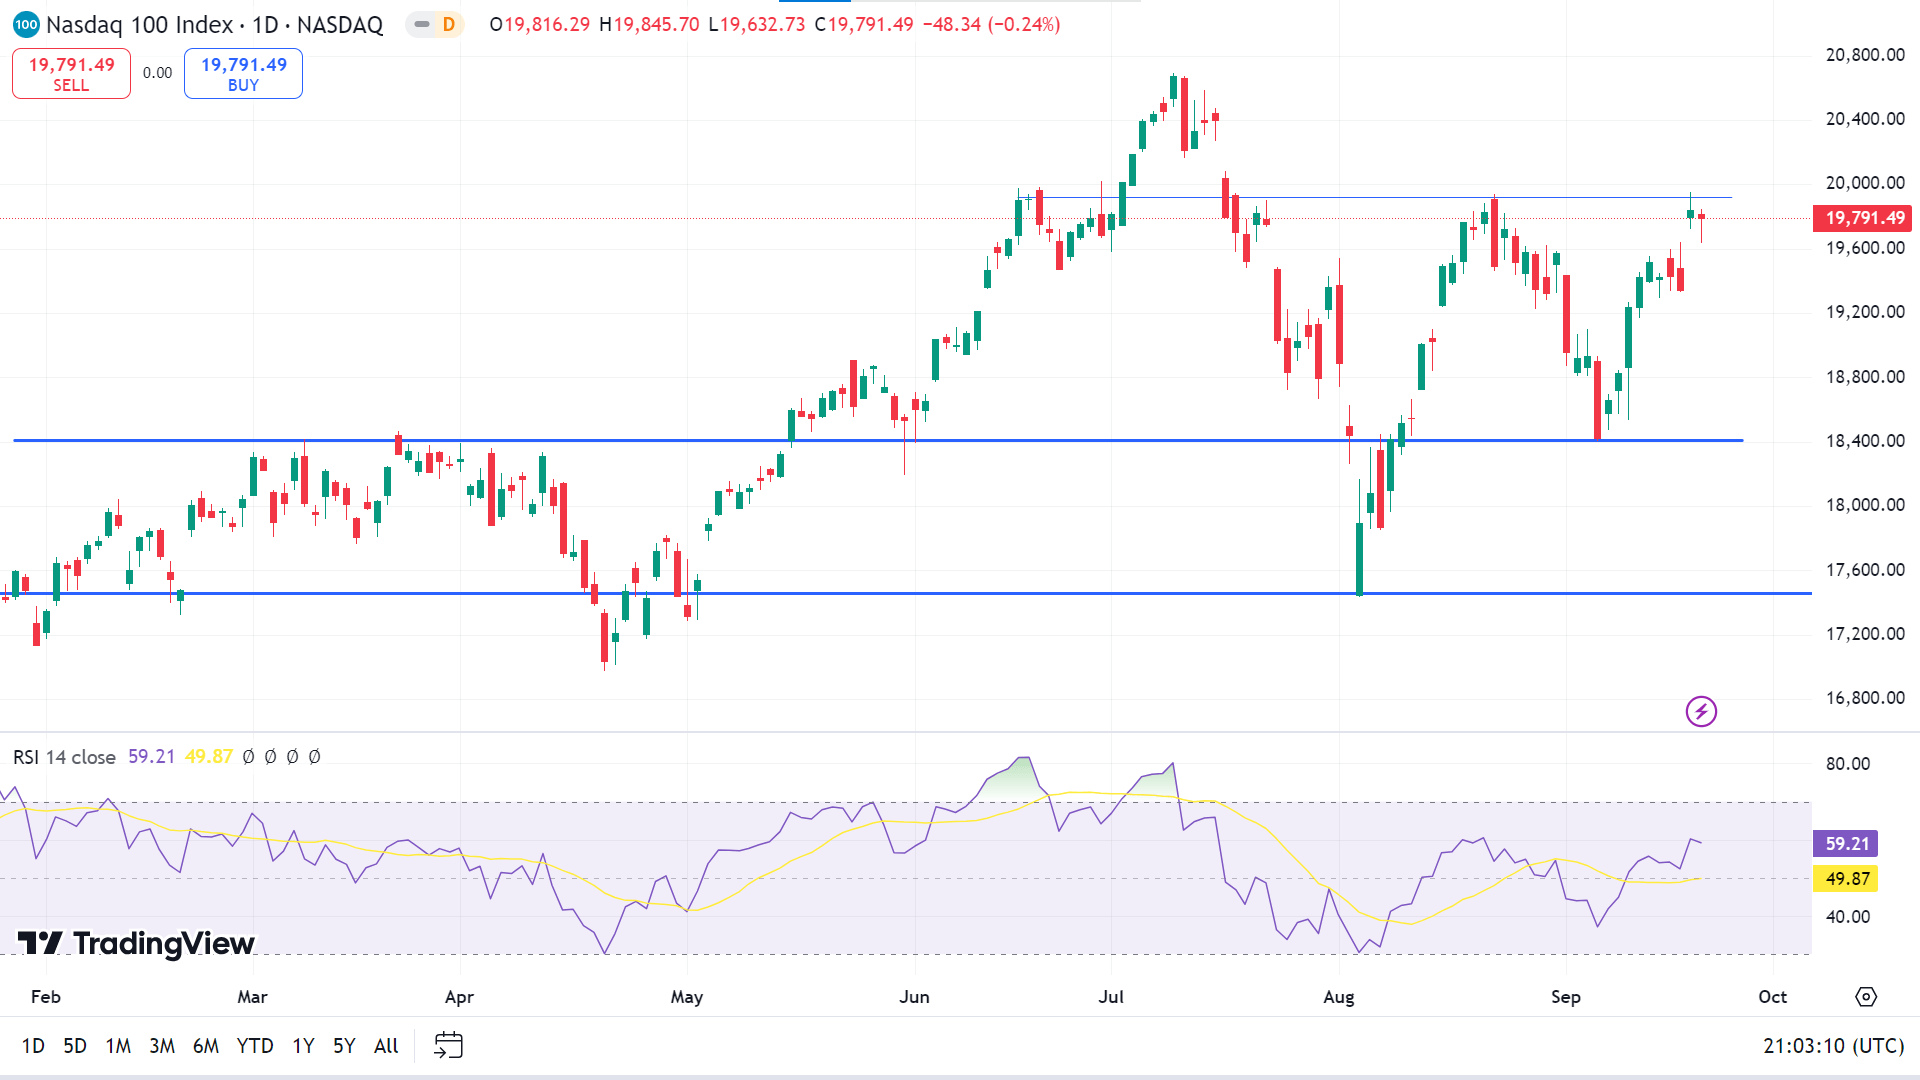
On the daily chart, the price is floating on an uptrend when observing the RSI reading, which remains neutral, and the dynamic signal line is above the midline. If the dynamic signal line continues to move toward the upper line on the RSI indicator window, the price can hit the primary resistance of 19,939.31, followed by the next resistance near 20,530.56.
However, if the RSI dynamic line starts sloping downward from the current level, the price can decline toward the nearest support of 18,026.63, followed by the next support near 17,435.81.
S&P 500 (SPX500)
Fundamental Perspective
On Thursday, all three major U.S. indexes saw their best gains in over a month, with the S&P 500 and Dow closing at record highs. The S&P 500 is on track to defy the usual September trend, which historically tends to be a weaker month for U.S. stocks.
Earlier this week, the Federal Reserve initiated its monetary easing with a 50-basis-point rate cut, projecting steady economic growth alongside low unemployment and inflation. However, Michael Matousek, head trader at U.S. Global Investors, pointed out that the more significant cut has led some investors to consider "unknown risks beneath the surface" and prepare accordingly.
The CME Group's FedWatch tool now shows a 53.7% chance of a 25-basis-point cut in November, down from 60.4% earlier in the day. Fed Governor Christopher Waller lifted the media blackout on policymakers, emphasizing that anticipated weak inflation data supported the central bank's decision to implement a more significant cut.
Additionally, market volatility is expected due to the "triple switching" event, where options and futures contracts linked to indexes and individual stocks expire simultaneously, which can result in sharp swings in trading activity.
Technical Perspective
The last weekly candle closed solid green, posting two consecutive gaining weeks, reaching ATH, indicating an upward continuation.
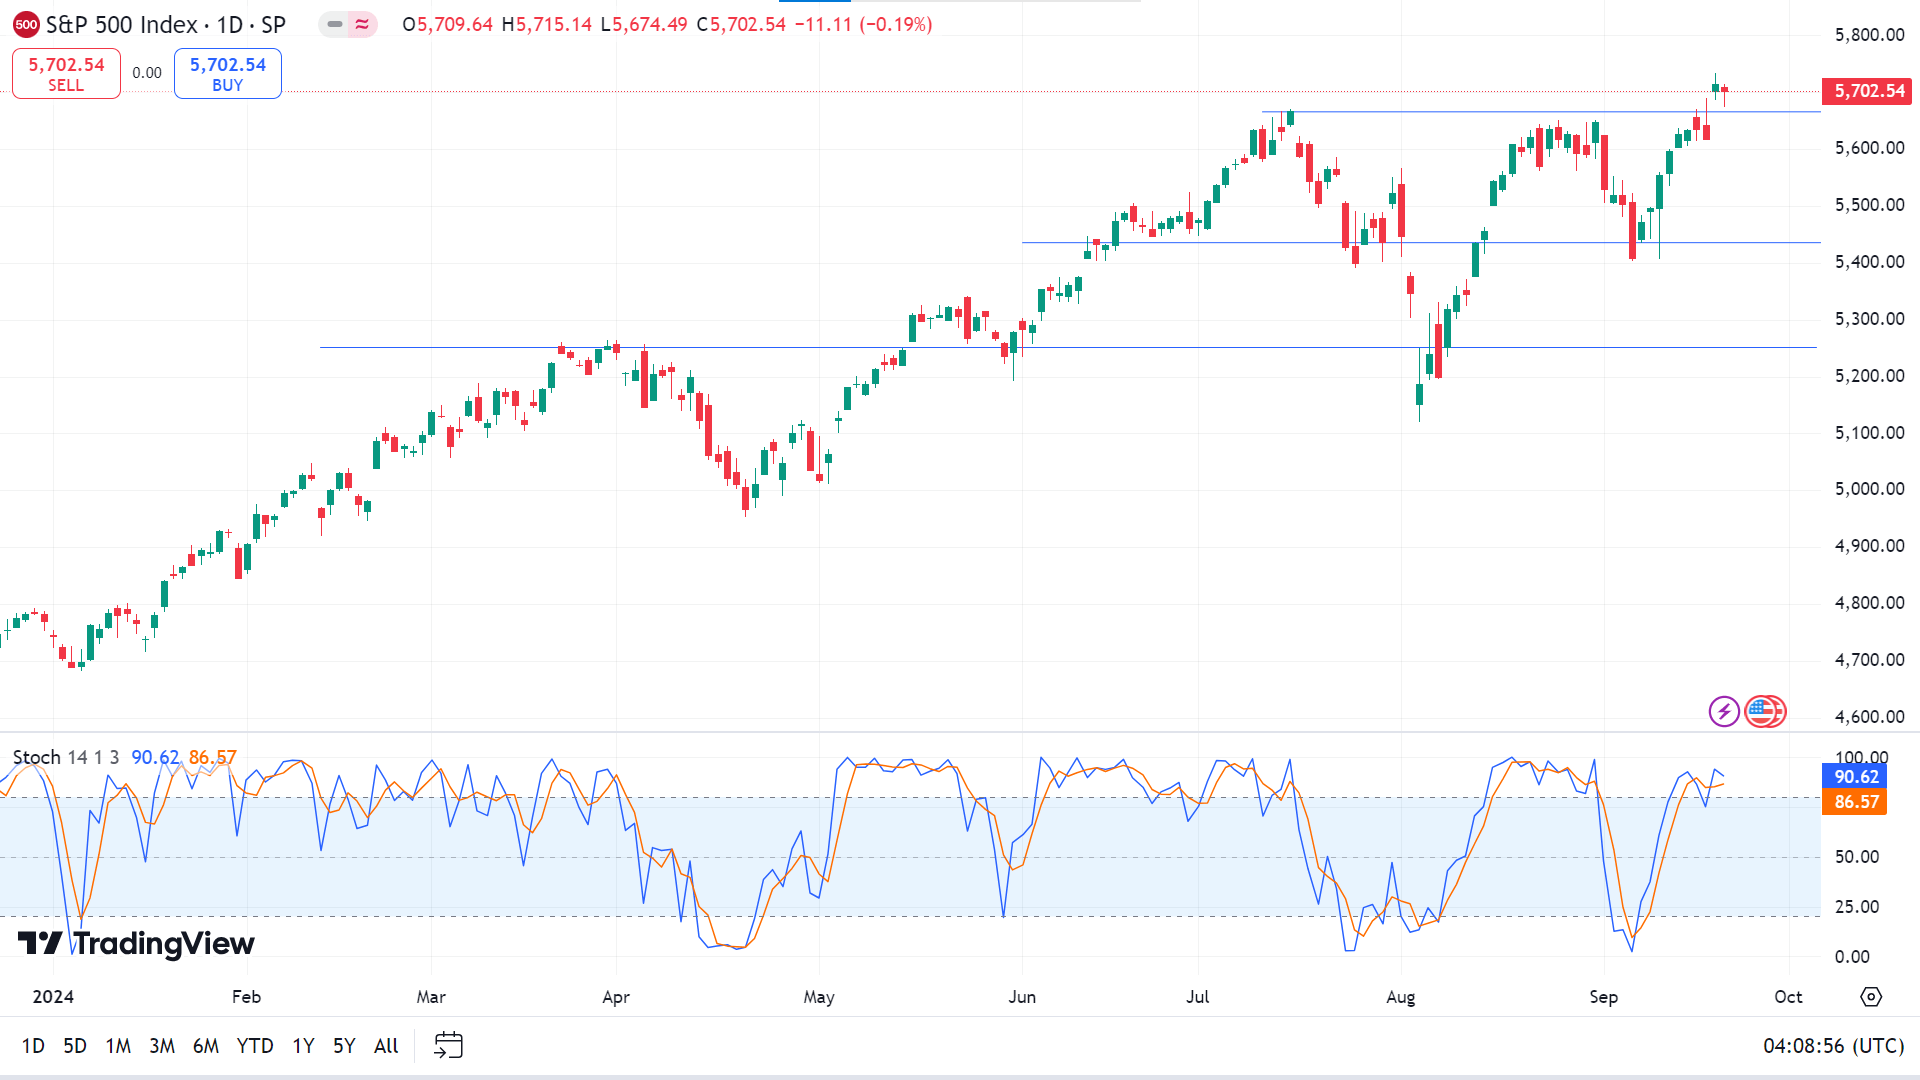
On the daily chart, the price is on a solid uptrend, as the Stochastic indicator window confirms through the dynamic signal line above the indicator window's upper line. According to the technical indicator readings, the price may hit the resistance of 5,802.09, creating a new ATH, followed by the next resistance near 6,005.45.
Meanwhile, if the price gives a break in the current uptrend and the Stochastic signal line heads downward, the S&P 500 index might reach the primary support of 5,435.37, followed by the next support near 5,269.73.
Gold (XAUUSD)
Fundamental Perspective
Gold (XAU/USD) reached a new record high of $2,610 on Friday, driven by expectations that global central banks will follow the Federal Reserve in cutting interest rates. Lower rates enhance Gold's appeal by reducing the opportunity cost of holding the non-yielding asset, making it more attractive to investors.
Following the Fed's 50-basis-point cut on Wednesday, the South African Reserve Bank (SARB) reduced its key rate by 25 bps on Thursday, its first cut since 2020. Meanwhile, the Central Bank of the Philippines slashed its rate by 250 bps, and the Reserve Bank of India is widely expected to follow suit. Although the People's Bank of China left its rates unchanged at its September meeting, its loan prime rates remain at record lows after a surprise cut in July. The Bank of Japan also kept rates steady despite speculation about a possible hike.
Gold's rally above $2,600 was tempered by the Fed's positive outlook for U.S. economic growth, projected to remain stable at 2% annually through 2027. However, geopolitical tensions, particularly rising conflict risks in the Middle East between Israel and Hezbollah, continue to provide some safe-haven demand for the metal despite its subsequent retreat from the peak.
Technical Perspective
The last weekly candle closed solid green, posting two consecutive gaining weeks, signaling a bullish continuation.
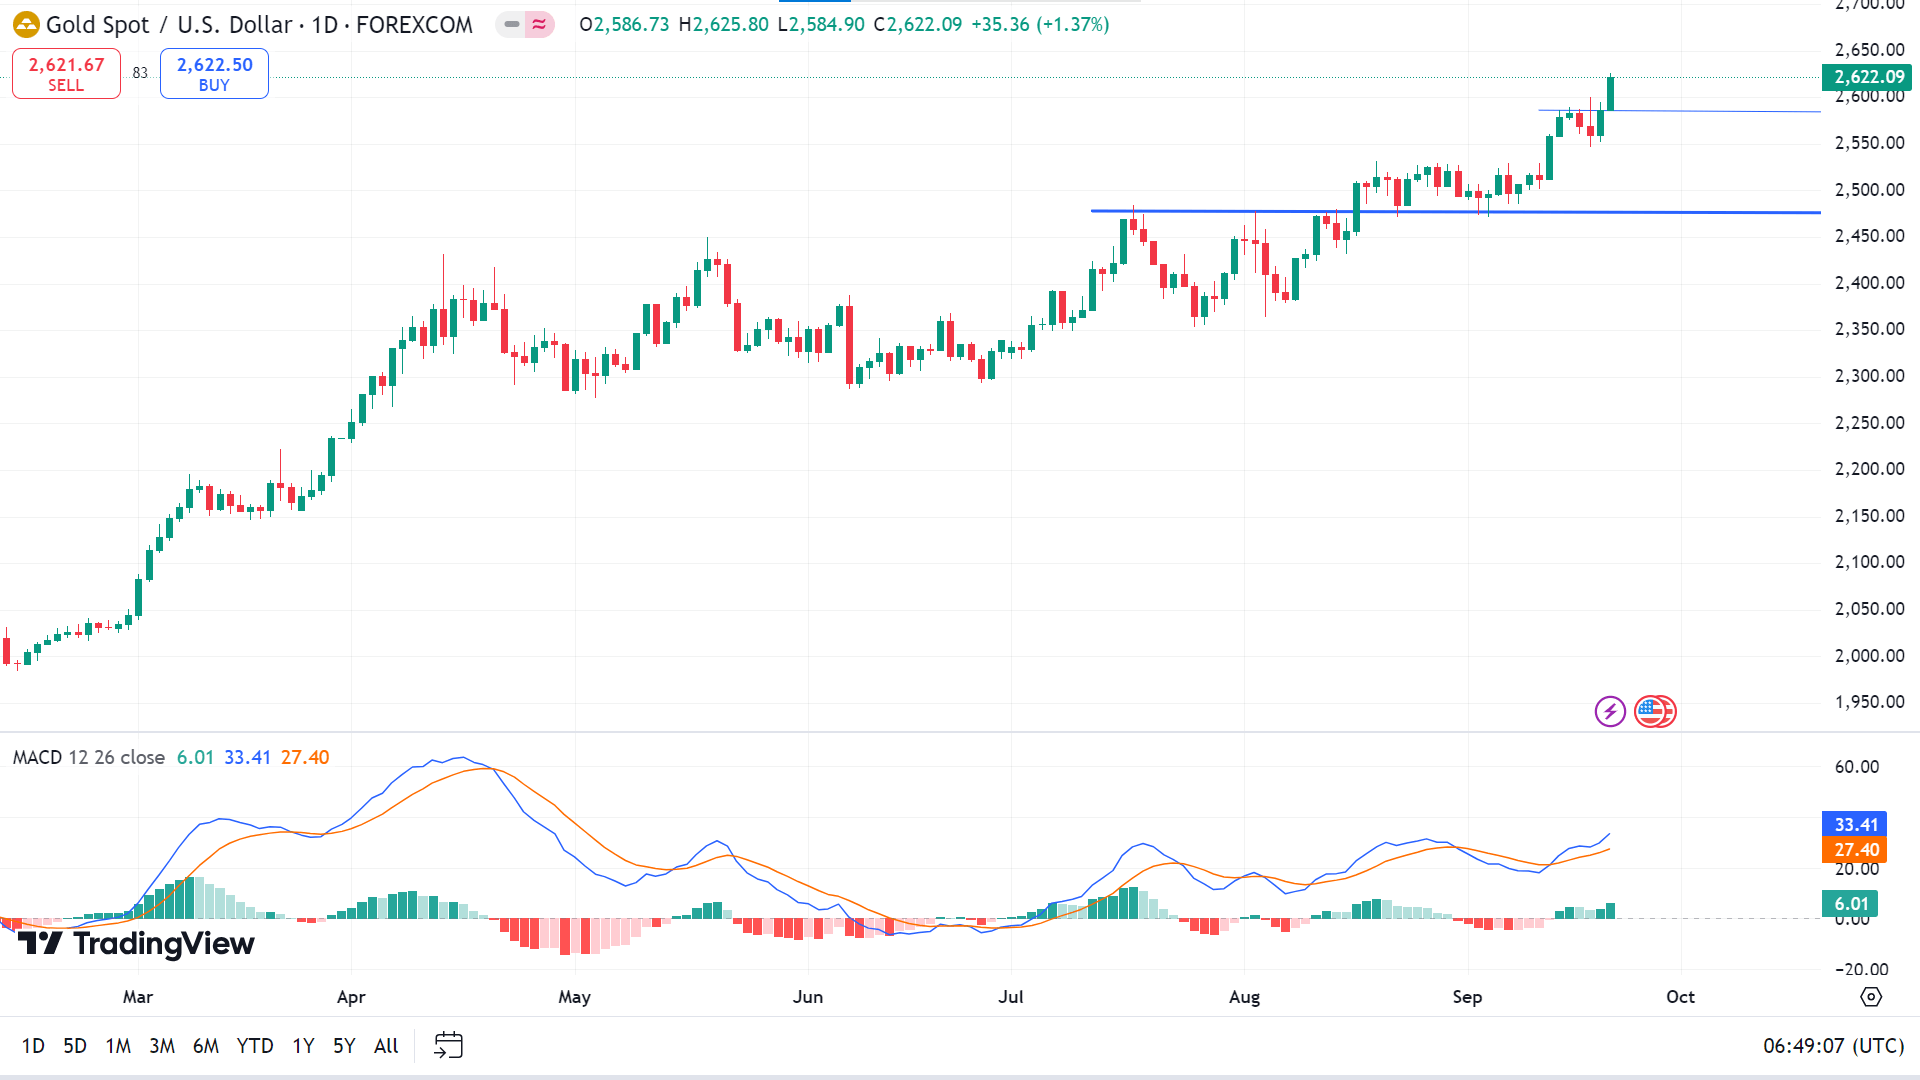
The price is on a straight uptrend, as the MACD indicator window shows through dynamic signal lines and green histogram bars above the midline. So, the XAUUSD can hit the nearest resistance of 2,630.85, followed by the next resistance near 2700.00.
Meanwhile, on the downside, any pause in the current uptrend can lead the price to reach the primary support near 2586.01, followed by the next support near 2,512.50.
Bitcoin (BTCUSD)
Fundamental Perspective
Bitcoin (BTC) climbed 7% this week, surpassing $63,000, bolstered by the U.S. Federal Reserve's 50-basis-point rate cut and over $300 million in ETF inflows. The Fed's rate reduction, announced on Wednesday, is seen as a positive catalyst for risk assets like cryptocurrencies, as lower borrowing costs often lead investors to shift their capital into assets like Bitcoin.
In the past, Bitcoin has shown a tendency to rally following rate cuts. During the 2020 COVID-19 crisis, when the Fed slashed rates to near zero, Bitcoin surged from around $5,000 to $60,000. In contrast, the 2022 rate hikes, which brought interest rates to 4.25%-4.50%, caused Bitcoin's price to plummet from $46,000 to $16,000.
The recent 50-basis-point cut, bringing rates to 4.75%-5.00%, could spur further gains for Bitcoin, although the impact may be less dramatic than during the pandemic. Economist Peter Schiff, however, cautioned that this rate cut may intensify inflation and trigger a recession, potentially prompting investors to seek safer assets like gold. Schiff noted that the cut has already driven gold to a record high while weakening the U.S. dollar, which could shift some attention away from Bitcoin.
Technical Perspective
The last candle finished solid green on the weekly chart, posting two consecutive gaining weeks, leaving room for buyers for the next week.
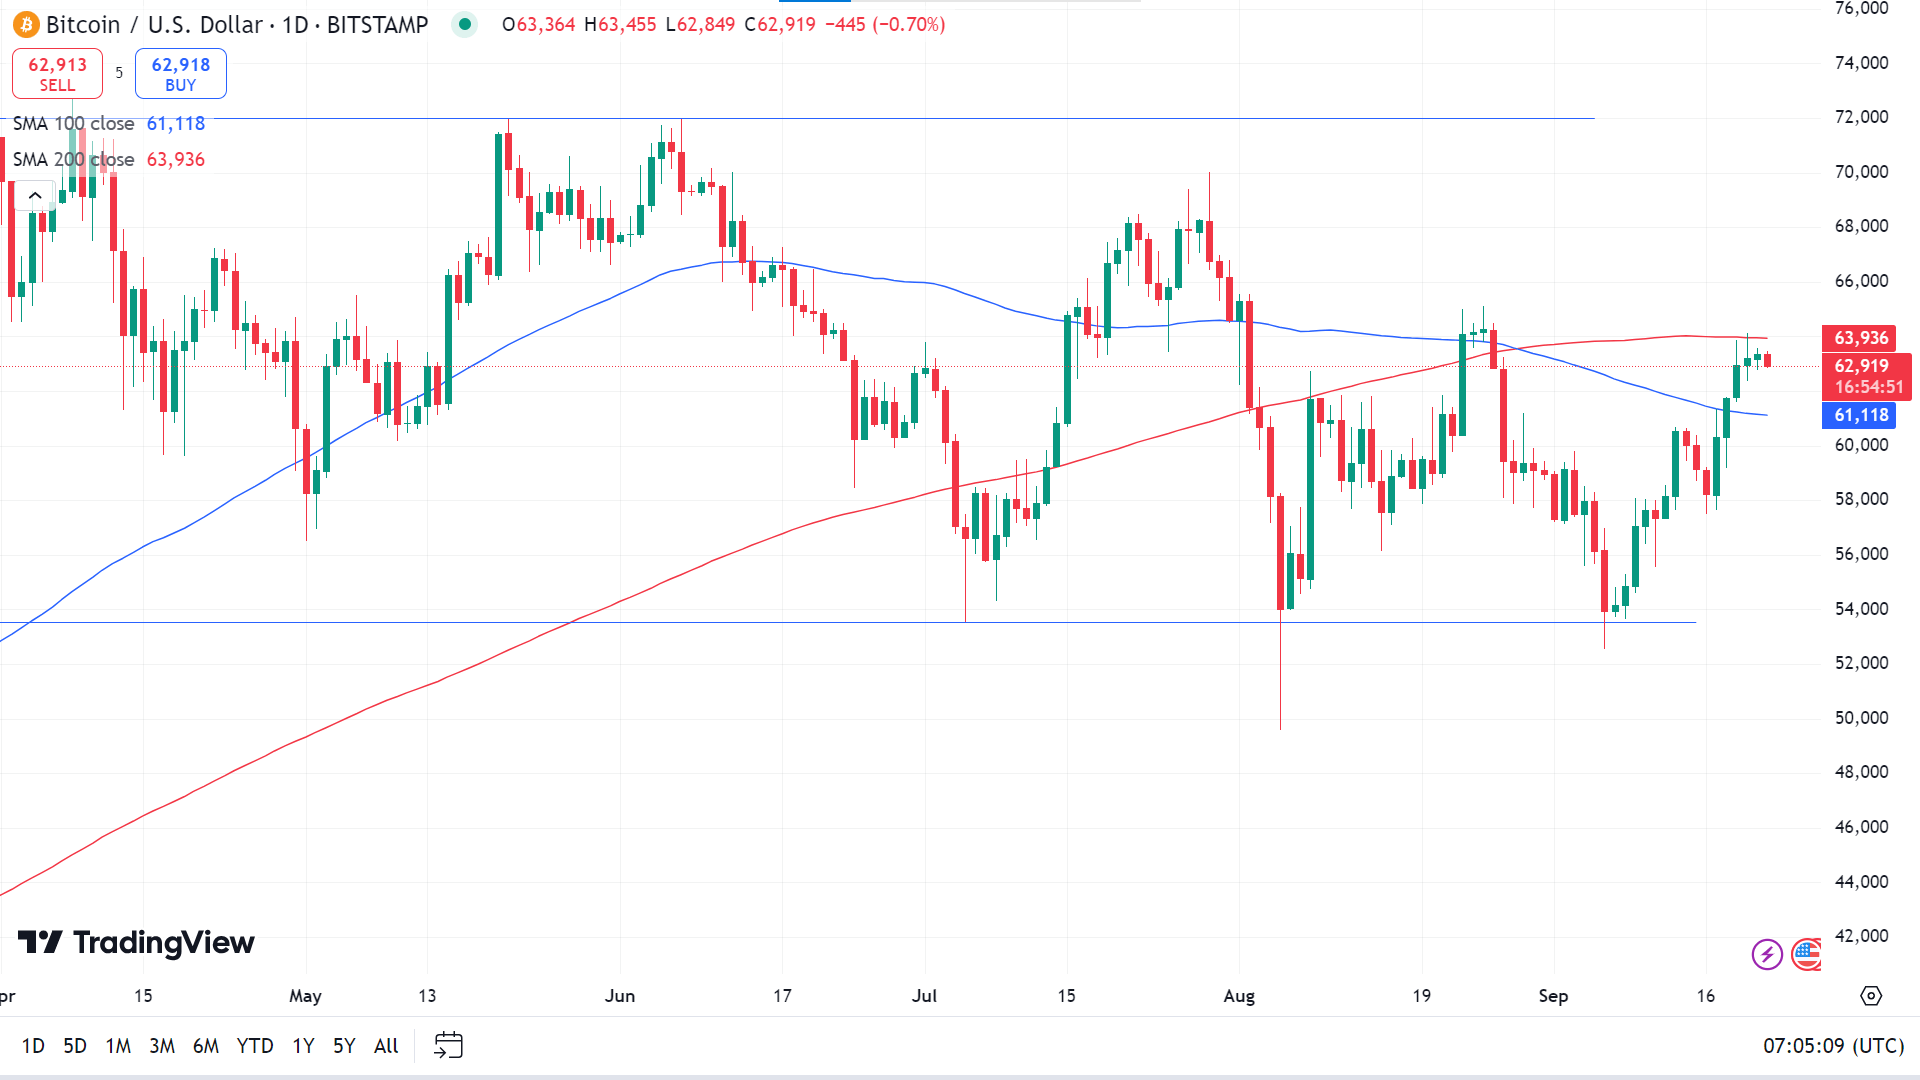
On the daily chart, the price is in a straight uptrend but leaves mixed signals as it floats between the SMA 100 and SMA 200 lines. If BTCUSD exceeds the SMA 200 line, it can hit the resistance of 65,057, followed by the next resistance near 68.161.
Meanwhile, if the price is below the SMA 100 line, it can decline toward the support of 59,929, followed by the next support near 55,813.
Ethereum (ETHUSD)
Fundamental Perspective
Ethereum (ETH) has climbed 5% in the last 24 hours and nearly 10% over the past week, as reported by CoinMarketCap. Breaking past the $2,400 resistance, which now serves as support, has boosted market confidence.
However, on September 20, data from IntoTheBlock highlights a potential shift in sentiment. As ETH rose above $2,400, over 150,000 ETH were moved to major exchanges like Binance and Coinbase within 24 hours. This enormous transfer raises concerns, as coins sent to exchanges often indicate that holders are preparing to sell. On platforms like Binance or Kraken, ETH can be easily swapped for other cryptocurrencies, stablecoins like USDT, or fiat currencies, enabling quick liquidation.
Although it needs to be clarified whether the transferred ETH has already been sold, this significant movement is raising concerns. The transfer is notable, as it's the largest in over nine months. While Ethereum's recent gains have been promising, this influx of coins to exchanges introduces some uncertainty, potentially affecting market sentiment in the short term.
Technical Perspective
On the weekly chart, the last candle ended solid green, reflecting bullish pressure on the asset price, indicating a possibility that the next candle might be another green one.
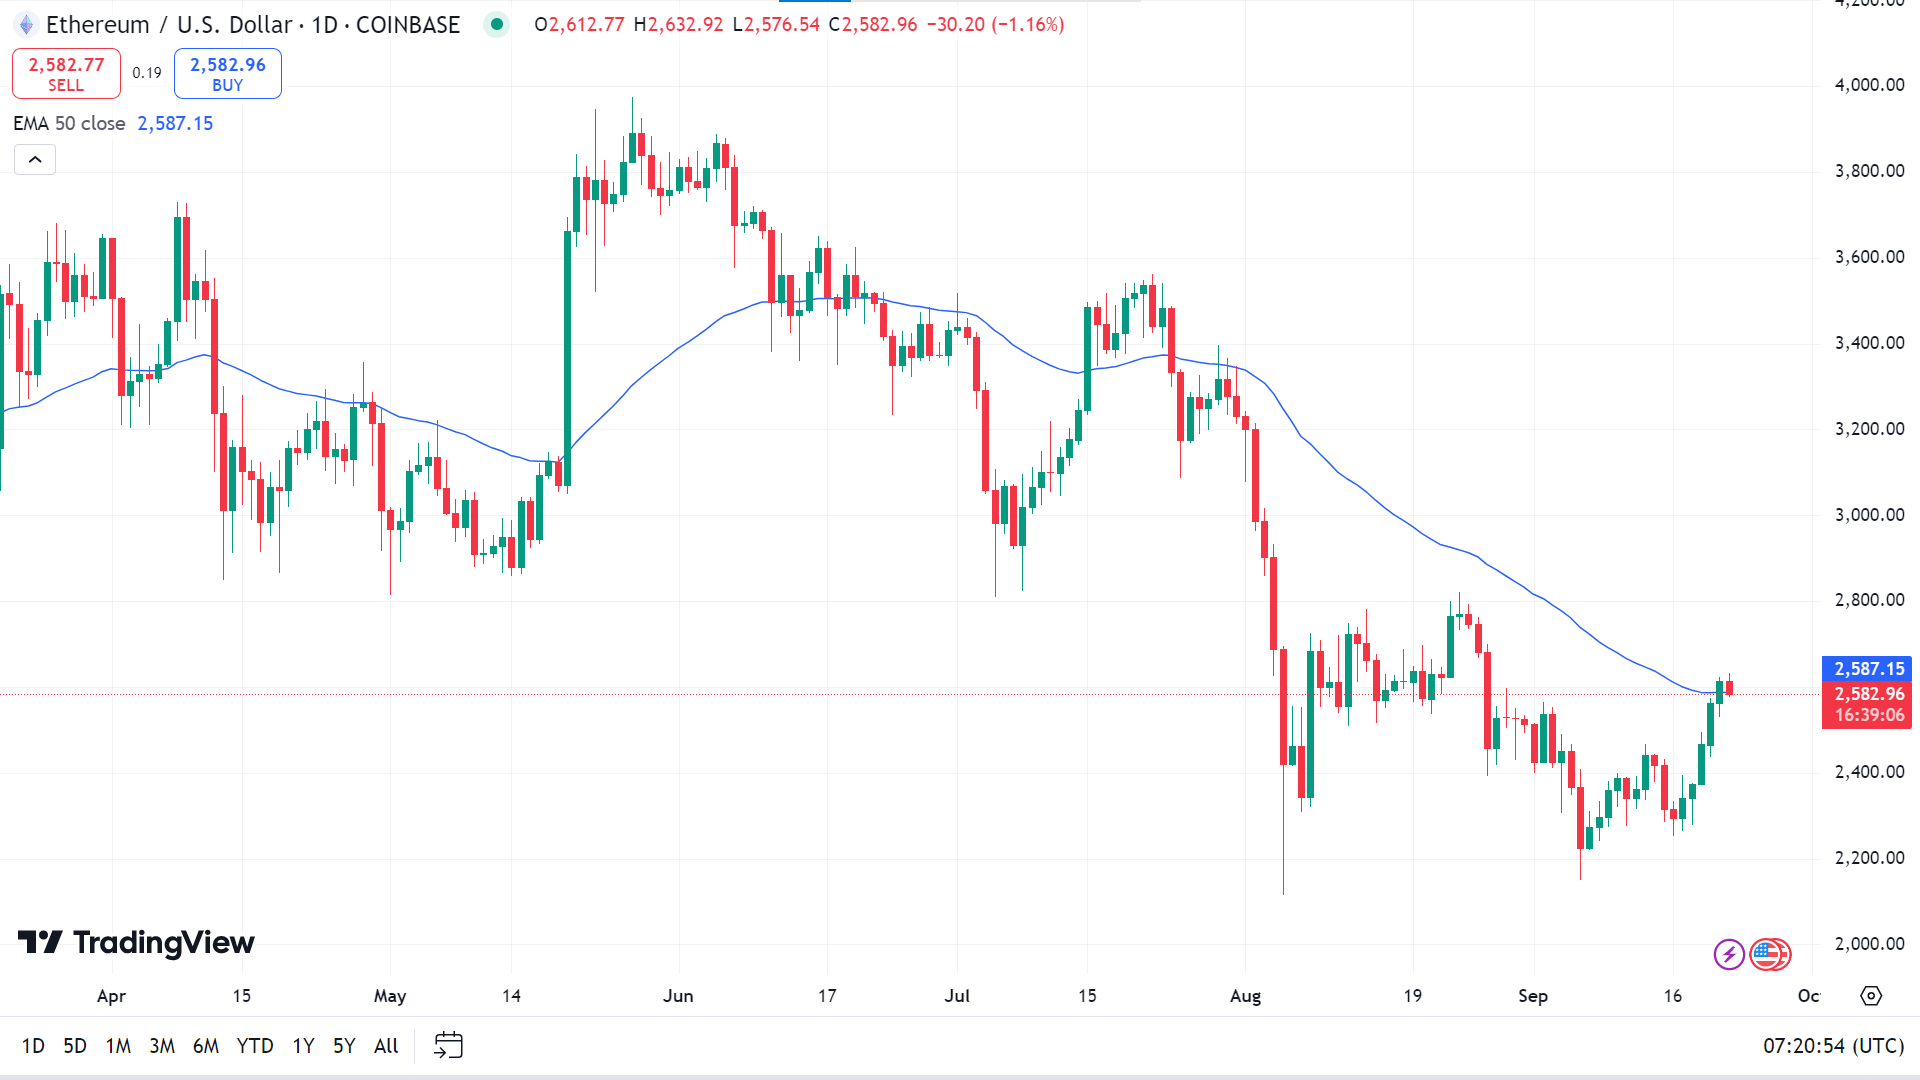
The price is reflected closely in the EMA 50 line on the daily chart. If the ETHUSD exceeds the EMA 50 line, it can hit the primary resistance of 2,817.56, followed by the next resistance of 3,053.77.
If the price declines below the EMA 50 line, it can hit the primary support of 2,454.93, and a breakout may trigger the price toward the next support near 2,287.56.
Nvidia Stock (NVDA)
Fundamental Perspective
Nvidia (NASDAQ: NVDA) saw its stock rise 150% in early 2024 but has faced a downturn since mid-July due to concerns over potential delays in its AI chips, which are vital for its data center revenue. Some analysts questioned the sustainability of customer spending on AI infrastructure. However, recent developments suggest these fears may be easing.
Nvidia's flagship H100 GPU set a benchmark for AI processing, excelling at handling large data sets for training and inference. The company recently launched the H200 GPU, which offers nearly double the performance at half the energy cost. In addition, Nvidia introduced the Blackwell architecture, with the GB200 NVL72 chip delivering a 30x improvement over the H100. This new generation of chips is expected to drive billions in revenue by Q4 of fiscal 2025, dispelling earlier concerns about delays.
Top clients like Microsoft, Amazon, and Tesla are vying for more GPUs, and Nvidia needs to catch up with demand. Despite record data center revenue of $26.3 billion last quarter, supply constraints remain an issue. The overwhelming demand and ongoing supply shortages suggest Nvidia's growth potential remains strong, with the company poised for further success.
Technical Perspective
The last weekly candle closed as a doji with a small red body after a solid green candle, reflecting a pause in the current uptrend and leaving room for buyers.
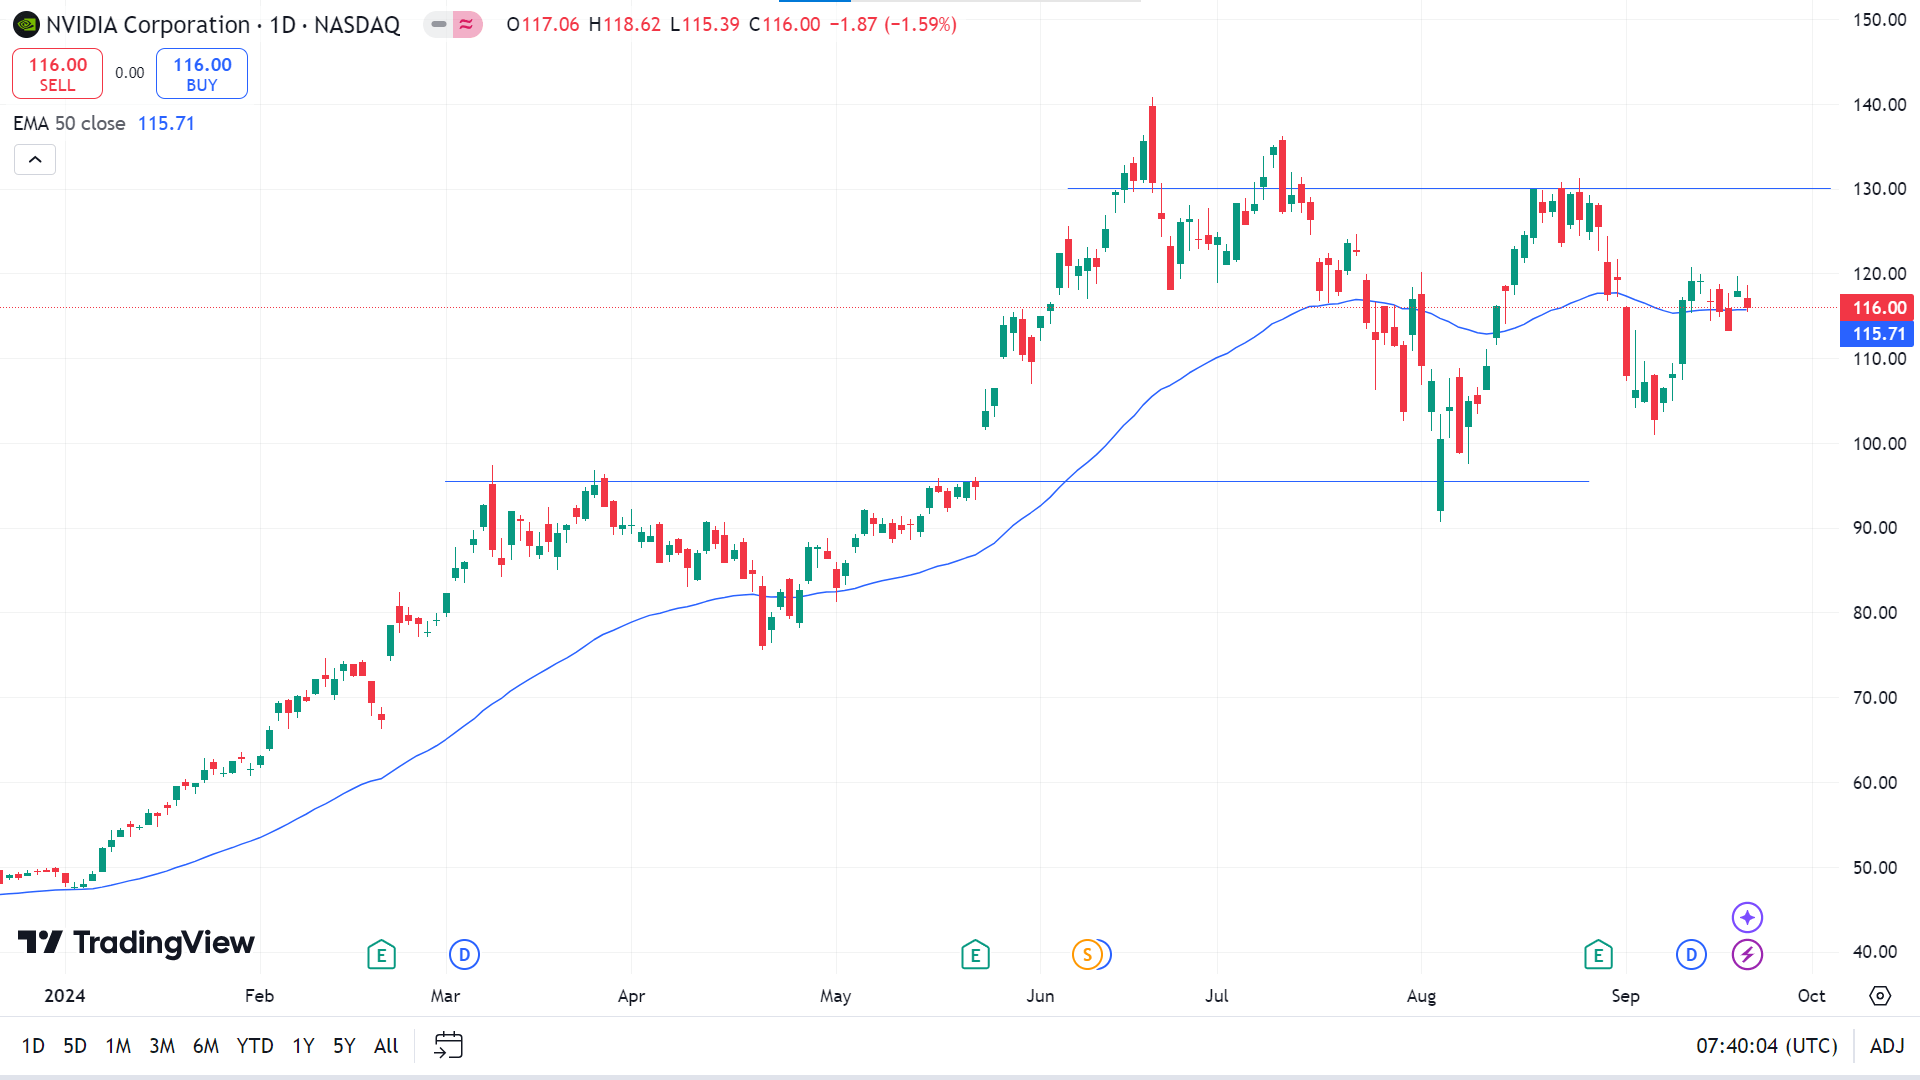
The price is moving closer to the EMA 50 line on the daily chart. If the price floats above the EMA 50 line, it can hit the primary resistance of 123.63, followed by the next resistance near 130.06.
In contrast, if the price declines and remains below the EMA 50 line, it can reach the primary support of 109.33, followed by the next support near 101.63.
Tesla Stock (TSLA)
Fundamental Perspective
Tesla's upcoming robotaxi unveiling on October 10 has sparked significant interest, with Elon Musk describing it as the company's most pivotal event since the introduction of the Model 3. Investors eagerly await the reveal, anticipating advancements in Tesla's full self-driving (FSD) technology, likely showcasing version 12.5 or higher.
Initially planned for August 8, the event was postponed to allow for crucial adjustments. It is set to occur in Los Angeles, but the precise location still needs to be confirmed, though some reports point to the Warner Bros. studio in Burbank. Tesla plans to stream the event live across social media platforms, allowing broader public access.
The robotaxi concept may debut on a limited scale in select urban areas, similar to how Waymo operates. Tesla currently holds permits for autonomous testing with a driver but lacks approval for driverless deployment, which is a critical hurdle in scaling its robotaxi vision.
Meanwhile, competitors like Waymo, which has partnered with Uber for autonomous rides in cities like Austin and Atlanta, are already making strides in the space. Tesla's reveal could offer a clearer picture of how it plans to navigate these regulatory and competitive challenges.
Technical Perspective
The last candle closed solid green on the weekly chart, posting two consecutive gaining weeks.
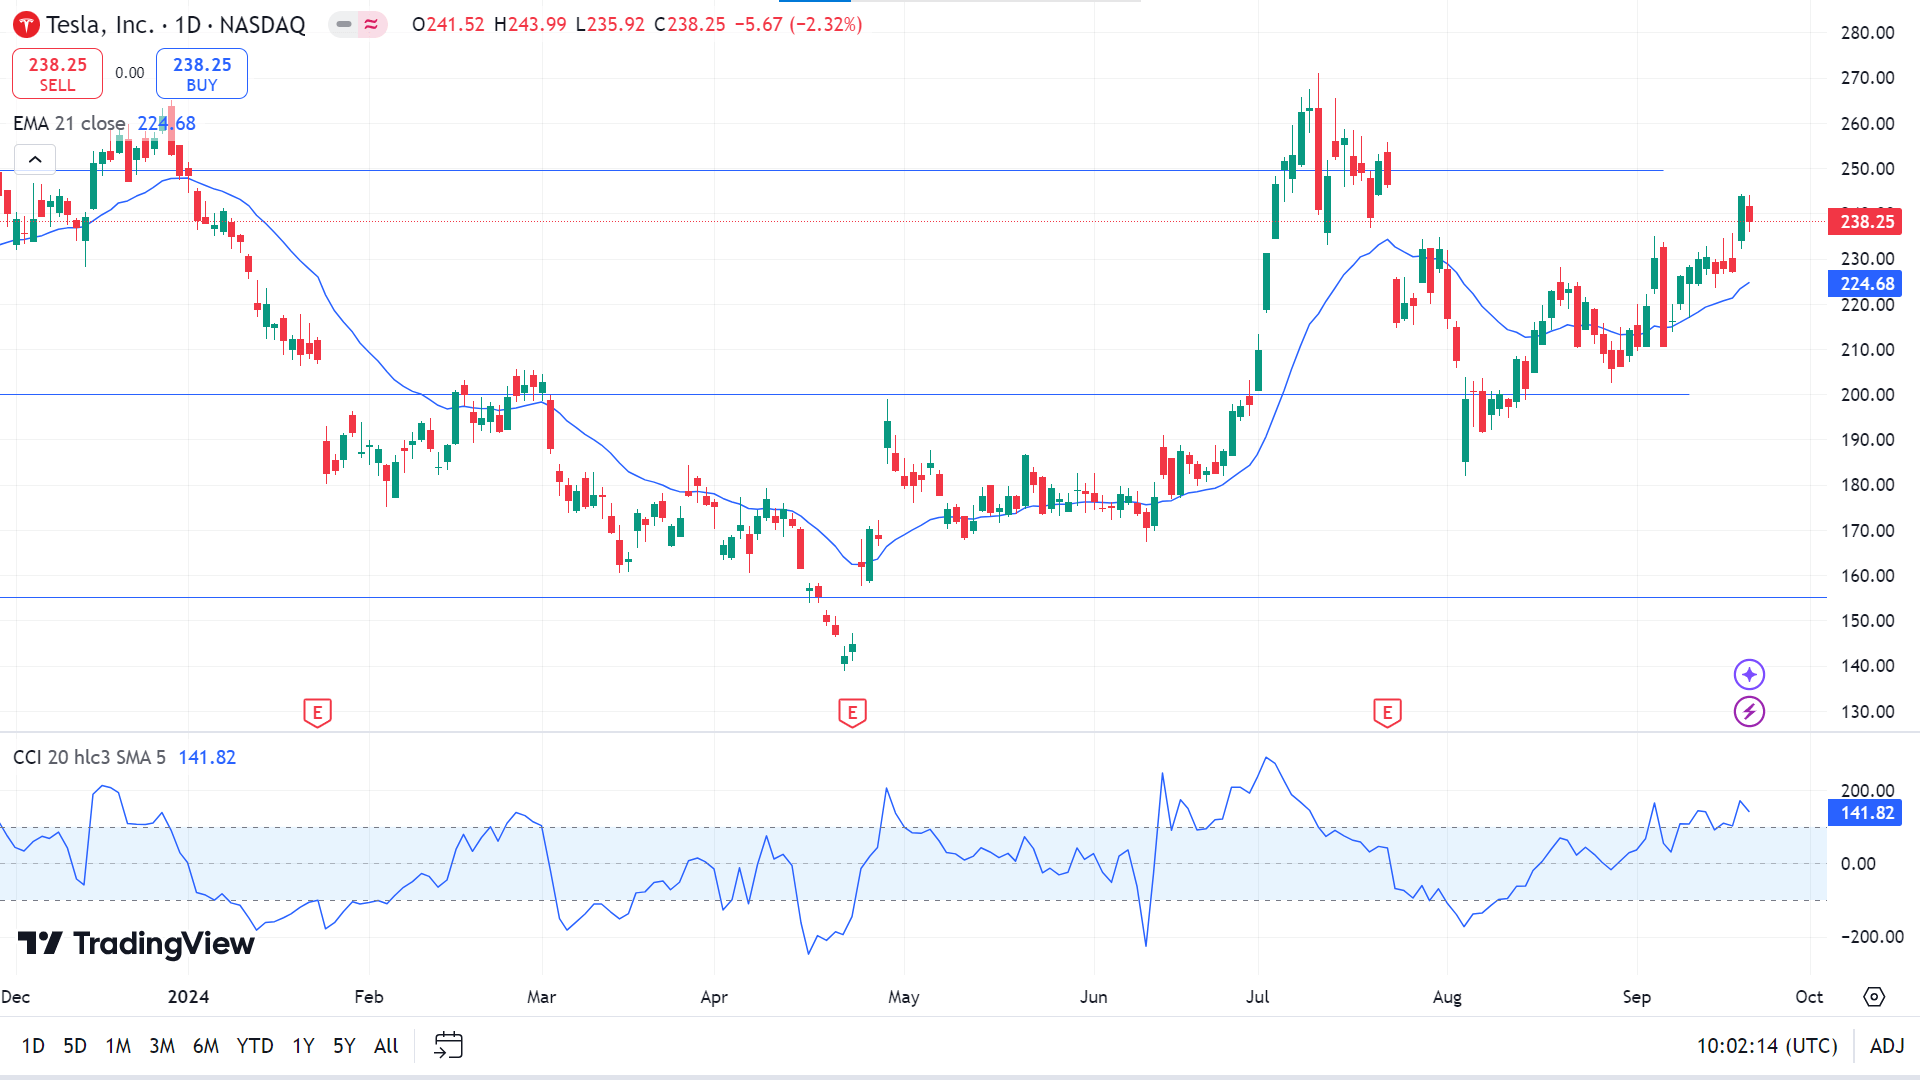
On the daily chart, the price is floating above the EMA 21 line, declaring the bullish pressure as the CCI dynamic signal line moving above the upper line of the indicator window. Still, it edges the downside, giving hope to sellers. According to the EMA 21 reading, the price may seek to regain the resistance of 249.50, followed by the next resistance near 271.00.
On the other hand, if the CCI dynamic signal line continues to edge lower toward the upper or midline of the indicator window, it will indicate that the TSLA stock price may reach an acceptable dynamic support of 224.68, and a breakout can trigger the price toward the next support near 208.25.
WTI Crude Oil (USOUSD)
Fundamental Perspective
Oil prices have risen last week, driven by critical developments in the US oil market and broader demand-side dynamics. This report outlines the latest data and ends with a technical analysis of WTI's daily chart.
Mixed signals emerged from the US oil market. The Baker Hughes oil rig count increased from 483 to 485 last Friday, signaling higher production, which could indicate more robust demand and support for oil prices. However, Tuesday's API report showed a surprising rise in crude inventories by 1.96 million barrels, suggesting supply exceeded demand, loosening market conditions. In contrast, the EIA report on Wednesday showed a drawdown of 1.63 million barrels, pointing to tighter market conditions that may lend support to prices if the trend persists.
Meanwhile, the Federal Reserve's 50-basis point rate cut—the first since 2020—may stimulate economic activity and energy demand, increasing oil prices. On the supply side, Iraq's pledge to uphold OPEC's production cuts and the ongoing closure of a significant pipeline could also contribute to price support. However, a recent ruling in China declaring two refineries bankrupt could signal weakening demand there, potentially limiting future price increases.
Technical Perspective
The weekly chart shows the last candle finished solid green after a doji with a small green body in a downtrend, signaling a potential reversal and leaving buyers optimistic for the upcoming week.
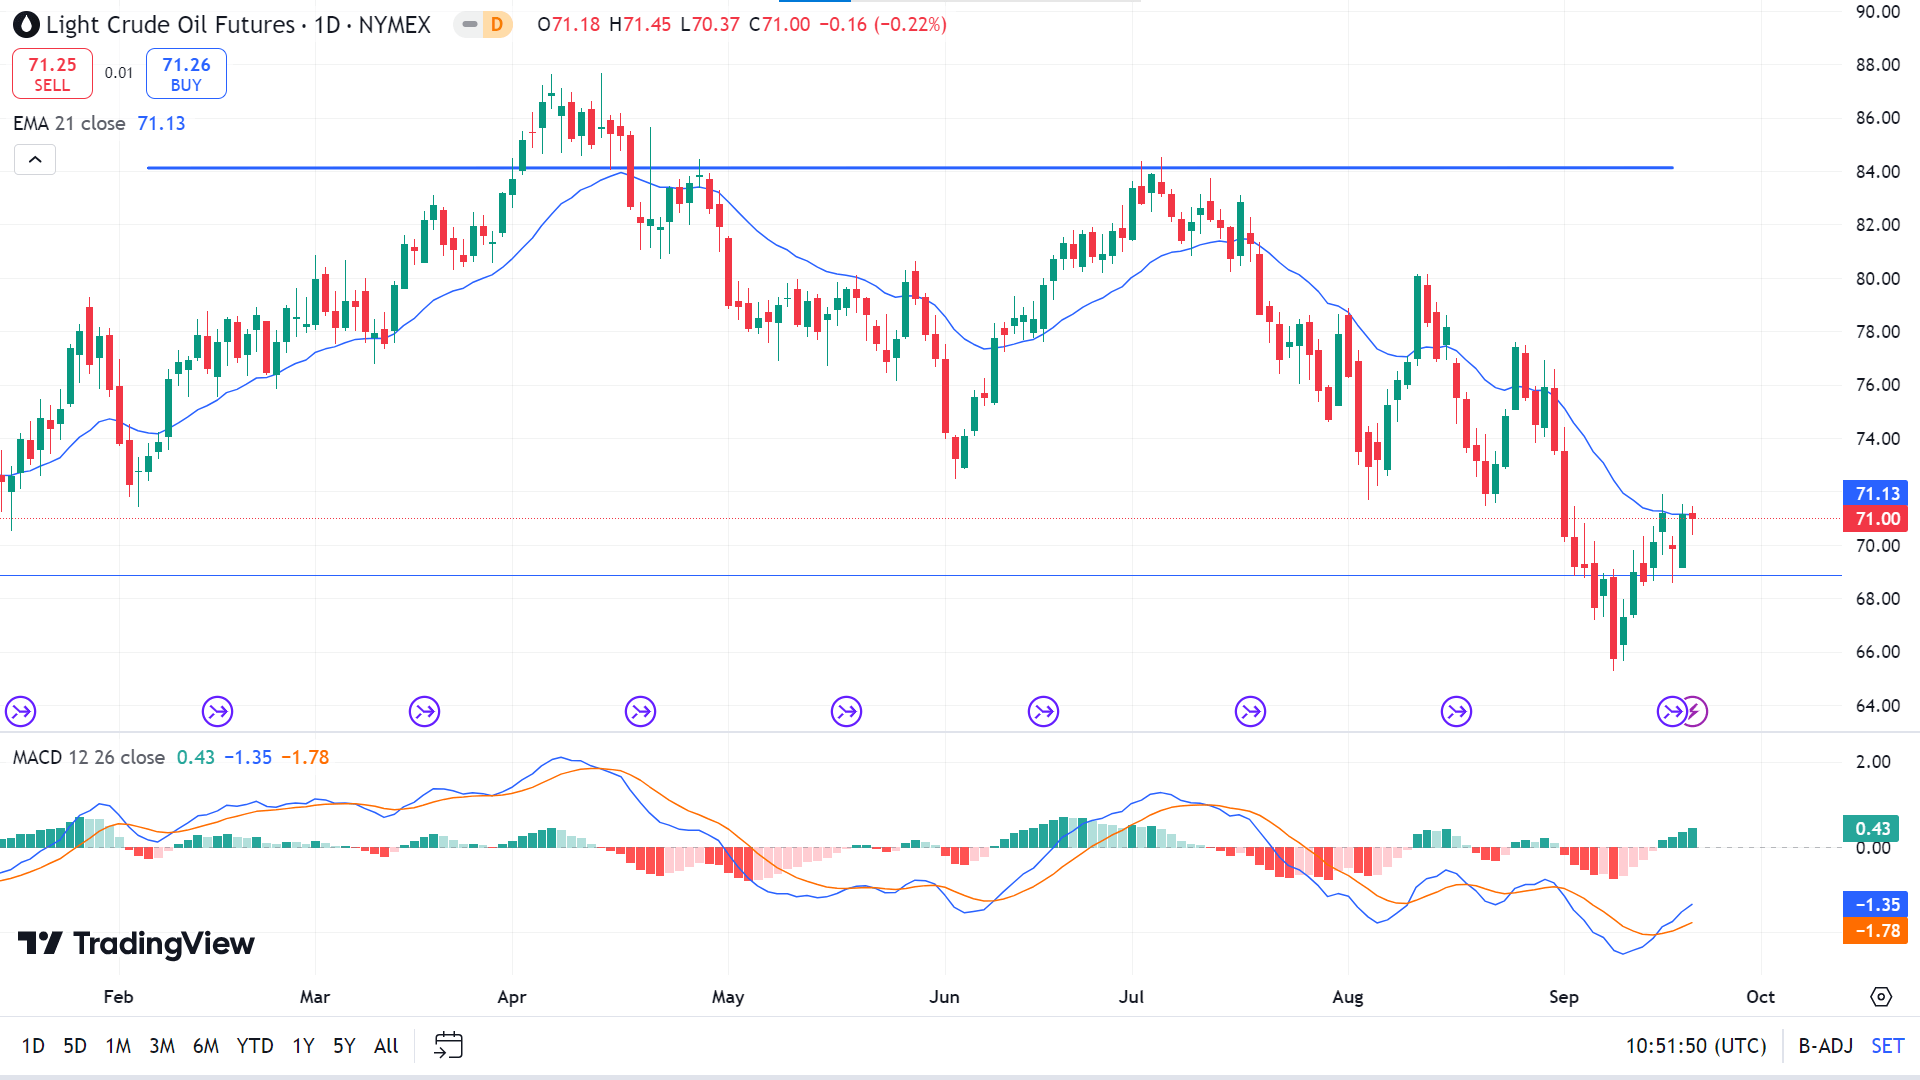
The price is below the EMA 21 line on the daily chart, reflecting a slight bearish pressure on the asset price. In contrast, the MACD indicator window suggests a solid bullish pressure through the dynamic signal lines and green histogram bars above the midline. If the price follows the MACD indication and exceeds the EMA 21 line, it can hit the resistance of 75.86, followed by the next resistance near 80.08.
Meanwhile, if the price remains below the EMA 21 line and the MACD indicator reading turns opposite, Crude Oil can return to support at 67.75, followed by the next support near 68.88, followed by the next support near 65.64.


