EURUSD
Fundamental Perspective
The EURUSD pair reversed after dropping to 1.1025, stabilizing mid-week and closing near 1.1100 after peaking at 1.1154 on Friday. Macroeconomic data from the Eurozone and the US influenced the pair's movement, with investors focusing on developments that might impact monetary policy.
In the Eurozone, weak economic performance kept the Euro subdued. The Manufacturing PMI was revised slightly higher to 45.8 in August but remained in contraction, while the Services PMI dropped to 52.9. July's Producer Price Index rose 0.8% month-over-month but declined 2.1% year-over-year, and Q2 GDP growth was revised down to 0.2%. With the European Central Bank likely to cut interest rates by 25 basis points on September 12, the market is looking for any forward guidance that could shift expectations.
In the US, disappointing employment figures fueled expectations of the Federal Reserve's potential 50-basis-point rate cut. ADP reported only 99,000 new jobs in August, while layoffs surged, and job openings fell to 7.67 million. The Nonfarm Payrolls report also missed forecasts, showing 142,000 new jobs. However, the Fed is still likely to opt for a more modest 25-basis-point rate cut at its upcoming meeting, with key inflation and sentiment data still to come.
Technical Perspective
On the weekly chart, the last candle closed with a small green body and an upper wick after a solid red candle, reflecting buyers' activity.
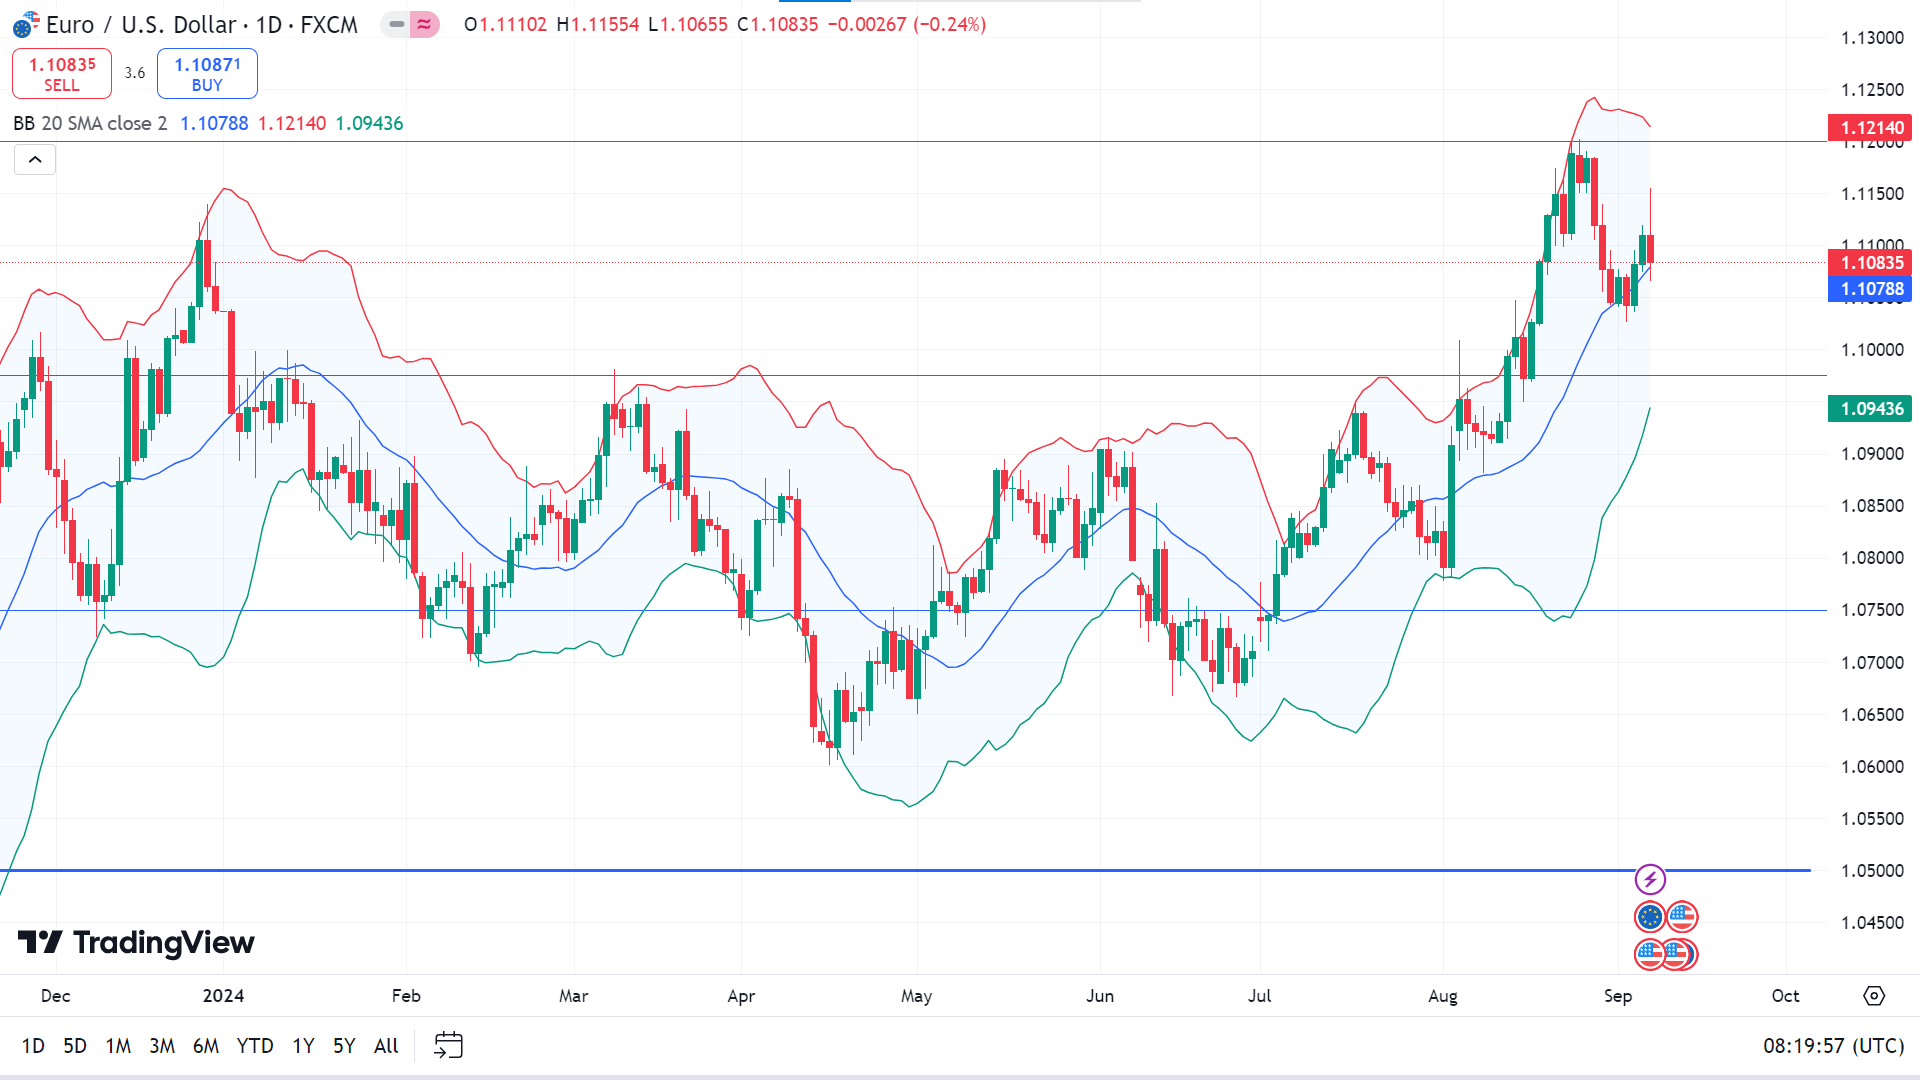
On the daily chart, the price is on the upper channel of the Bollinger bands indicator, reflecting the bullish pressure on the asset price. So, the price may head toward the nearest resistance near 1.1214, followed by the next resistance near 1.1432.
Meanwhile, if the price declines below the midline, it will open the room for the price to reach the nearest support near 1.0950, followed by the next support near 1.0745.
GBPJPY
Fundamental Perspective
At its July 30-31 meeting, the Bank of Japan (BOJ) raised its overnight interest rate target to 0.25% from a previous range of 0% to 0.1%, with a 7 to 2 vote. The decision was driven by rising inflation expectations among households and businesses, alongside easing but persistent economic uncertainties. This was the BOJ's second rate hike in 17 years, following the March increase that ended the yield curve control framework, marking a shift toward policy normalization.
The Yen has since regained much of its earlier losses, trading around ¥146, as markets anticipate more frequent rate hikes from the BOJ, although slower than other major central banks. Governor Kazuo Ueda remarked that raising rates gradually is preferable to making sharper moves later, should inflation risks materialize. He also indicated that 0.5% is not seen as a cap for the policy rate, though it remains far from neutral for economic activity.
Meanwhile, the Bank of England is set to hold a monetary policy meeting in two weeks. Traders see little chance of a rate cut now but fully price in a quarter-point cut for November.
Technical Perspective
The last weekly candle closed solid red, reflecting significant bearish pressure, leaving sellers to continue their presence this week.
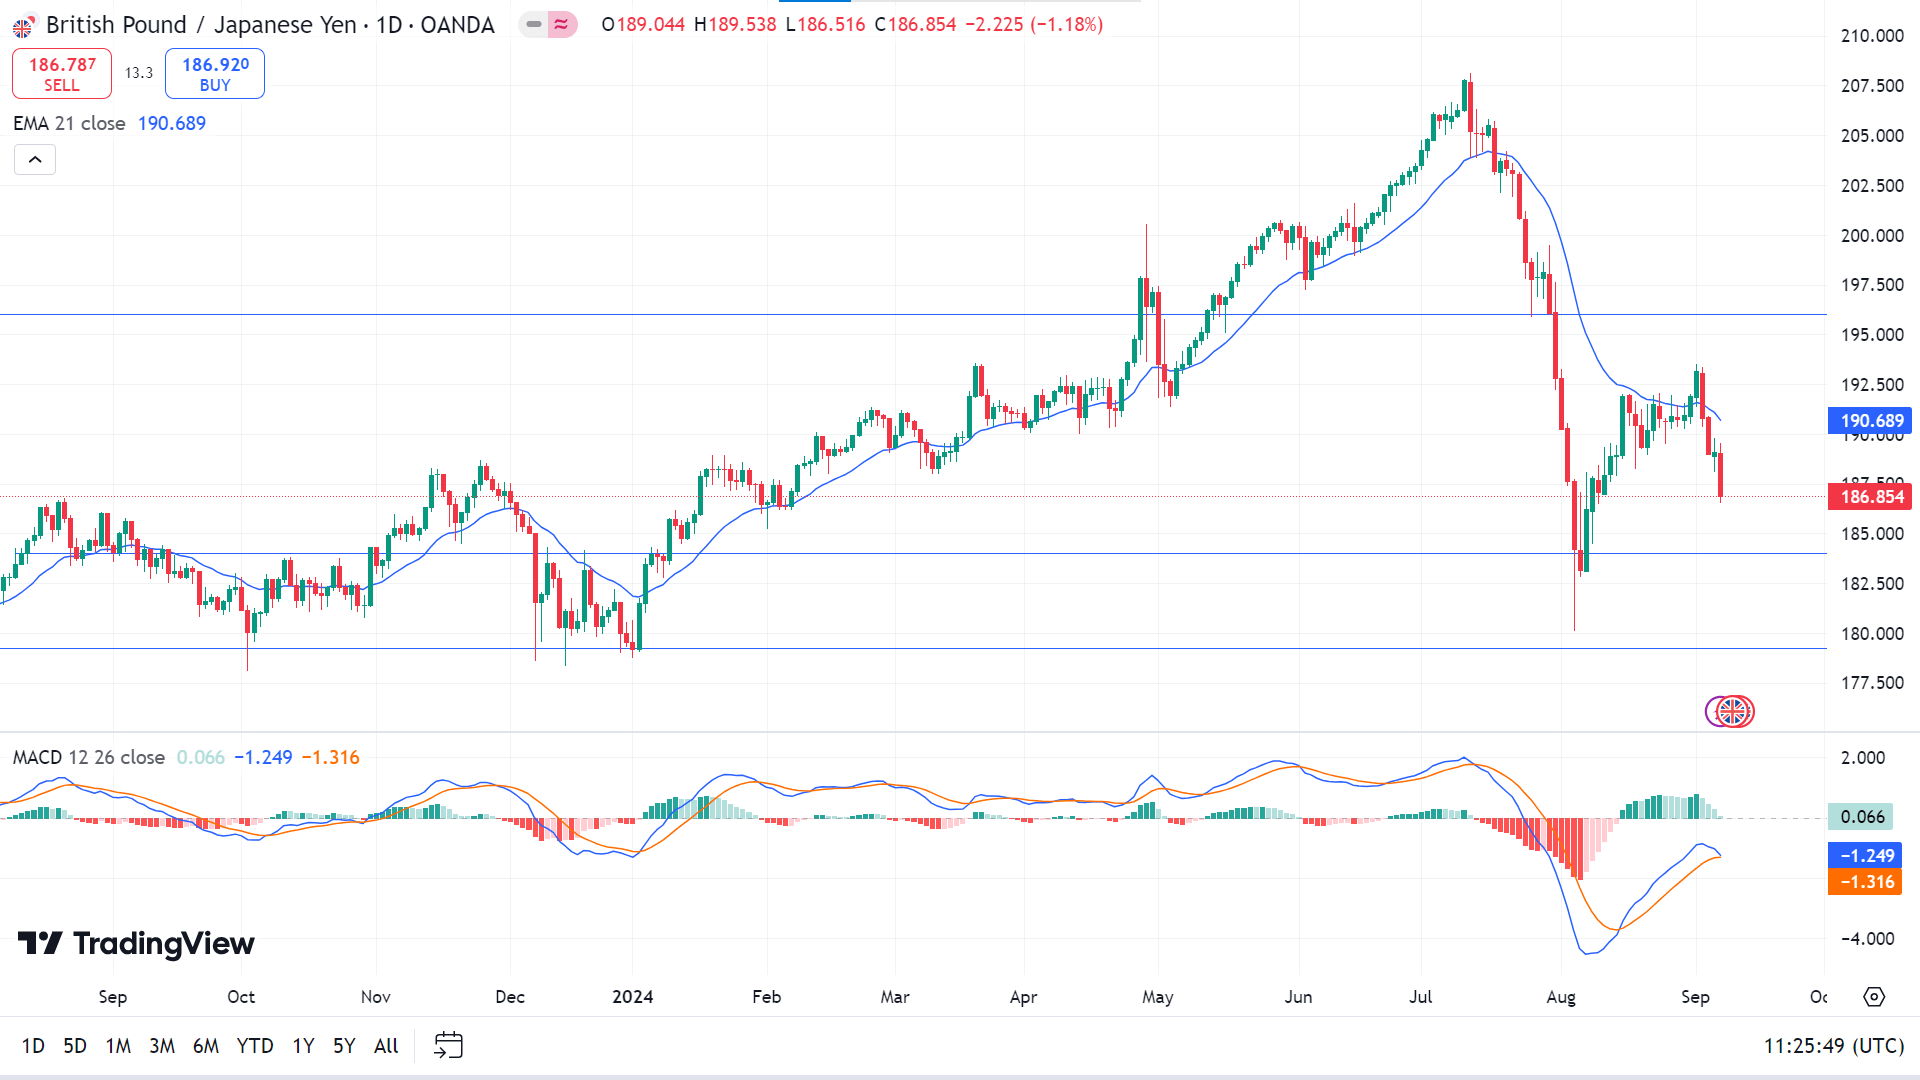
Due to recent bearish pressure, the price reached below the EMA 21 line, indicating it might hit the nearest support level near 184.00, followed by the next support level near 179.25.
Meanwhile, the MACD indicator window signals differently, indicating that it is still bullish, although the histogram bars are fading and the dynamic signal lines get closer. If the bullish pressure is sustained, the green histogram bars continue to appear above the midline of the indicator window, and the dynamic signal lines move further upward; the price may hit the primary resistance of 190.68. If the price exceeds the EMA 21 line, it can regain the next historic resistance near 196.00.
NASDAQ 100 (NAS100)
Fundamental Perspective
US benchmark equity indexes fell sharply on Friday after job data for August came in below expectations. The Nasdaq Composite reached 16,690.8, dropped by 2.6%; the Dow Jones Industrial Average closed at 40,345.4, fell 1%, and the S&P 500 ended at 5,408.4, dropped by 1.7%. Only the real estate sector remained stable, while communication services and consumer discretionary led the declines.
Over the week, the Nasdaq tumbled 5.8%, the S&P 500 retreated 4.2%, and the Dow fell 2.9%.
The US economy added 142,000 nonfarm jobs in August, missing the consensus forecast of 165,000 from a Bloomberg survey. The unemployment rate dipped slightly to 4.2%, aligning with analysts' expectations.
According to TD Economics, although the labor market has weakened over the past year, current data does not indicate a severe deterioration in fundamentals. The firm expects the Federal Reserve to implement three quarter-point rate cuts by the end of the year.
According to the CME FedWatch tool, following the data release, the likelihood of a 25-basis-point rate cut on September 18 rose to 69%, up from 60%, while the probability of a 50-basis-point cut decreased to 31%. US Treasury yields declined, with the two-year yield dropping 9.1 basis points to 3.66% and the 10-year yield edging down to 3.72%.
Technical Perspective
The last weekly candle closed as a solid red candle after two hammer candles of different colors, reflecting significant bearish pressure on the asset price.
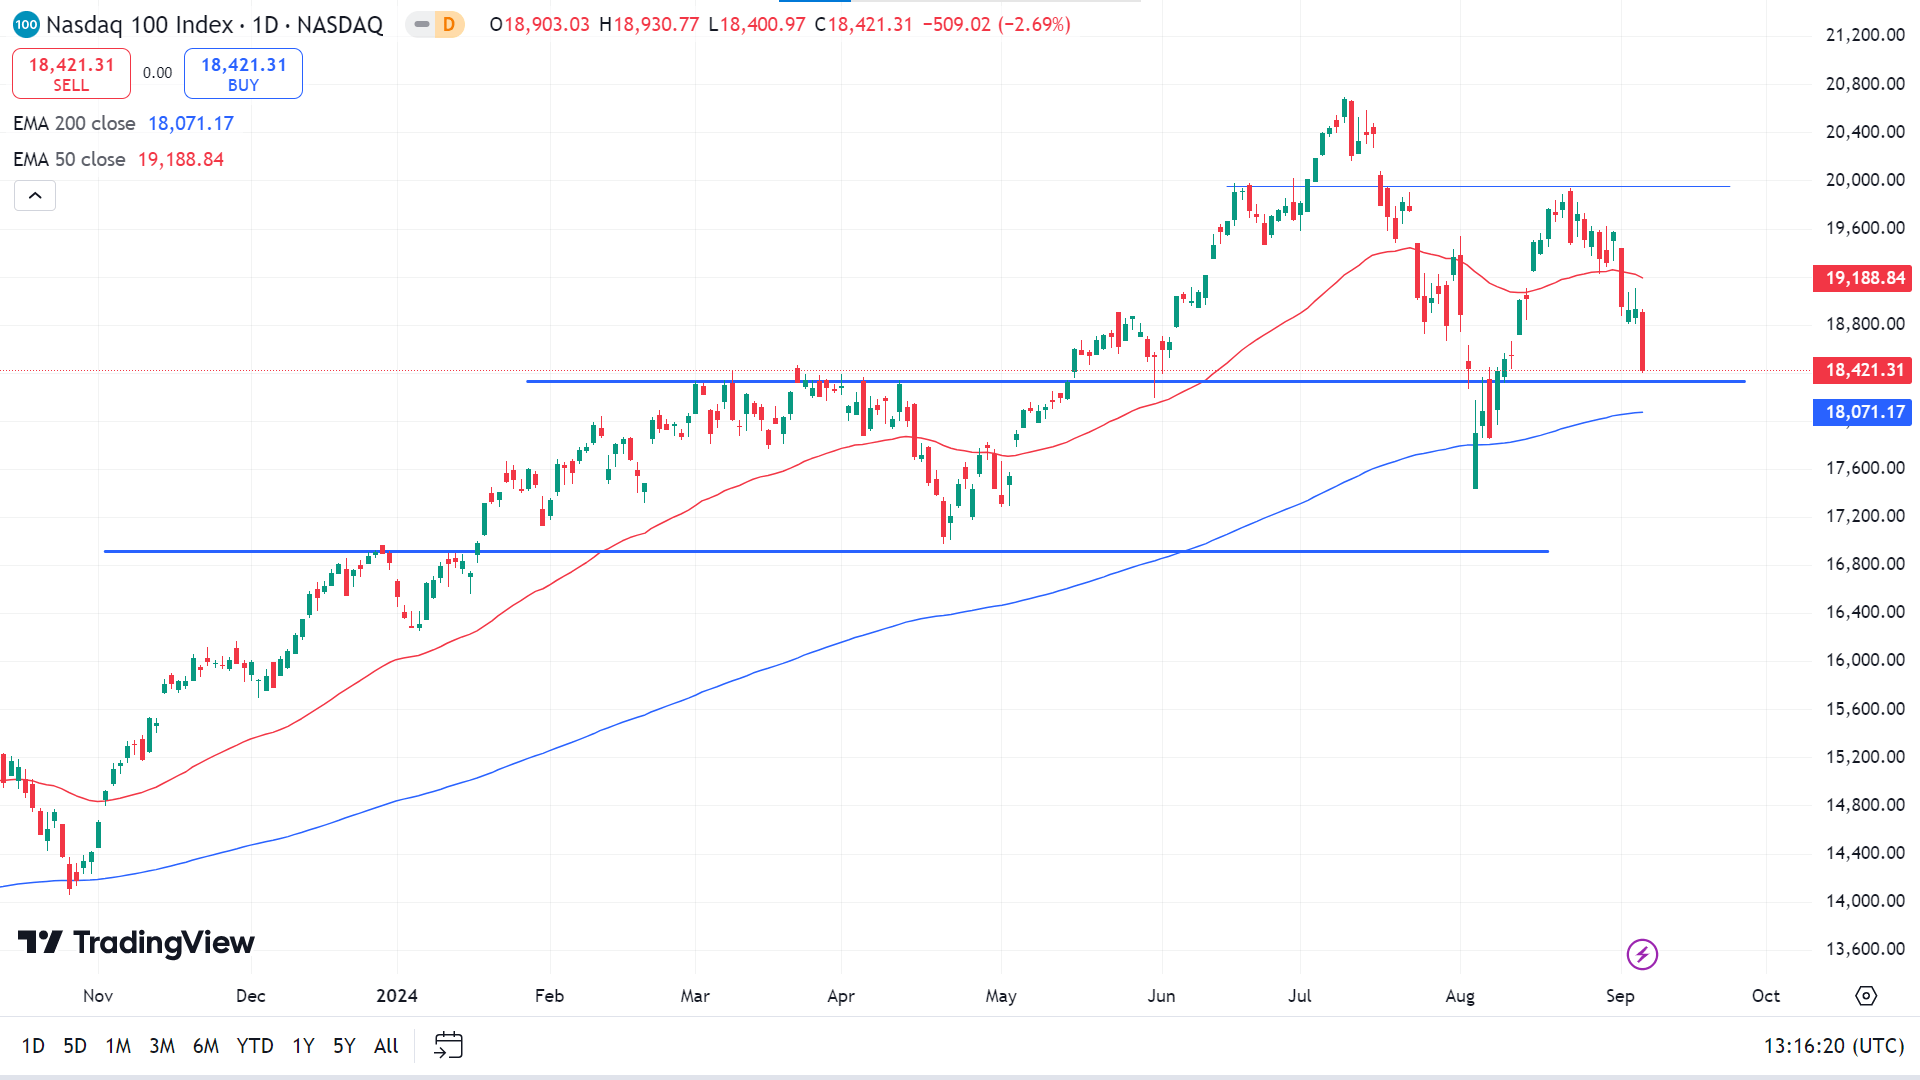
The price floats between the EMA 200 and EMA 50 lines on the daily chart, reflecting a mixed signal. The price is above sustainable support above 18330.00; if the support level is sustained, it might hit the primary resistance near 19,188.84. If it exceeds the EMA 50 level, it can hit the next resistance near 19955.44.
Meanwhile, if the price reaches below the support of 18330.00, it can decline toward the nearest support near 18,071.17. However, any further decline below the EMA 200 can trigger the price to reach the next support near 16920.00.
S&P 500 (SPX500)
Fundamental Perspective
On Friday, US stocks wrapped up a turbulent week, with the S&P 500 and Nasdaq posting their sharpest weekly declines of the year.
In August, the US economy added 142,000 jobs, falling short of the anticipated 165,000. Job growth for previous months was revised lower, signaling continued labor market cooling. Despite this, the unemployment rate dropped to 4.2%, matching expectations.
The jobs report shifted market expectations, increasing the likelihood of a more significant rate cut at the Federal Reserve's upcoming meeting. The CME FedWatch tool reveals the odds of a 50-basis-point cut climbed to 50%, a notable rise from Thursday's projections.
Chris Waller, Fed Governor, reiterated Chair Jerome Powell's recent statement, emphasizing that "the time has come" for interest rate reductions.
Broadcom (AVGO) shares dropped over 10% in corporate news after issuing a lackluster sales forecast. While the chipmaker is benefitting from surging AI demand, other segments are underperforming. This downturn also dragged down other chip stocks, with Nvidia (NVDA) shares slipping about 4%.
Technical Perspective
The last weekly candle closed solid red after a hammer candle, indicating a reversal and leaving sellers to regain in the momentum this week.
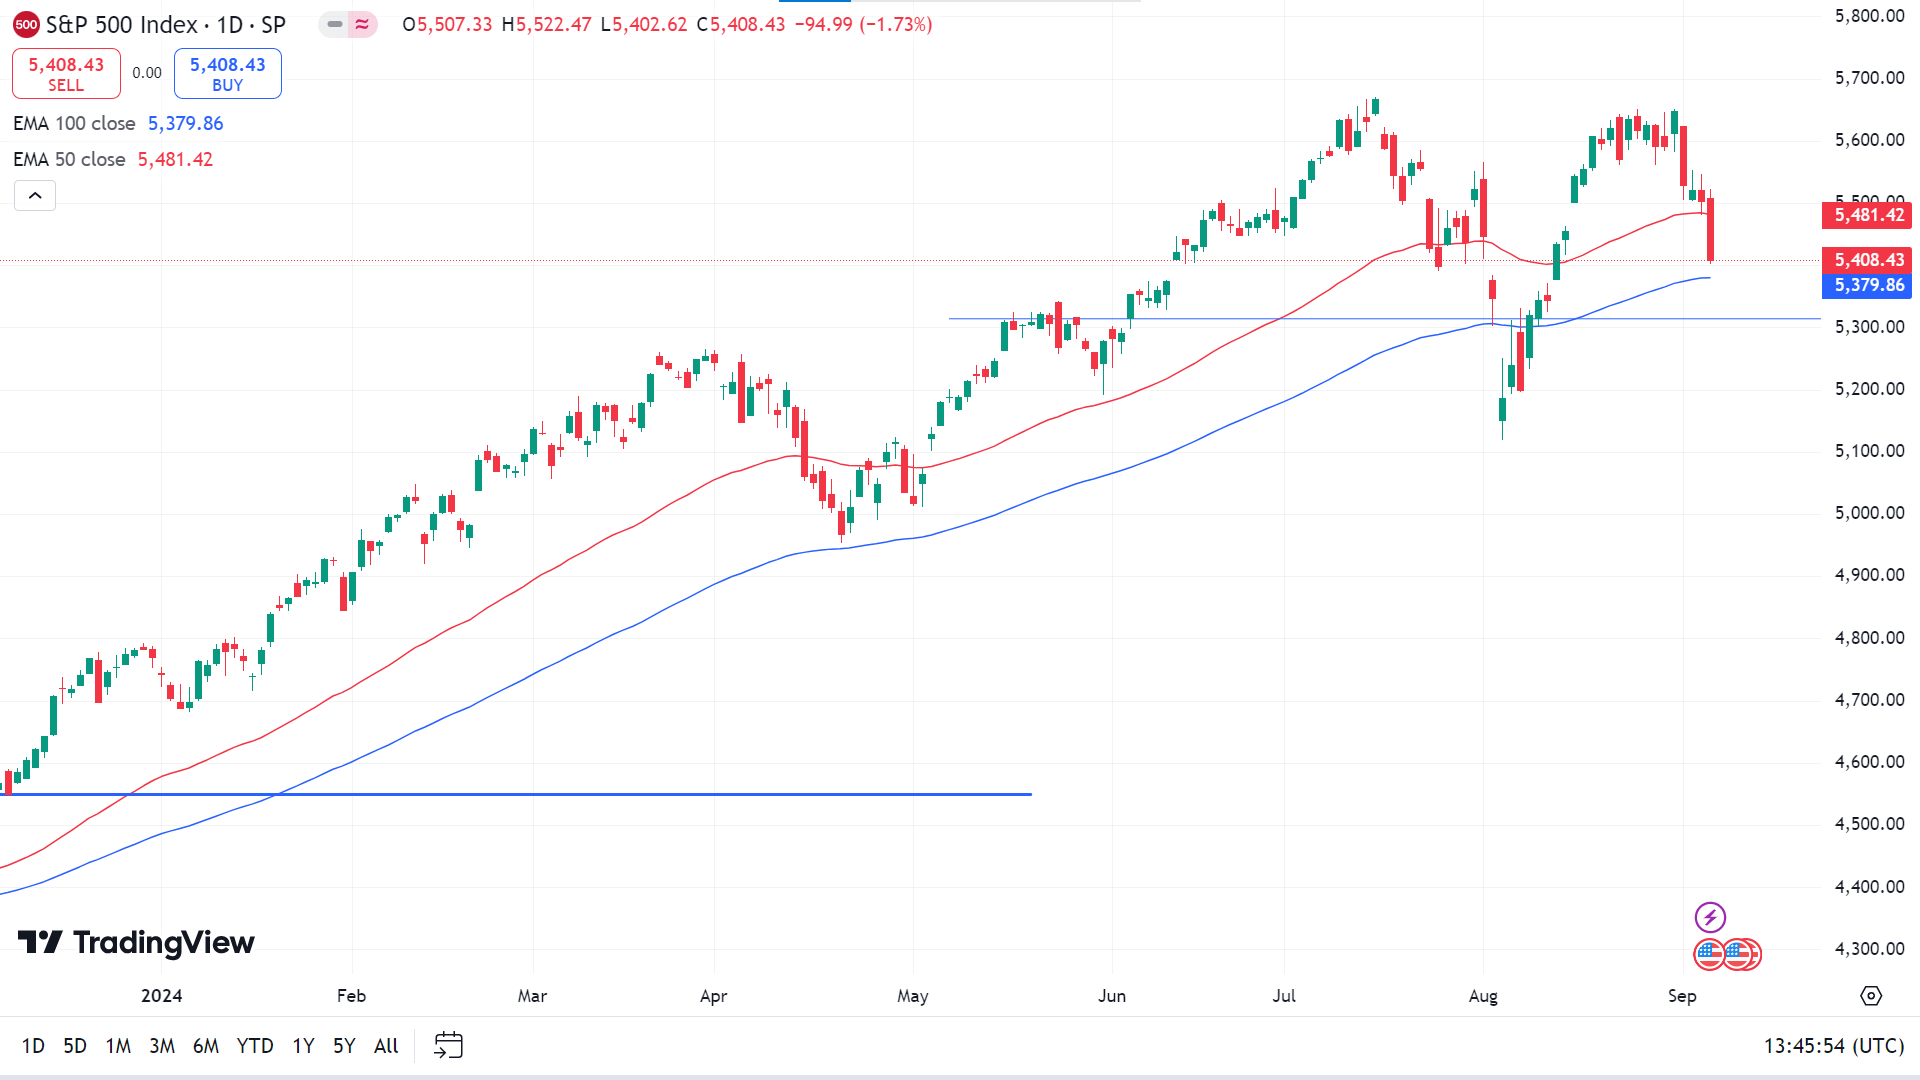
The daily chart's price floats between the EMA 100 and EMA 50 lines, reflecting a mixed signal. If the S&P index price exceeds the EMA 50 line, declaring solid bullish pressure, it may hit the primary resistance of 5,552.44, followed by the next resistance near 5,669.67.
On the other hand, if the price declines below the EMA 100 line, it will open room for the price to reach the primary support near 5313.81, followed by the next support near 5,193.50.
Gold (XAUUSD)
Fundamental Perspective
Gold fluctuated narrowly at the start of the week as US markets were closed for Labor Day. On Tuesday, Wall Street's main indexes dropped sharply after the holiday, strengthening the US Dollar and pushing XAU/USD below $2,500. However, the tide shifted on Wednesday when the US Bureau of Labor Statistics reported that job openings fell to 7.67 million in July, below expectations, which weakened the USD and helped Gold climb back above the $2,500 mark.
On Thursday, Gold extended its gains, driven by technical selling and weaker-than-expected US employment data. The ADP report showed private-sector job growth at 99,000 in August, well below market expectations of 145,000. A 10-year US Treasury yield drop below 3.7% further supported XAU/USD.
Friday's Nonfarm Payrolls report indicated a gain of 142,000 jobs in August, missing forecasts. July's figures were revised downward. Despite this, Gold held its ground as Treasury yields continued to decline.
Investors are eyeing upcoming US inflation data and China's trade balance, which could influence Gold prices. TD Securities noted that extreme market positioning in Gold signals potential downside risks driven by diminishing physical demand and speculative trading.
Technical Perspective
The last weekly candle closed as a doji with a small red body, posting two consecutive losing weeks, leaving sellers optimistic for the next week.
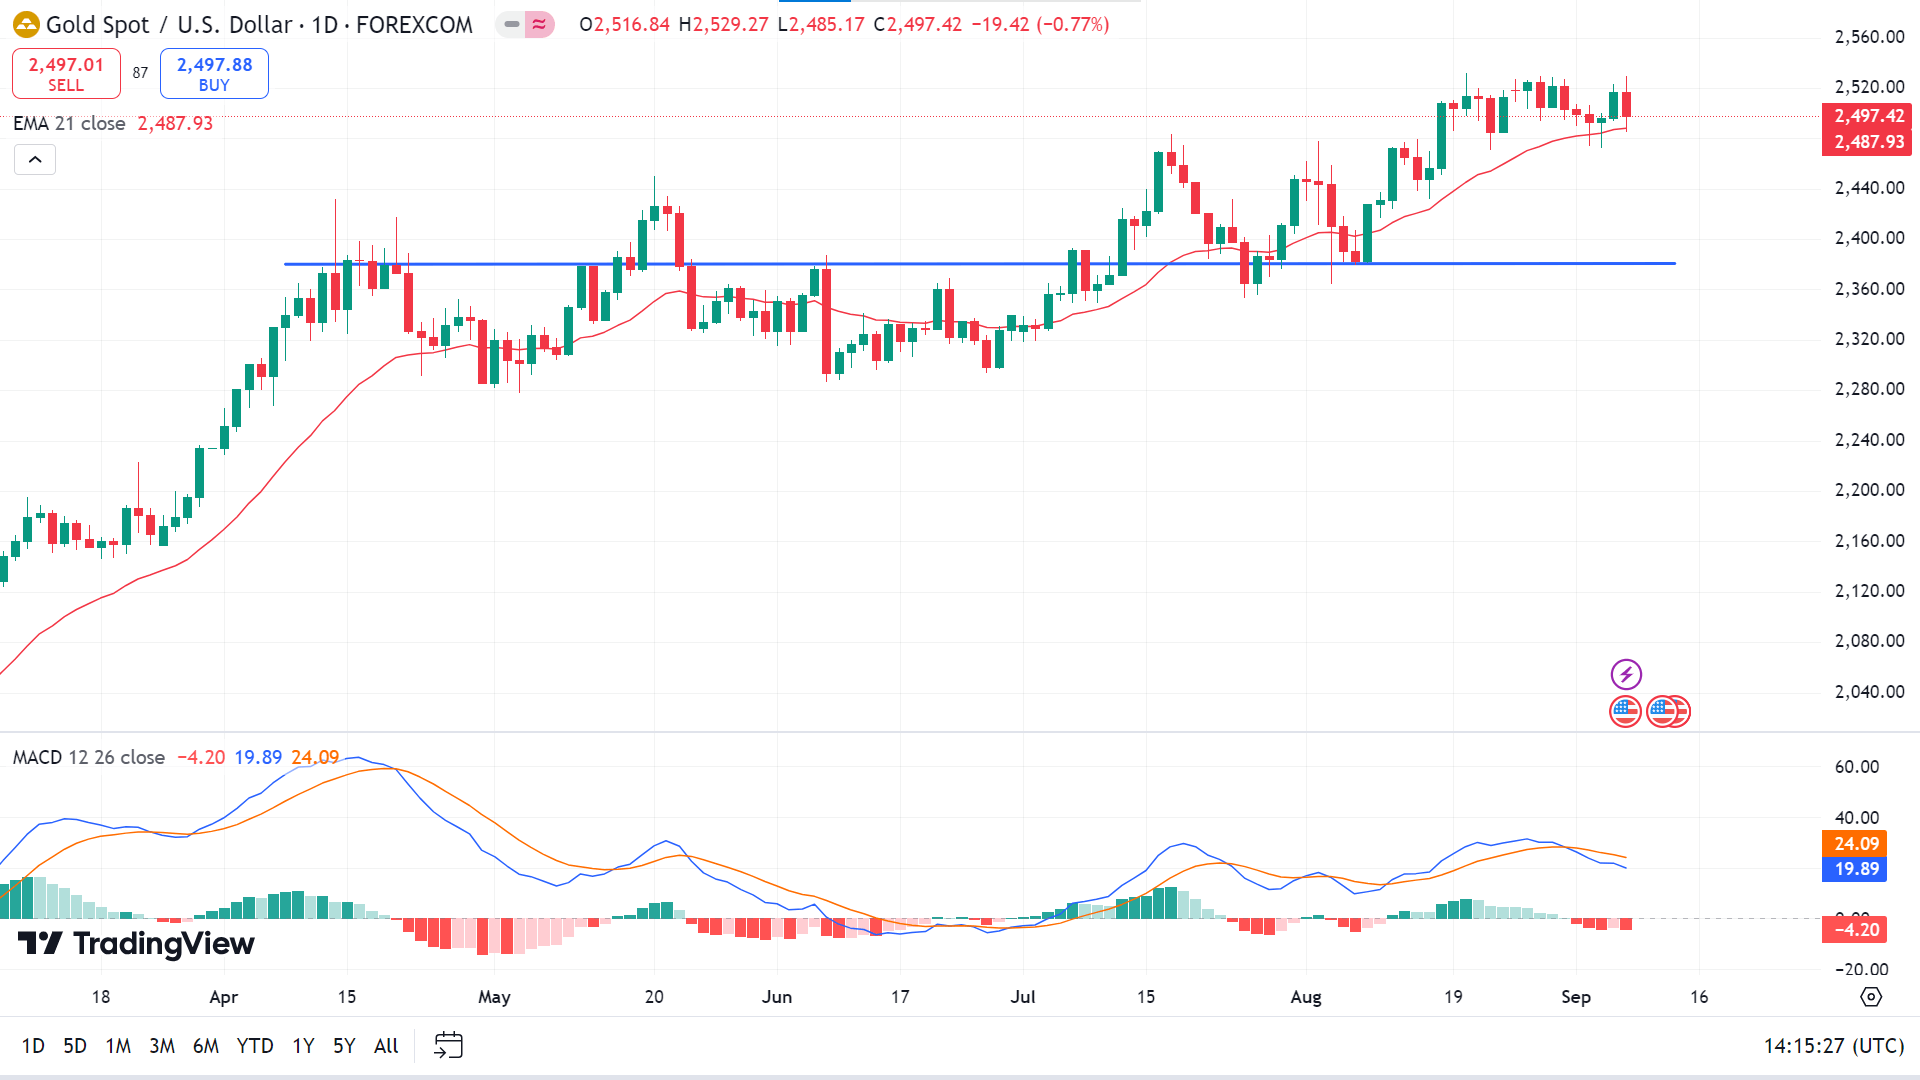
The daily chart's price is floating above the EMA 21 line, suggesting active bullish pressure on the asset, which indicates that the price might hit the nearest resistance near 2,531.79 shortly, which is also the ATH. In contrast, any breakout might trigger the price toward the next possible resistance near 2,630.85.
On the other hand, if the price declines below the EMA 21 line, it can reach the primary support near 2,447.11, followed by the next support near 2,386.21, before continuing further upside.
Bitcoin (BTCUSD)
Fundamental Perspective
On Friday, Bitcoin (BTC) tested the crucial $56,000 support level, posting a weekly decline of over 1%. A break below this level could trigger a continued downtrend as institutional selling rises and on-chain data turns bearish. By Thursday, US spot Bitcoin ETFs saw outflows of $536.1 million, a pattern that had persisted since August 27, signaling weak investor sentiment. The total reserves now stand at $42.26 billion held by these 11 ETFs.
Institutional behavior suggests mounting selling pressure. Lookonchain reported that Ceffu transferred 3,063 BTC (worth $182 million) to Binance in late August, likely preparing for a sale. Additionally, a whale deposited 1,000 BTC ($55.63 million) into Binance on Friday, further weighing on the market.
Despite a brief 1.5% price bump after weaker-than-expected US jobs data for August, Bitcoin struggled to maintain momentum. Hopes for a swift Federal Reserve rate cut initially supported the price, but lingering uncertainty dampened gains. Further bearish signs include Bitcoin's long-to-short ratio falling to 0.93 and the Daily Active Addresses metric declining from 836,960 to 685,350, reflecting reduced demand for BTC's blockchain activity.
Technical Perspective
The last weekly candle closed red, posting two consecutive losing weeks, declaring sell pressure and leaving sellers optimistic for the next week.
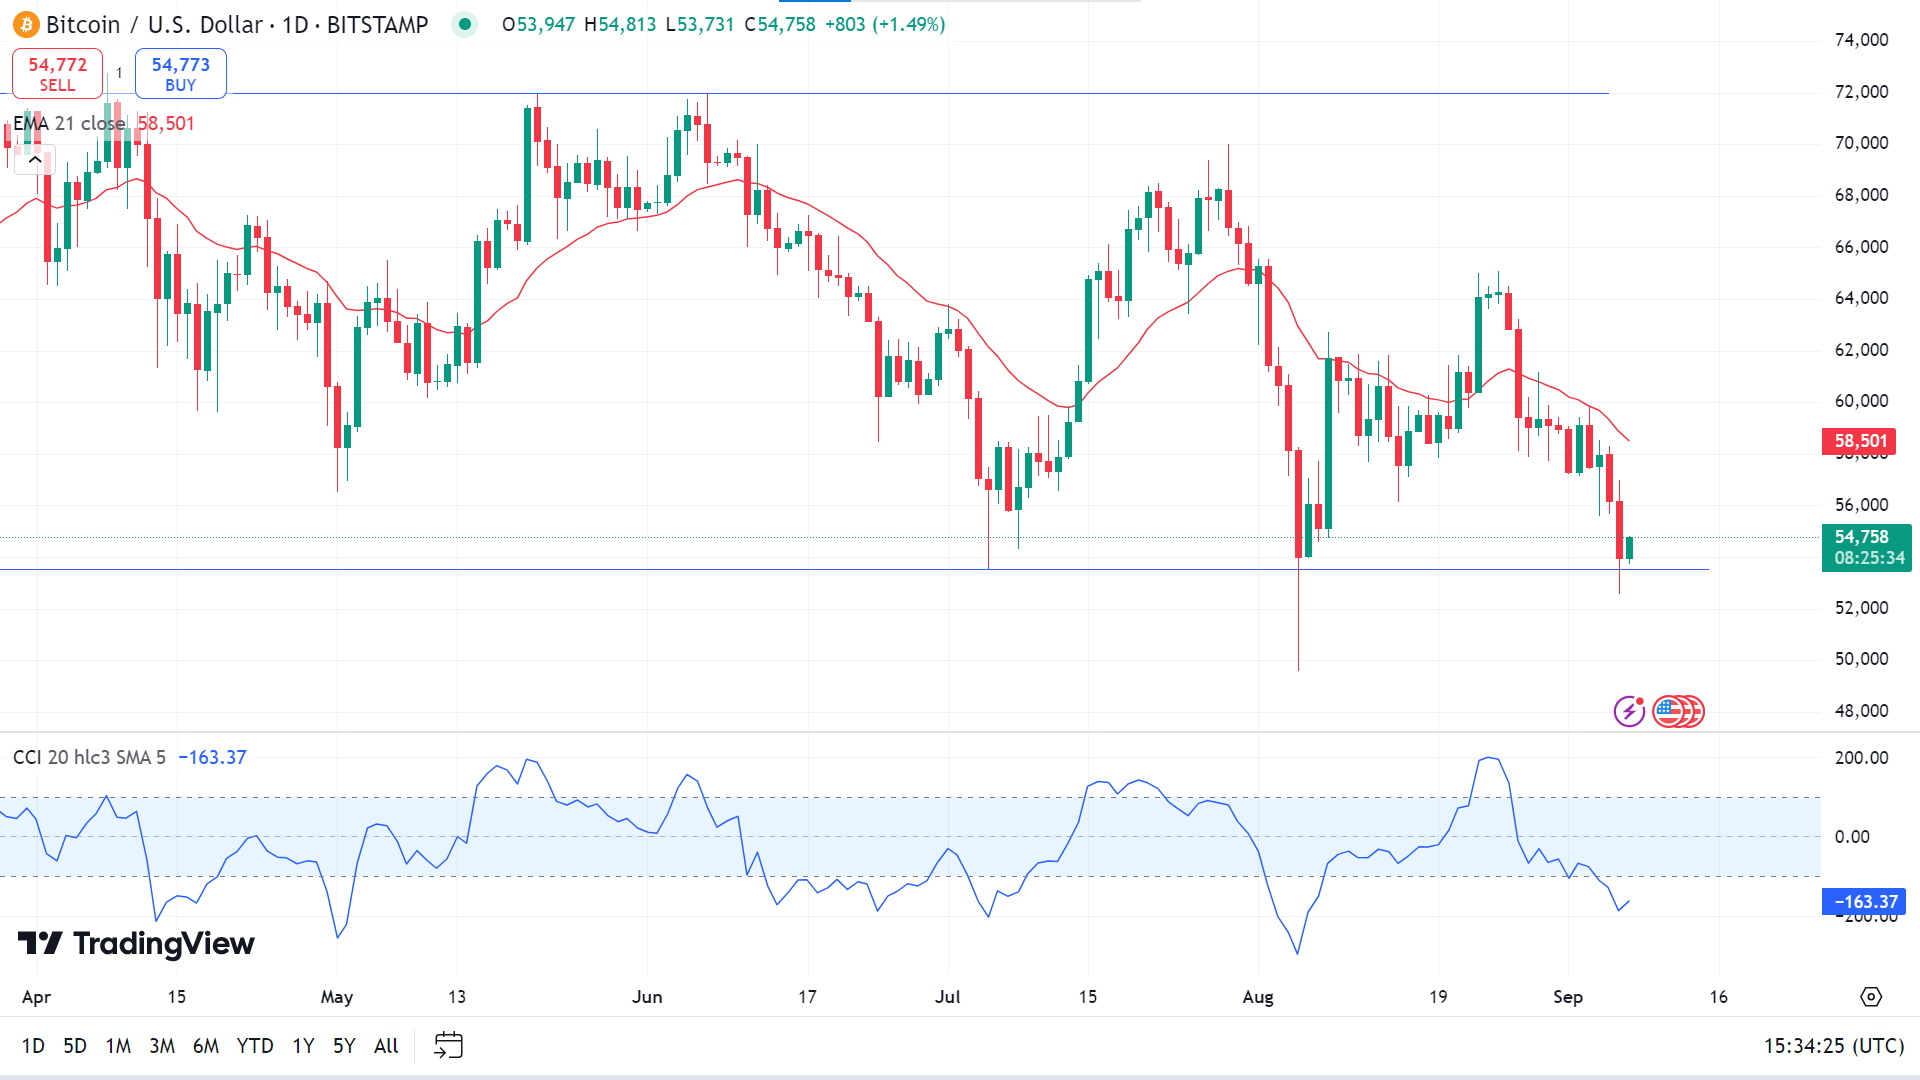
The price floats below the EMA 21 line on the daily chart, indicating seller domination on the asset price. At the same time, the CCI indicator window reflects hope for buyers as the dynamic signal line edges slightly upward. If the price remains below the EMA 21 line, it can reach the nearest support near 50,963, followed by the next support near 48,689.
However, the price has slightly bounced from an acceptable support of around 53,550. If the support level is sustained and the CCI signal line continues to move upward, the BTCUSD pair might hit the primary resistance at 58,496. In addition, if the BTCUSD exceeds the EMA 21 line, it can hit the next resistance, which is near 64,465.
Ethereum (ETHUSD)
Fundamental Perspective
Titan of Crypto is a crypto analyst who believes Ethereum (ETH) is nearing an upward shift after entering oversold territory. In a recent post on X (formerly Twitter), he noted that whenever ETH's relative strength index (RSI) reaches or approaches oversold conditions on the 3-day chart, it typically triggers a rally or a short-term price pump. According to his analysis, ETH could climb as high as $6,000 if a rally materializes or at least $3,000 during a brief surge.
Meanwhile, Crypto Wolf highlighted that sentiment for Ethereum has reached a low, suggesting the cryptocurrency is close to bottoming out. He expects a bullish reversal once this bottom is confirmed, projecting a rise to $2,900 initially and up to $5,600 if ETH breaks past $3,900.
Analyst Poisedon also sees a potential recovery for Ethereum, expecting a price shift if it regains the $2,600 mark, potentially reaching $3,200. Ongoing selling pressure from Grayscale's Ethereum Trust (ETHE), which has caused a $562.31 million net outflow since July, has impacted prices. However, analysts believe a parabolic rally could follow once the pressure eases, similar to Bitcoin's rise after its ETF-related dip. Currently, ETH trades for around $2,320.
Technical Perspective
The last weekly candle closed red, posting two consecutive losing weeks, which indicates seller domination on the asset price and leaves sellers optimistic for the next week.
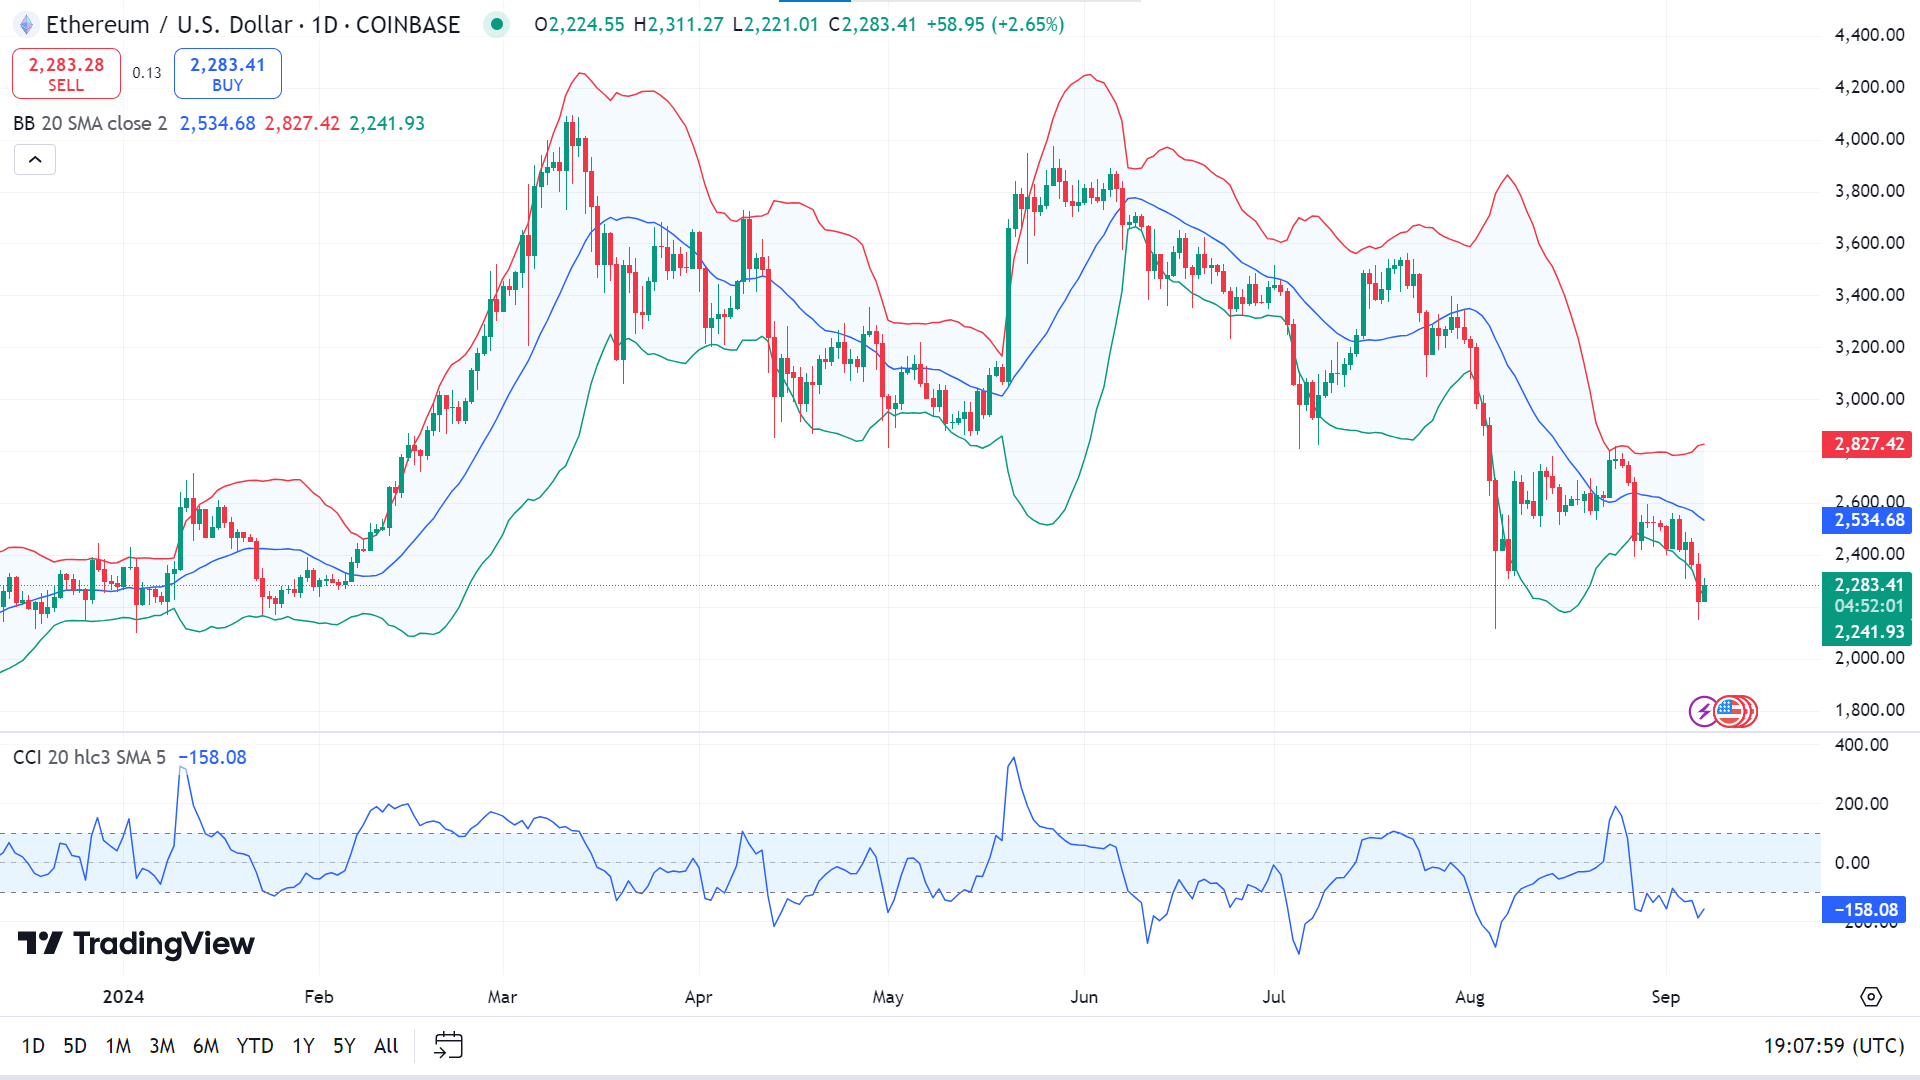
On the daily chart, the price is moving at the lower band of the Bollinger bands, reflecting recent bearish pressure, while the CCI indicator window suggests bulls can take control. If the price continues to move below the EMA 21 line and the CCI signal line edges downward, it can decline toward the primary support of 2,181.15, followed by the next support near 1,947.31.
Meanwhile, the price at the lower band of the Bollinger bands indicator signals oversold besides signaling a reversal. So, if the CCI signal line continues to slope upside, the price can hit the primary resistance near 2,534.66, followed by the next resistance near 2,827.48.
Nvidia Stock (NVDA)
Fundamental Perspective
Since Nvidia's AI-driven surge following ChatGPT's launch in November 2022, the stock has skyrocketed over sixfold, though marked by occasional declines. It now holds eight of the ten largest one-day market cap drops on record. As Nvidia's value has grown, its price fluctuations have increased, with even small percentage moves translating into substantial shifts.
At the same time, Nvidia has seen five of the top 10 one-day market cap gains, including a record $327 billion increase on July 31. Large swings are expected as a high-growth semiconductor stock, given its 122% revenue growth in the latest quarter—far surpassing more mature giants like Microsoft and Apple.
Despite occasional declines, Nvidia remains the best-performing stock in the S&P 500 this year, rising 107%. Its latest drop, after a mixed manufacturing report, wasn't tied to the company's fundamentals. While Nvidia will eventually face a slowdown, particularly as AI training demand diminishes, this is not expected in the near term. With an ongoing demand for its GPUs and advancements in AI, Nvidia's growth is likely to persist, and its stock may continue reaching new highs.
Technical Perspective
The last weekly candle closed solidly red, posting two consecutive losing weeks. The previous week's gain was erased, leading a seller's presence in the current market.
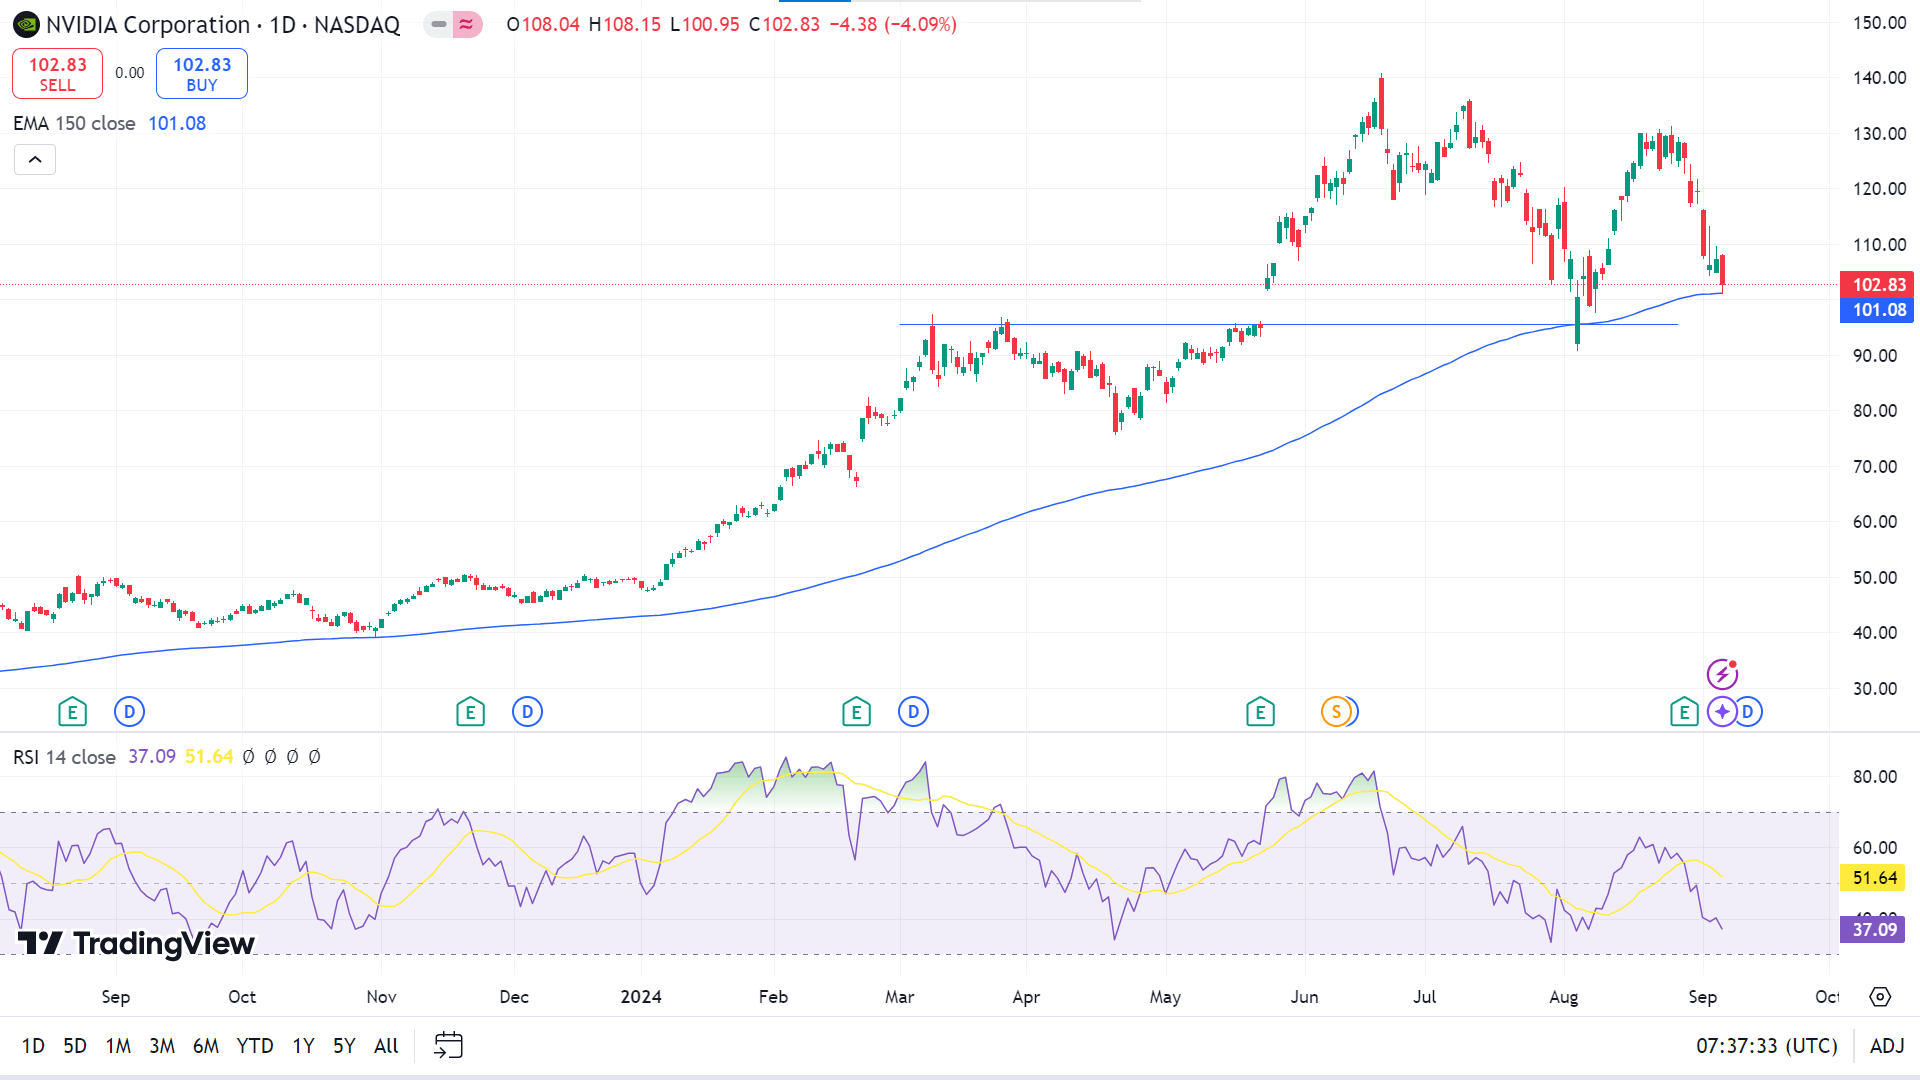
On the daily chart, the price reaches the EMA 150 line due to recent bearish pressure, while the RSI indicator readings remain neutral below the midline of the indicator window. If the price continues above the EMA 150 line and the RSI dynamic line continues edging upside, the NVDA share price might hit the nearest resistance of 115.51, followed by the next resistance near 129.71.
Meanwhile, if the price drops below the EMA 150 line and the RSI signal line slopes downward, the NVDA share price might reach the primary support near 95.50, followed by the next support near 85.45.
Tesla Stock (TSLA)
Fundamental Perspective
Tesla (NASDAQ: TSLA) shares saw a notable rise this week, jumping over 4% on Wednesday and an additional 7% by Thursday morning, as of 10:45 a.m. ET, they held a 6.3% gain. The rally wasn't driven by car sales but by updates from CEO Elon Musk and Tesla's electric vehicle (EV) business developments.
Musk's visit to Tesla's engineering offices in California sparked excitement after he hinted at the future of Tesla's robotics division, particularly the Optimus humanoid robot, designed for factories and households, which could enhance Tesla's earnings.
However, Thursday's stock movement was largely driven by Tesla's announcement of a Full Self-Driving (FSD) rollout timeline. Subject to regulatory approval, Tesla plans to introduce its latest FSD version to Europe and China by the first quarter of 2025. This international expansion could generate significant revenue for the company.
Additionally, Tesla's upcoming robotaxi event on October 10 promises further insights into its autonomous driving plans, heightening investor excitement. If Tesla sticks to its schedule, investors may see substantial rewards shortly.
Technical Perspective
The last weekly candle closed as an inverted hammer with a small red body and long upper wick, reflecting seller domination on the asset price.
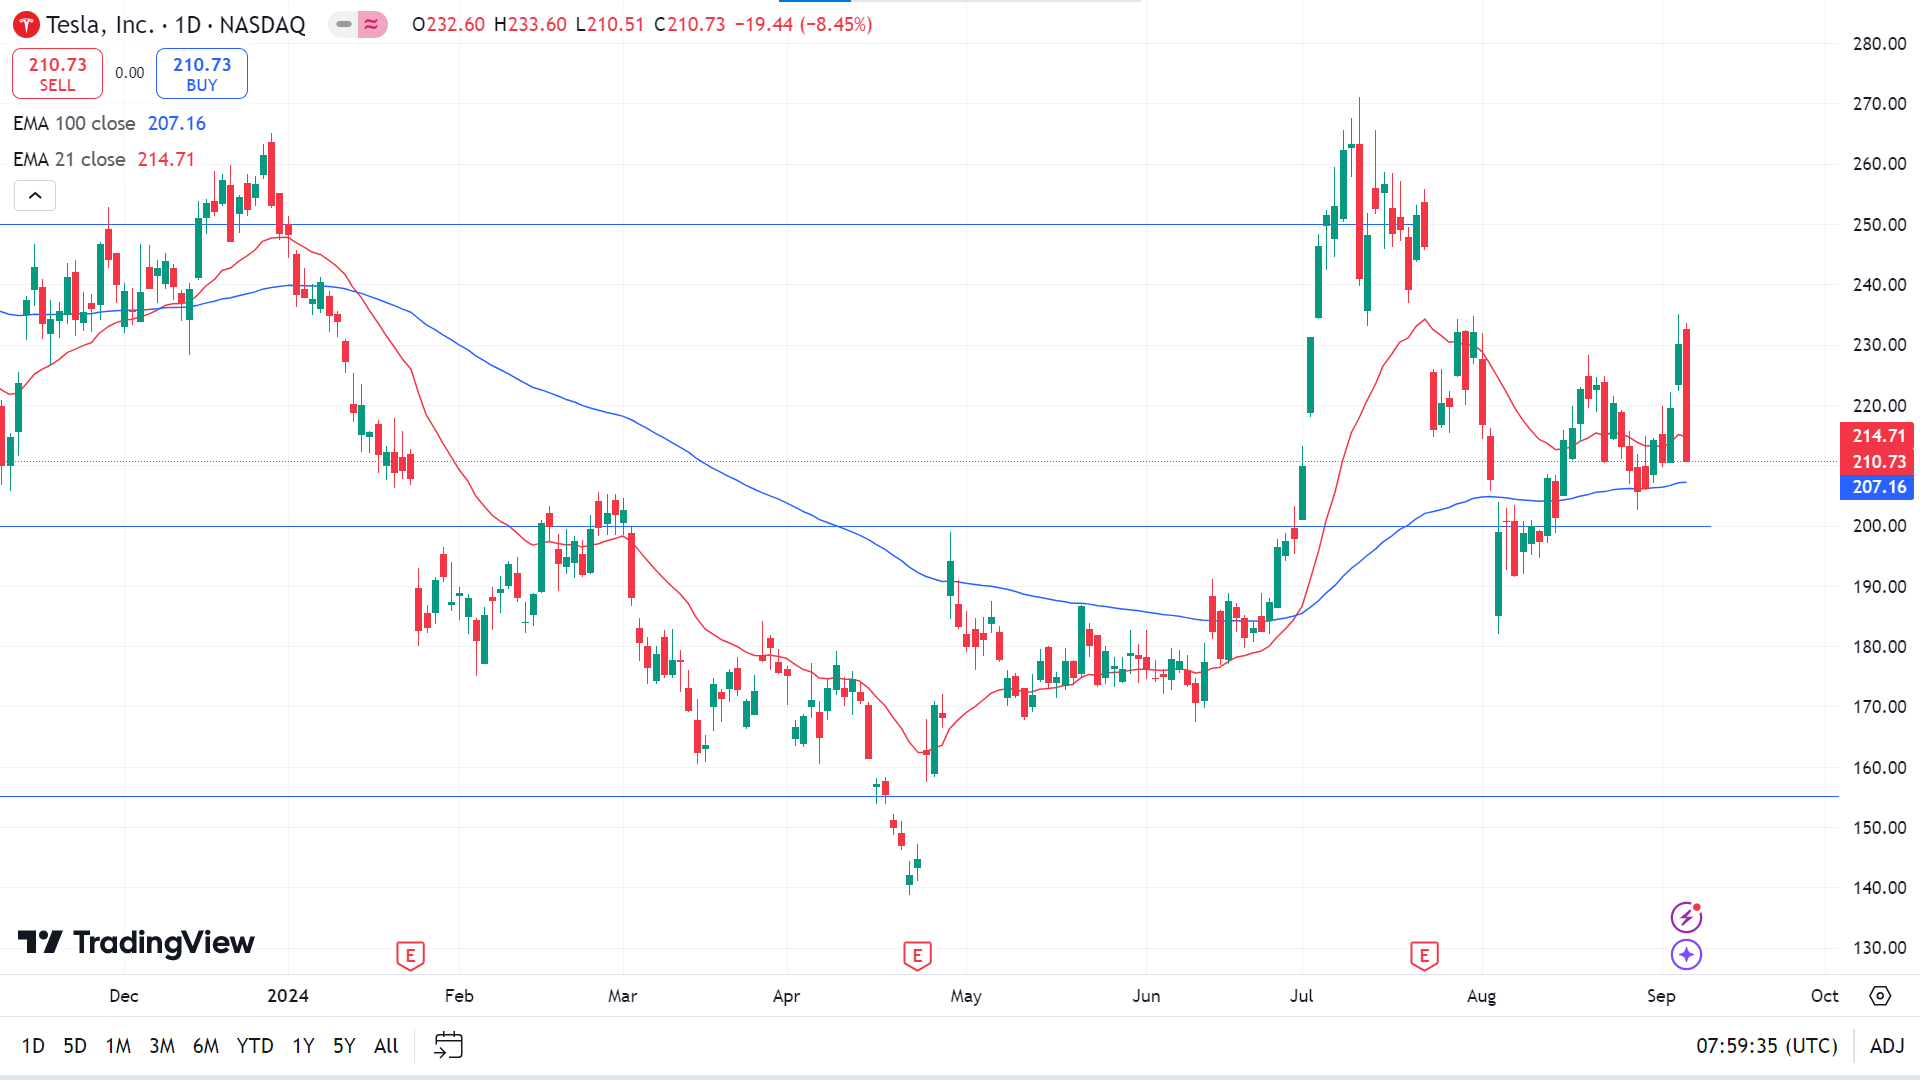
The price is floating between the EMA 21 and EMA 100 lines on the daily chart, reflecting a mixed signal. If the price bounces back above the EMA 21 line, it will indicate the price might hit the primary resistance near 225.41, followed by the next resistance near 235.00.
On the other hand, if the price declines below the EMA 100 line, declaring full bearish pressure, it can reach the nearest support of 200.00, followed by the next support near 185.00.
WTI Crude Oil (USOUSD)
Fundamental Perspective
Crude oil prices held steady on Friday after a sharp drop earlier in the week, settling below $70 for a second consecutive day. The decline was largely due to mixed signals from OPEC+ regarding production cuts. Although some members hinted at a potential deal to extend reduced output, markets had anticipated stronger, more decisive measures to support oil prices more effectively.
Meanwhile, the US Dollar Index (DXY) fluctuated following the release of the US Jobs Report. The report showed that 142,000 jobs were added in August, falling short of the forecasted 160,000, with July's numbers revised to 89,000. Initially, this led to a drop in the dollar. Still, the currency rebounded as reports of increased overtime suggested underlying strength in the US labor market, signaling continued demand and economic activity.
Despite weaker job growth, these indicators helped to stabilize the dollar and kept investors cautious about further moves in the oil market.
Technical Perspective
The last weekly candle ended solid red, posting four consecutive weeks of loss, leaving sellers optimistic for the next week.
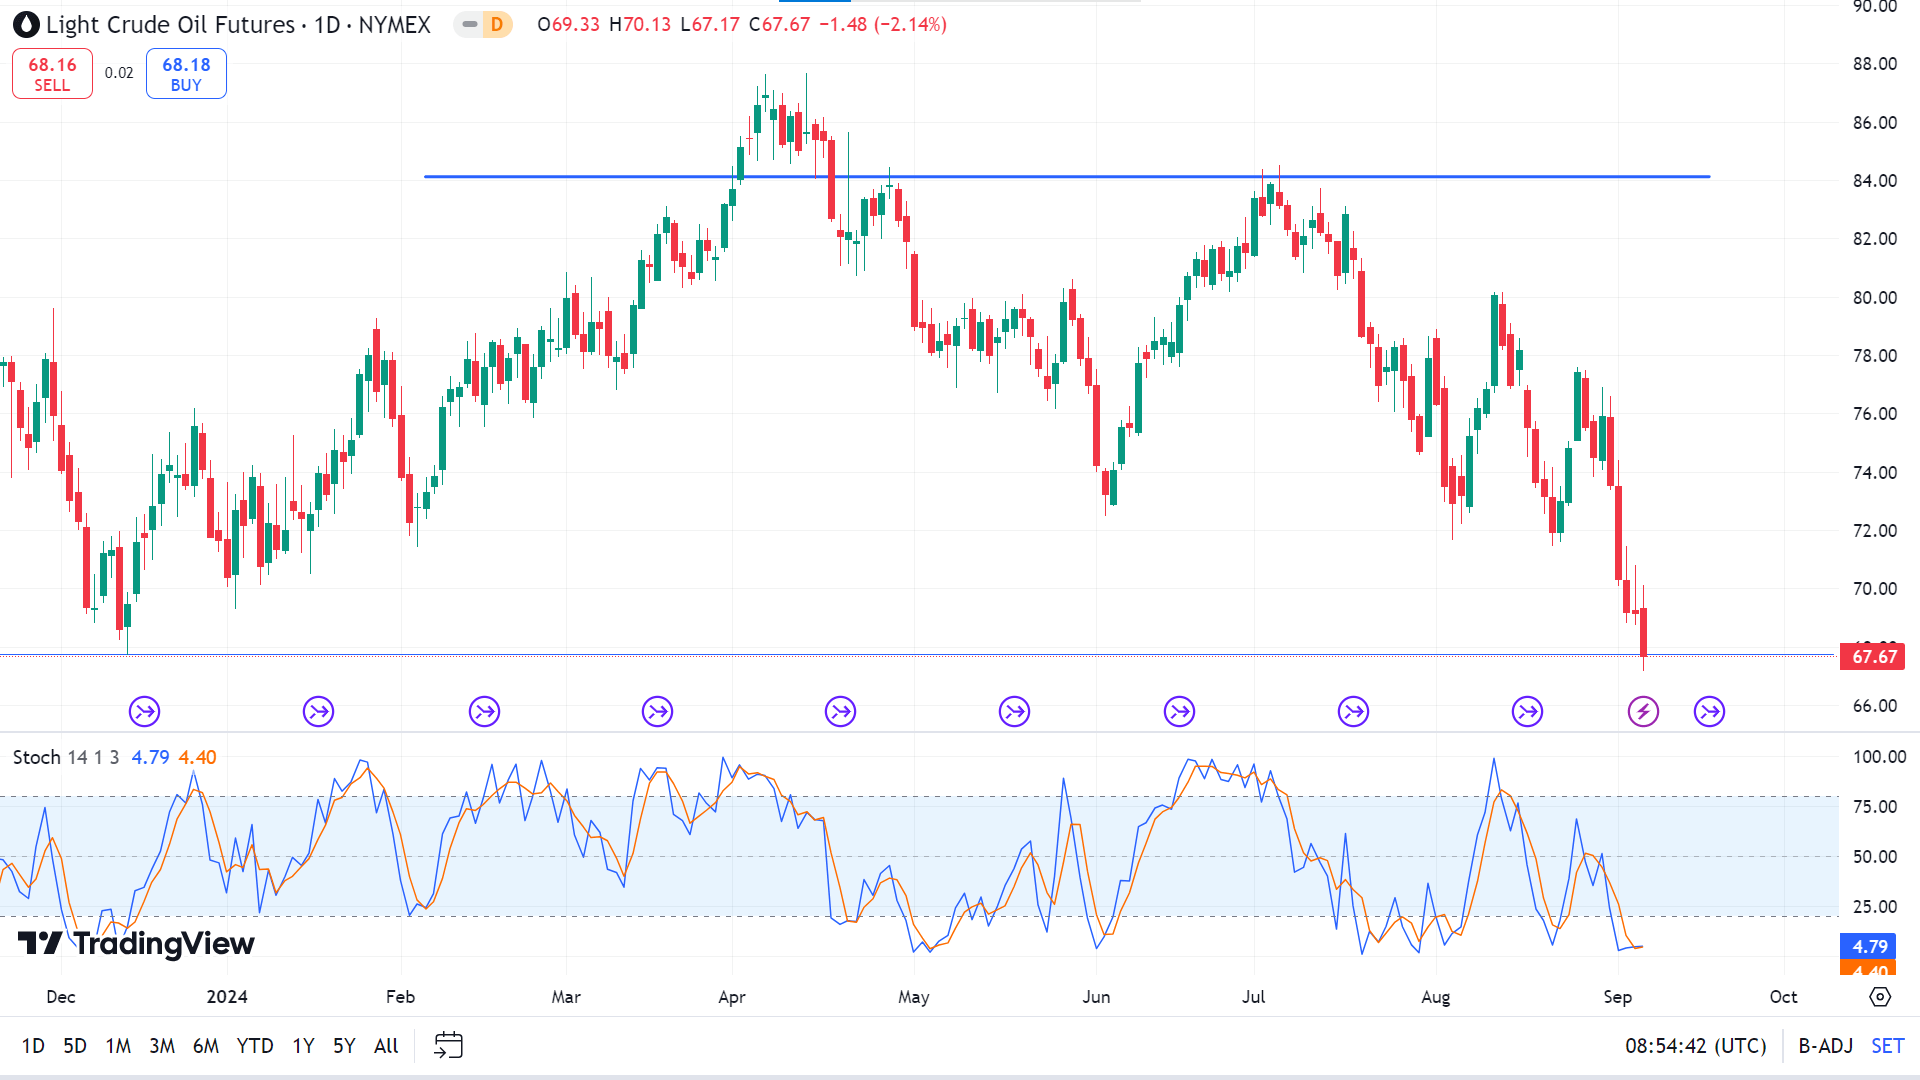
The Stochastic indicator window reflects the concurrent bearish pressure on the asset price, which can lead the price to reach the nearest support near 65.79, followed by the next support near 61.68.
Meanwhile, the Stochastic signal lines below the lower line of the indicator window reflect oversold conditions and a potential reversal, which may lead the price toward the nearest resistance near 72.30. A breakout might trigger the price toward the next resistance near 76.88.


