
EURUSD
Fundamental Perspective
The EURUSD pair failed to surpass the 1.1200 mark, descending into a corrective phase that saw it close the week just above the 1.1053 low. Initially under pressure, the US Dollar rebounded midweek as market sentiment soured, driven by stronger-than-expected economic data. The US economy reported a 3% annualized GDP growth for the second quarter, exceeding the 2.8% forecast, while unemployment claims were slightly lower than anticipated. The Personal Consumption Expenditures (PCE) Price Index also held steady, further solidifying confidence in the US economic outlook.
However, despite the encouraging data, speculation about the Federal Reserve's upcoming interest rate decision remains unresolved. Market participants are uncertain whether the Fed will opt for a 25—or 50 basis point cut in September, though a rate cut is largely anticipated.
In the Eurozone, inflation data bolstered expectations of a European Central Bank (ECB) rate cut. Germany's Consumer Price Index (CPI) increased by 1.9% year-on-year, below predictions, while the broader Eurozone Harmonized Index of Consumer Prices (HICP) aligned with forecasts, supporting the ECB's cautious monetary stance ahead of its September meeting.
Technical Perspective
The last weekly candle closed as a solid red candle after reaching near a critical resistance level, indicating a bearish continuation.
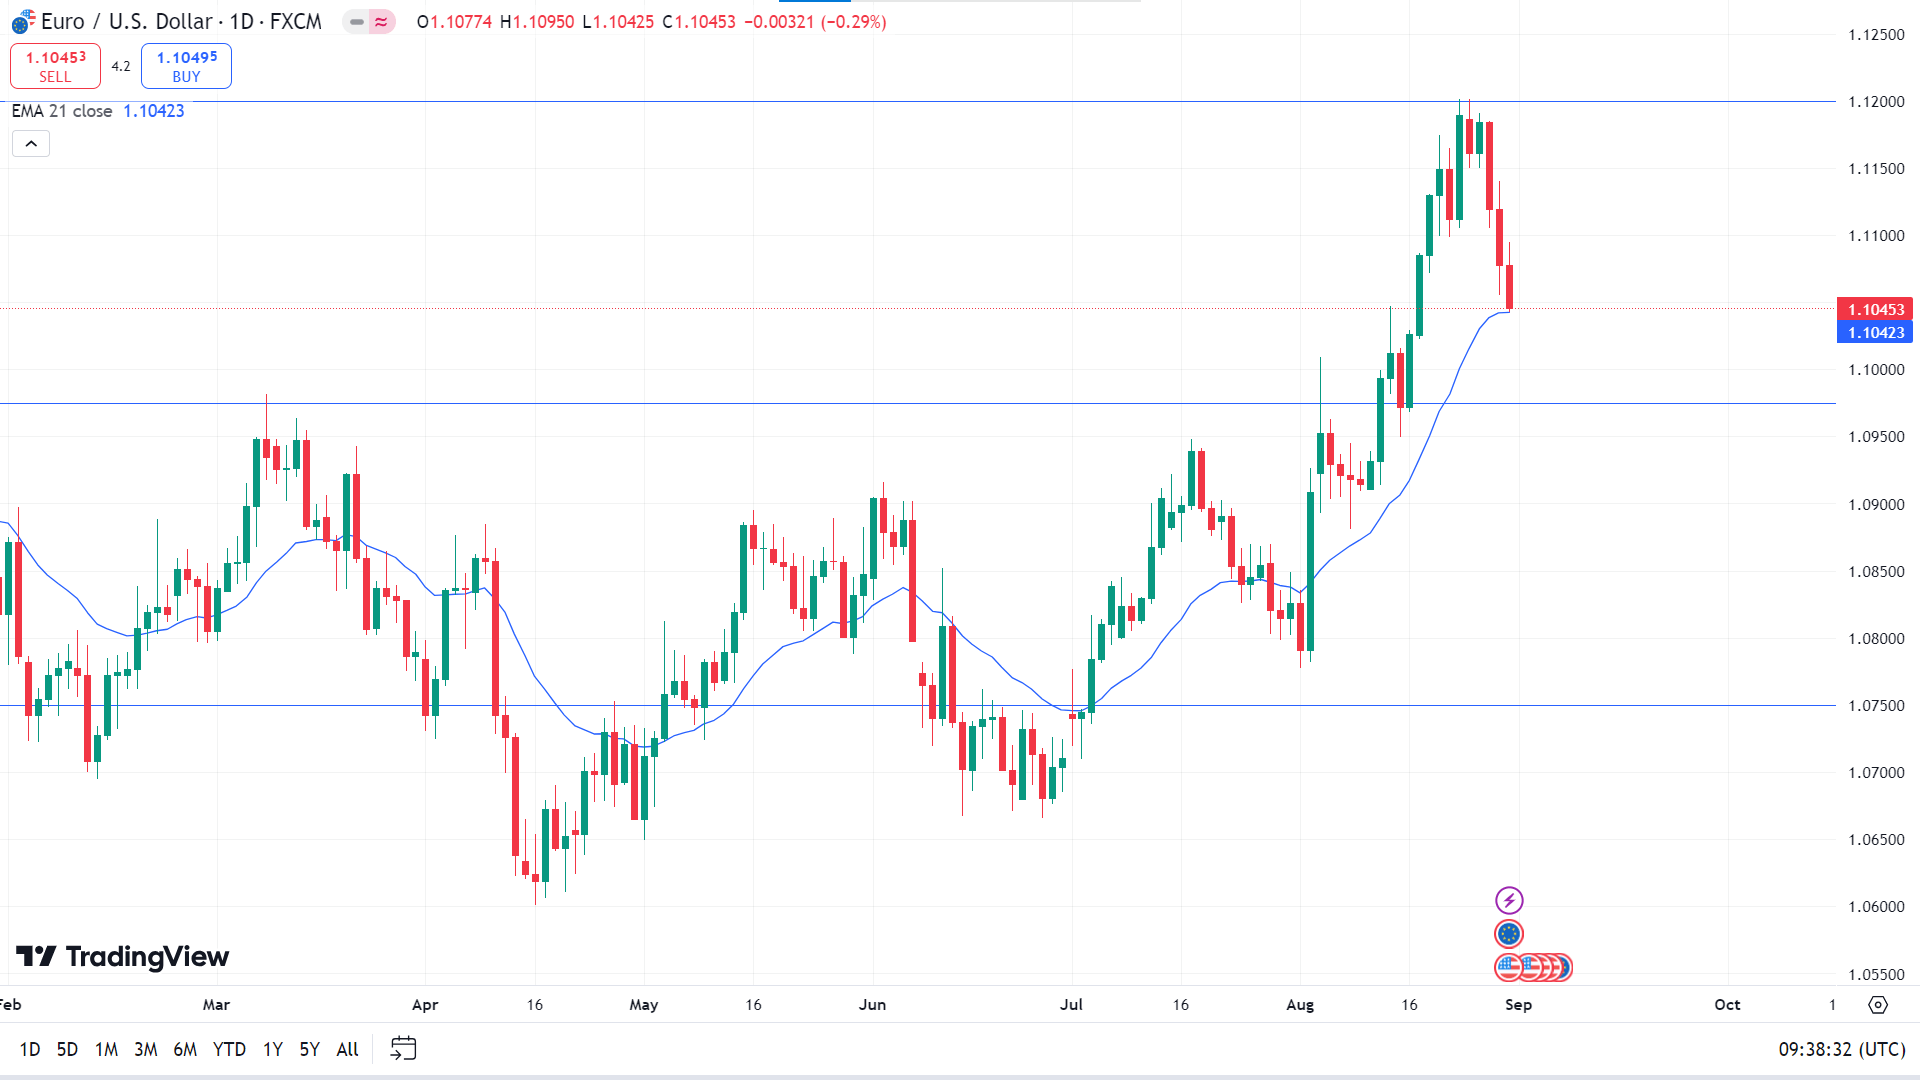
On the daily chart, the price reaches the EMA 21 line, reflecting the recent bearish pressure. If the bearish pressure sustains and the price keeps declining below the EMA 21 line, it can reach the nearest support near 1.0975, followed by the next support near 1.0750.
Meanwhile, if the price bounces back from the EMA 21 line due to significant bullish pressure, it may hit the nearest resistance of 1.1200, and a breakout may trigger the price to reach the next resistance near 1.1470.
GBPJPY
Fundamental Perspective
According to the Statistics Bureau of Japan, Japan's Tokyo CPI for July, excluding fresh food, rose to 2.4%, surpassing the previous month's 2.2% and beating expectations of 2.2%. This uptick signals a possible increase in inflation, which could prompt the Bank of Japan (BoJ) to continue its course of interest rate hikes, potentially bolstering the Yen.
However, the simultaneous release of employment data showed a less favorable trend, with Japan's Unemployment Rate unexpectedly increasing to 2.7% in July from 2.5% in June. Despite this setback, analysts at Capital Economics remain confident in the BoJ's resolve, expressing growing conviction that the bank will proceed with another rate hike.
Meanwhile, the UK's economic calendar is relatively quiet, with the final S&P Global Manufacturing PMI being the only major release on Monday. GBP/JPY traders will likely focus on central bank policy outlooks and any geopolitical events that may sway market sentiment.
Technical Perspective
The last weekly candle closed green after a doji, and a solid green candle reflects bullish pressure on the asset price, leaving optimism for buyers.
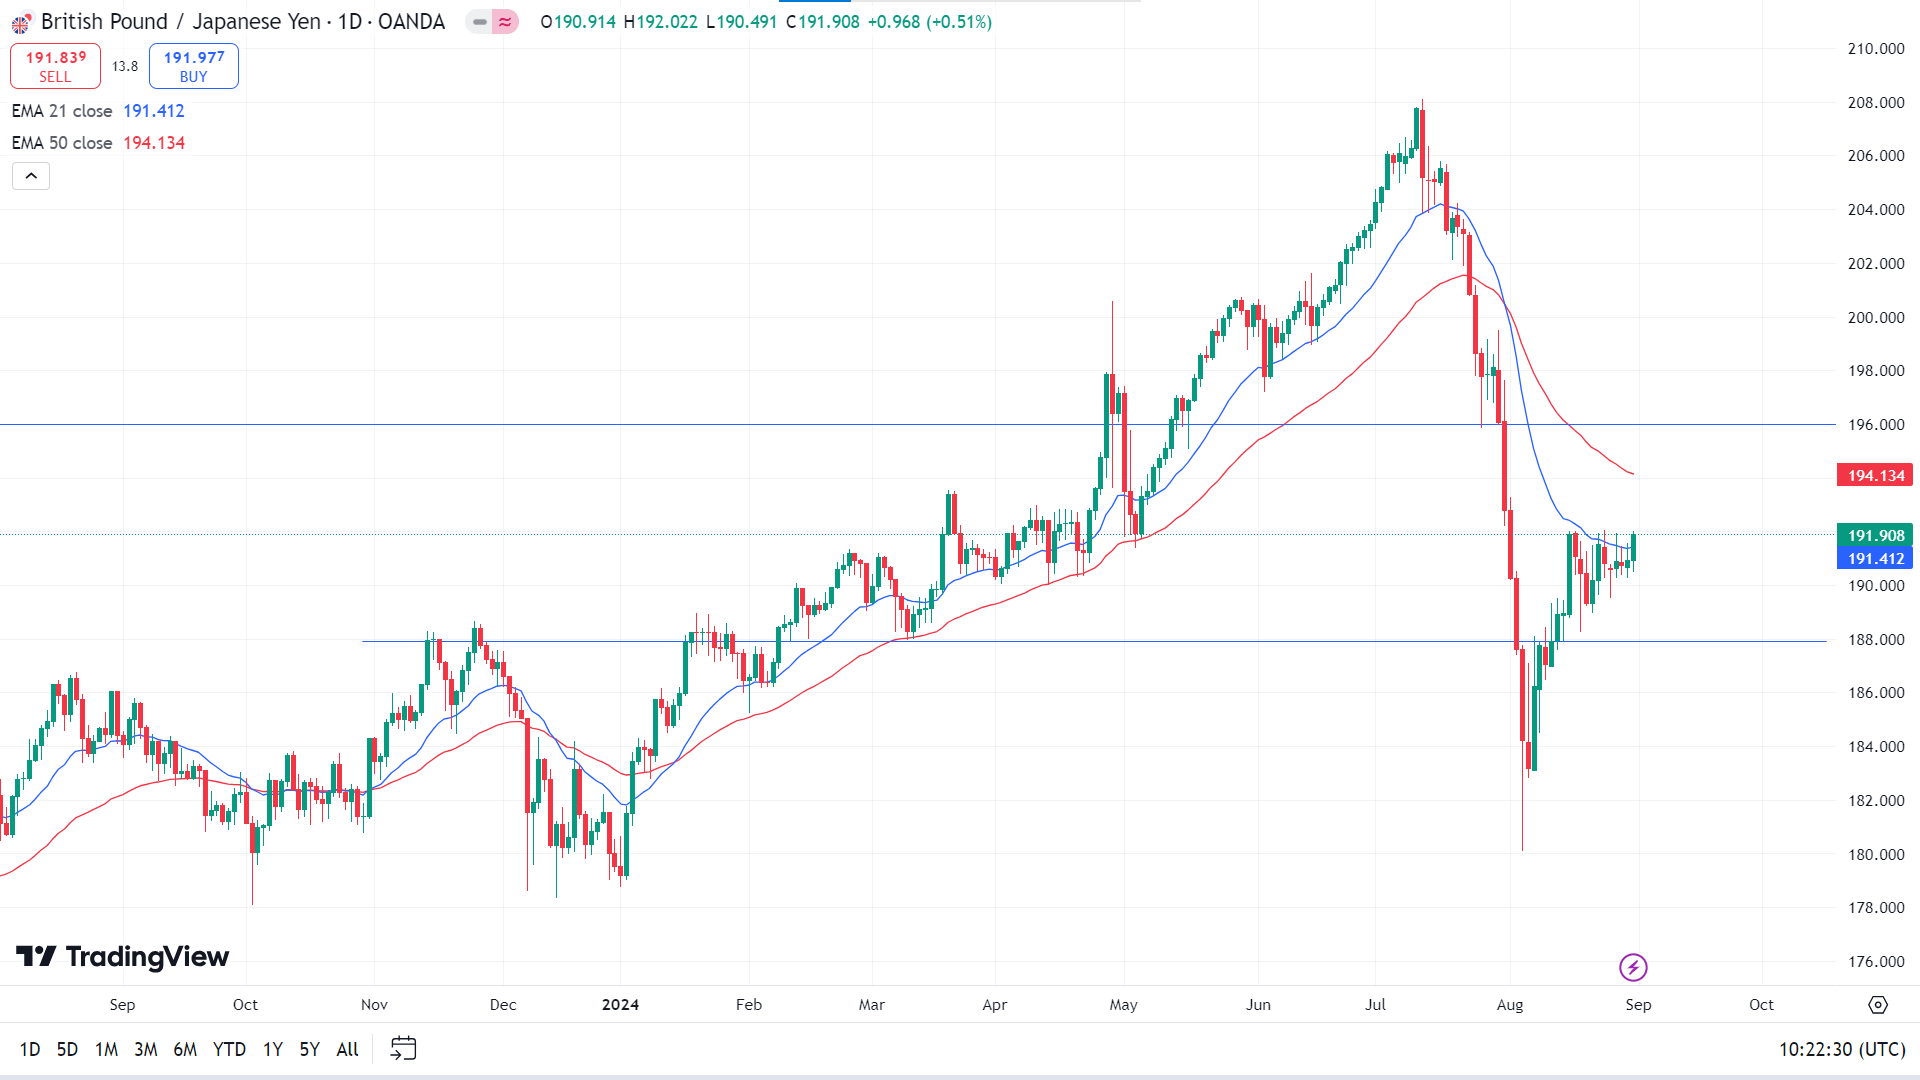
The price is floating between the EMA 21 and EMA 50 lines, leaving mixed signals for traders. The price reaches above the EMA 21 line, signaling recent bullish pressure. If it moves upward and above the EMA 50, it can get the primary resistance near 196.00, followed by the next resistance near 200.75.
Meanwhile, on the bearish side, if the price declines again below the EMA 21 line, it can find a support at the 187.90 level, followed by the next support near 183.07.
NASDAQ 100 (NAS100)
Fundamental Perspective
Global stocks rose on Friday, marking a fourth consecutive month of gains despite a steep sell-off in early August. U.S. economic data fueled this recovery, which aided the dollar's recovery from a prolonged decline.
The Commerce Department reported that the U.S. personal consumption expenditures (PCE) price index, the Federal Reserve's preferred inflation gauge, increased by 0.2% in July. Additionally, consumer spending, which drives over two-thirds of the U.S. economy, rose by 0.5% last month. These figures suggest the Fed may begin easing monetary policy in September.
The robust market rebound from the August downturn, reminiscent of the 1987 "Black Monday" crash, was driven by a "Goldilocks" scenario in which the U.S. economy continues to grow steadily but not at a pace that would deter interest rate cuts. As a result, money markets are now anticipating a 25 basis point rate cut at the Fed's upcoming September meeting, with a 33% chance of a more significant 50 bp cut.
In early August, government bonds rallied after weaker-than-expected U.S. jobs data and a surprise rate hike by the Bank of Japan disrupted currency markets and sparked a sell-off in riskier assets.
Technical Perspective
The last weekly candle closed as a hammer with a small red body and a lower wick after three consecutive gaining weeks. This pause in the bullish trend left buyers optimistic for the upcoming week.
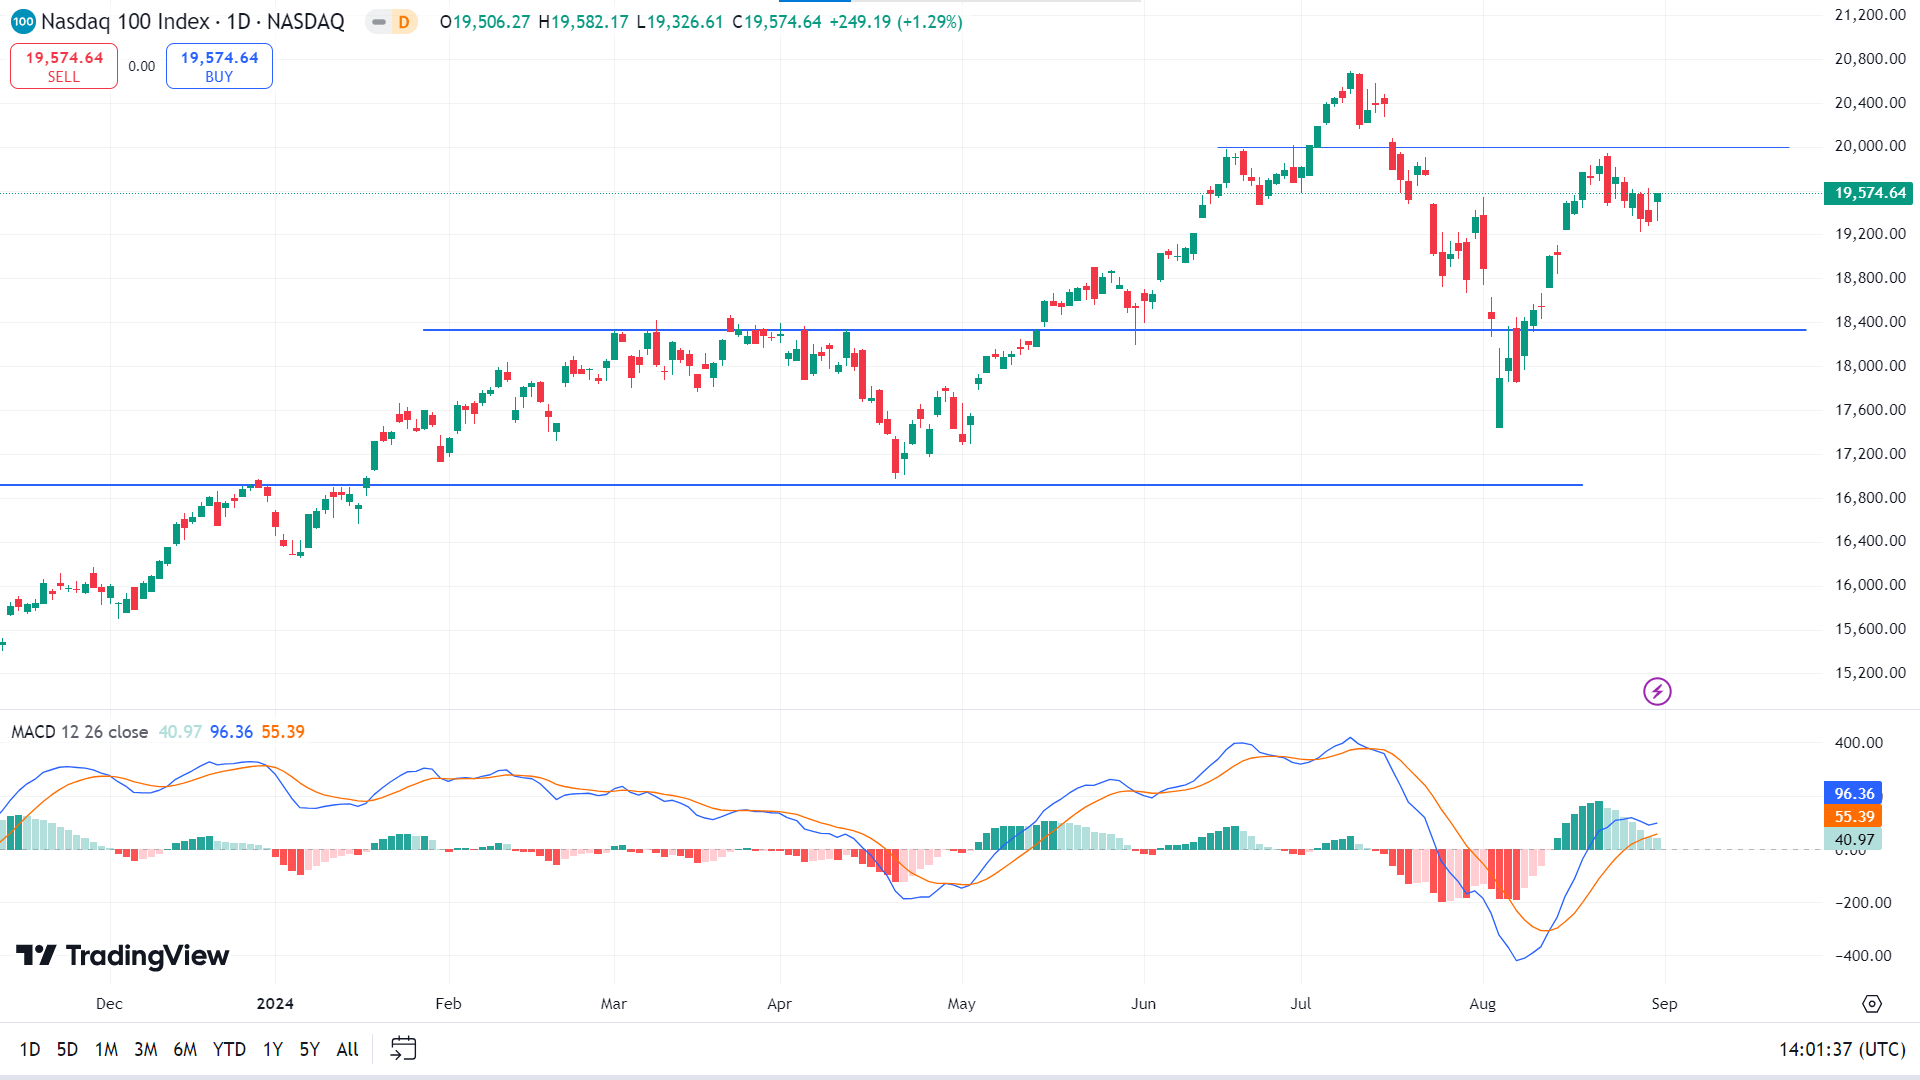
The price is moving in an uptrend in the daily chart, as the MACD indicator window shows through dynamic signal lines and green histogram bars above the midline. According to the indicator's suggestion, the price might hit the nearest resistance near 20,000.50, followed by the next resistance near 20,824.21.
However, the green histogram bars are fading due to a lack of bullish pressure, which may cause the price to retrace toward the recent support level near 18,883.06, followed by the next support near 18,330.00.
S&P 500 (SPX500)
Fundamental Perspective
The Nasdaq and S&P 500 finished Friday positively, with Tesla and Amazon leading gains after U.S. economic data bolstered expectations for a modest Federal Reserve interest rate cut in September. July's consumer spending data showed solid growth, suggesting the economy remains strong while inflation rose moderately.
Broadcom and Marvell Technology also saw significant advances, with Marvell exceeding quarterly earnings forecasts. Friday's personal consumption expenditures report, the last major economic release before the Fed's September meeting, further solidified the likelihood of a 25-basis-point rate cut. As a result, the chances of a more considerable 50-basis-point reduction have diminished, aligning with traders' expectations, according to the FedWatch Tool from CME Group.
Technical Perspective
The last weekly candle closed as a hammer with a small green body and a lower wick. It posted four consecutive gaining weeks, leaving buyers optimistic for the next week.
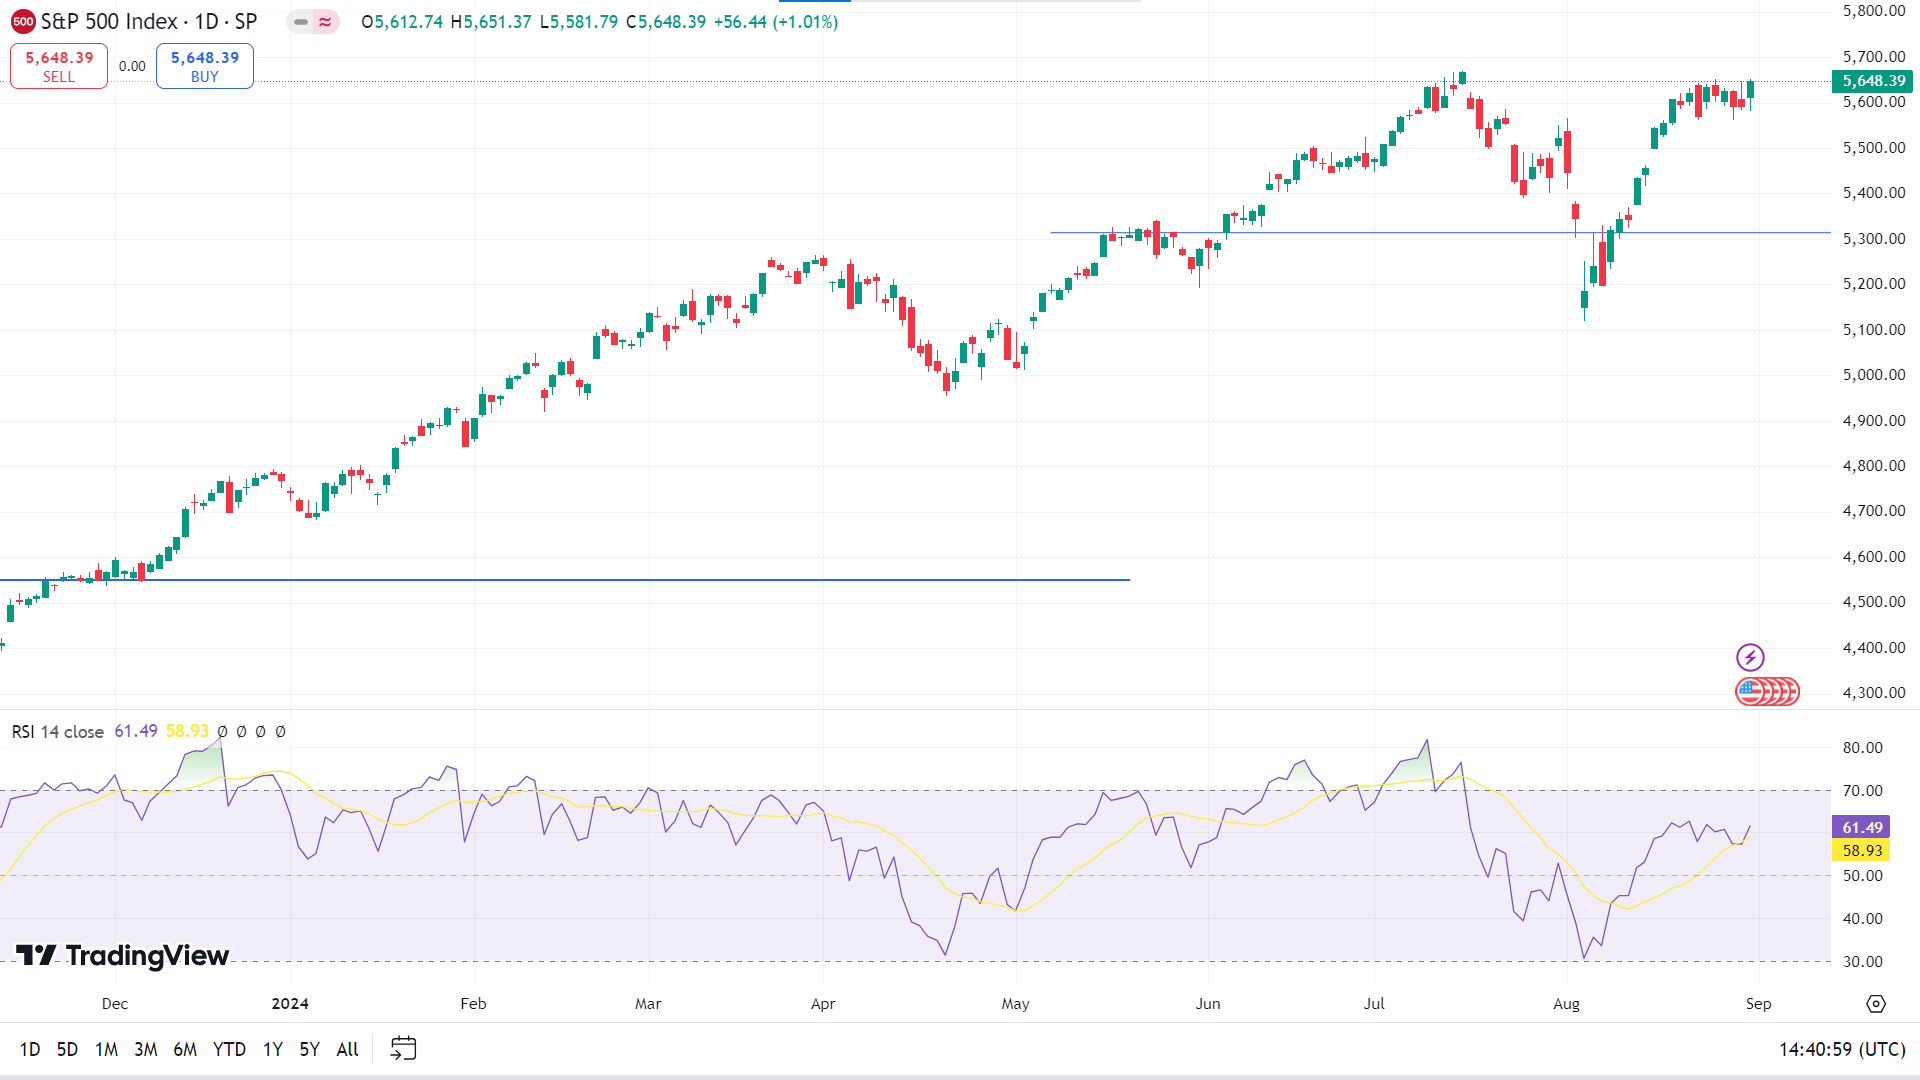
The daily chart's price is floating below the previous ATH of 5,699.89. If the S&P 500 price exceeds the ATH, the bullish pressure can drive the price to hit the next resistance near 5,806.36.
Meanwhile, if the previous pick sustains, the price can retrace toward the primary support of 5,500.66, followed by the next support near 5313.81.
Gold (XAUUSD)
Fundamental Perspective
Gold (XAU/USD) briefly dipped below $2,500 early in the week due to a stronger US Dollar (USD) but managed to recover and stabilize above this critical level ahead of important upcoming US economic data. Yellow metal initially gained modestly after dovish comments from Fed Chair Jerome Powell at the Jackson Hole Symposium, but its upside was limited without additional catalysts.
Midweek, the USD regained strength as market sentiment turned cautious ahead of Nvidia's earnings, causing Gold to slip below $2,500. However, it quickly rebounded and closed above this threshold. The USD's recovery was supported by an upward revision of US Q2 GDP growth to 3% and a slight drop in weekly unemployment claims, which helped the currency maintain momentum. Despite these favorable USD conditions, Gold found solid support at the $2,500 level.
In Europe, weak inflation data from Germany led to a weaker Euro, boosting XAU/EUR by over 1%. US inflation data matched expectations as the week closed, leaving Gold trading above $2,500. Investors now focus on upcoming US economic indicators, including the ISM PMI and the August jobs report, which could significantly influence Gold's trajectory.
Technical Perspective
On the weekly chart, XAUUSD posted two consecutive doji candles in different colors, reflecting the consolidation phase, which indicates that the next candle can be either red or green. However, the possibility of a green candle is high as the price has been bullish for many weeks.
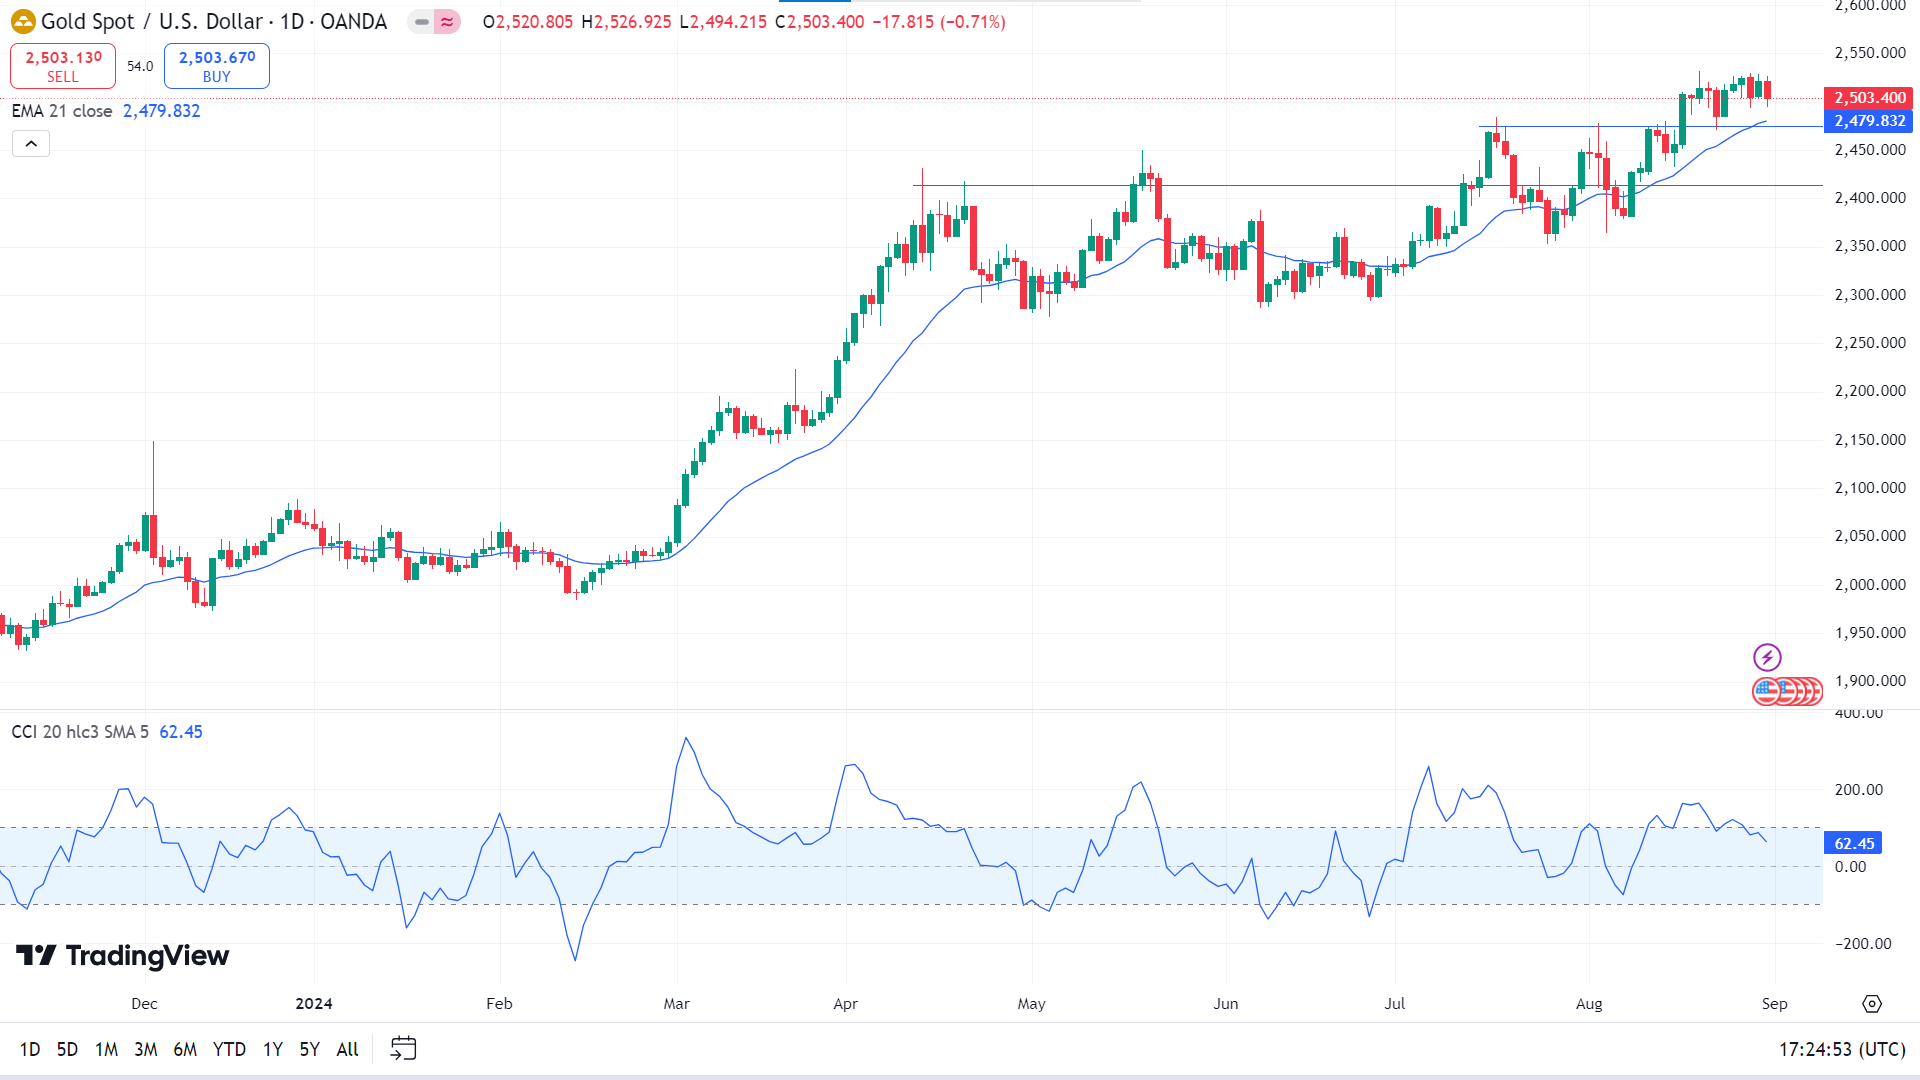
The price is in a solid uptrend in the daily chart, floating above the EMA 21 line. At the same time, the CCI indicator reading remains neutral, with the signal line floating below the upper line on the indicator window. If the price keeps moving above the EMA 21 line, it may regain the ATH near 2,531.79, from where a breakout could take the price towards the next resistance near 2,581.77.
Meanwhile, the dynamic signal line on the CCI indicator window slows downward, indicating significant bearish pressure or a retracement. In that case, it can trigger the price to reach the nearest support, which is 2,479.83. The following support is near 2,413.73.
Bitcoin (BTCUSD)
Fundamental Perspective
On Friday, Bitcoin (BTC) dipped below $60,000 as investors engaged in profit-taking, according to a CryptoQuant report. The cryptocurrency now hovers around $58,800, following a week of selling after a brief rally last Saturday, pushing Bitcoin above $64,000 amid speculation about potential interest rate cuts by the Federal Reserve.
Despite this selling wave, realized profits were relatively small, totalling $536 million—significantly less than the $10 billion and $9 billion seen on May 27 and March 12, respectively, indicating that the market may not have peaked in this cycle. However, according to data from Coingecko, BTC prices still saw a weekly loss of 6.8%.
A significant factor contributing to Bitcoin's price decline is the sustained decrease in demand growth, which has plunged since April. In the past month, 30-day demand growth for Bitcoin dropped from a three-year high of 496,000 BTC in early April to a decline of 36,000 BTC.
On a brighter note, there are signs of renewed interest from US investors, with the Coinbase exchange premium hitting a one-month high. Additionally, CCData reports a rise in Bitcoin options open interest by 32.5%, with a low put/call ratio, reflecting optimism for a potential rally. Many investors are now eyeing a $100,000 price target, anticipating favorable conditions should the Fed cut rates in September.
Technical Perspective
The last weekly candle closed solid red after a green candle, losing most of the gain from the previous weeks, indicating sellers may back and the next candle might be another red one.
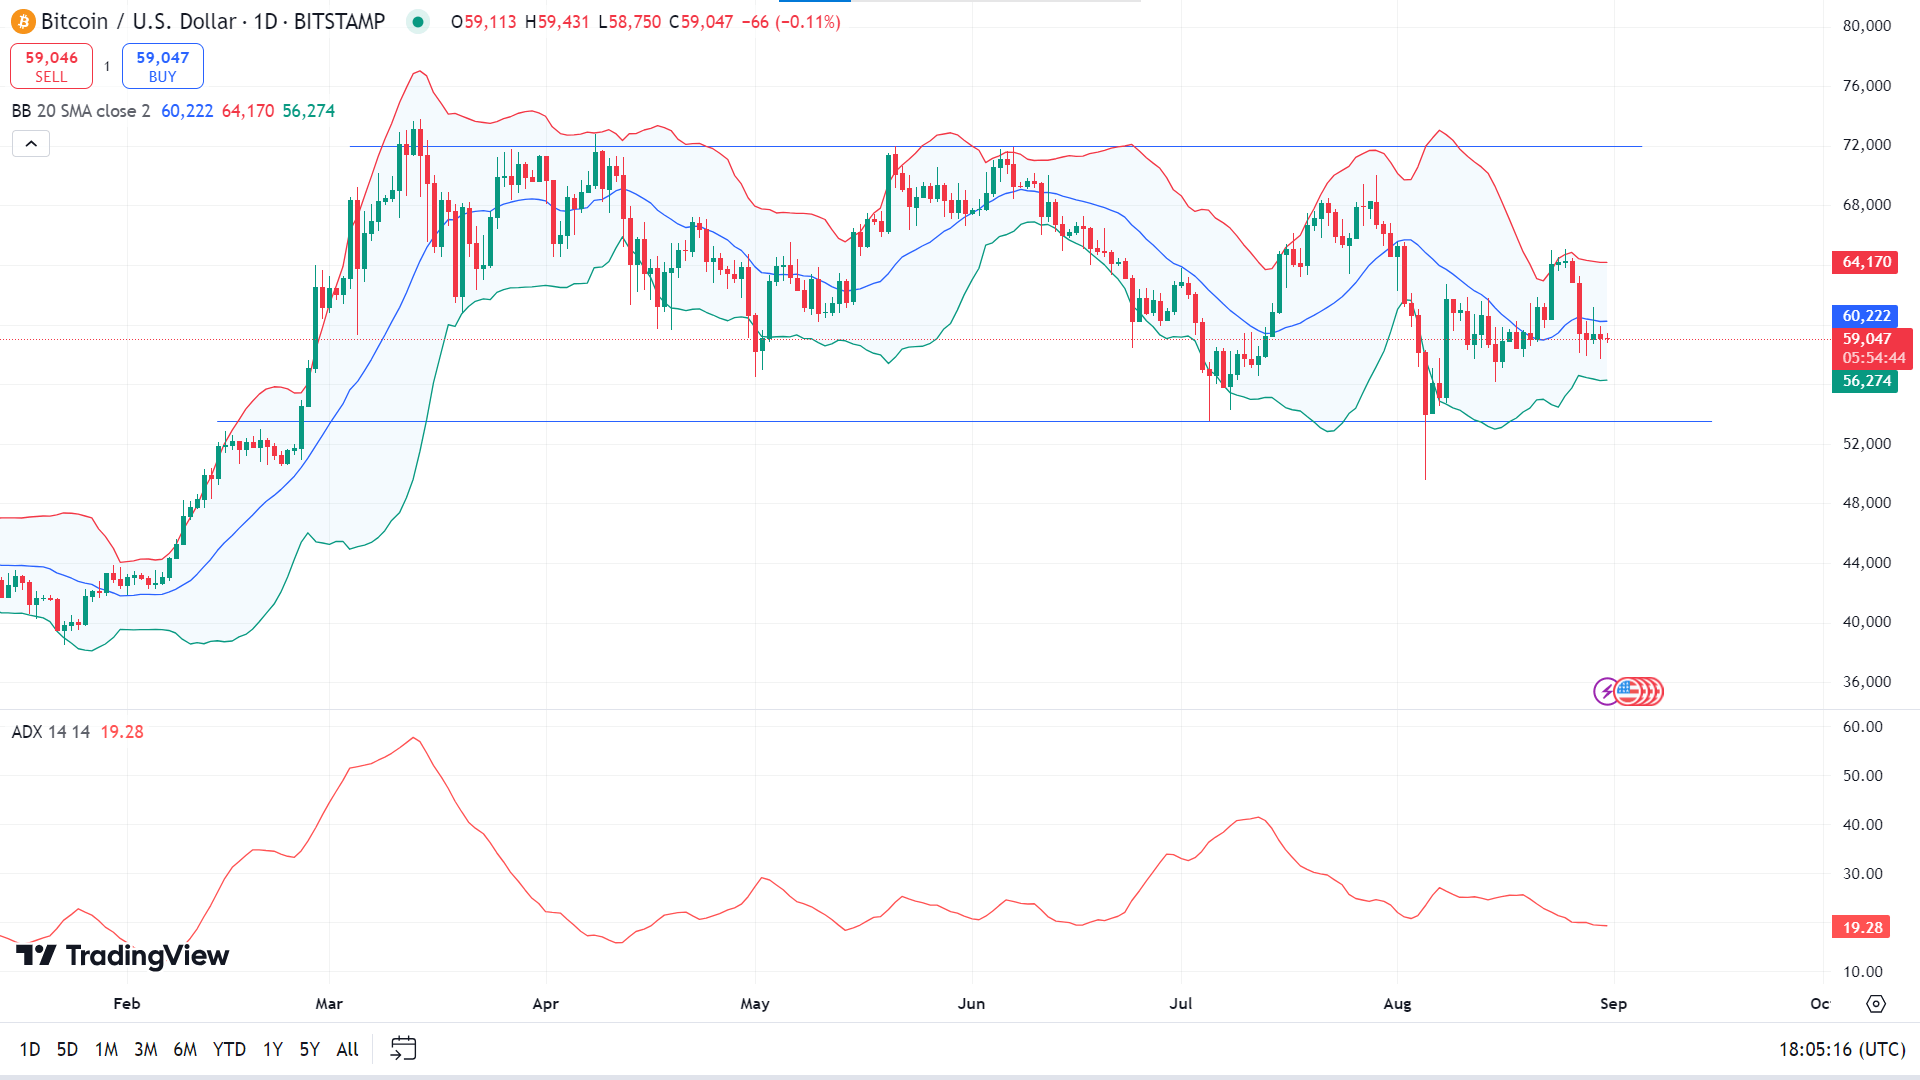
On the daily chart, the price is in the lower channel of the Bollinger Band indicator, indicating sellers' domination of the asset price, while the ADX indicator reading remains neutral. The price might continue to decline the nearest support following the bearish pressure, near 5,6274, and the next support is near 53,550.
Meanwhile, the ADX value below 25 indicates the current trend may be losing power and a possible reversal. So, the price can reach above the middle band of the Bollinger Bands indicator and hit the nearest resistance near 64,170, followed by the next resistance near 68,352.
Ethereum (ETHUSD)
Fundamental Perspective
Since the beginning of August, Ethereum (ETH) has traded between $2,300 and $2,800, struggling to break through the $2,600 barrier in recent days. This lackluster performance has raised concerns among analysts and investors, especially when contrasted with Bitcoin's more robust gains this year.
Critical insights from Farside Investors reveal a declining interest in Ethereum ETFs, further contributing to the cautious sentiment around ETH. This trend could reflect deeper concerns about Ethereum's future performance. With ETH encountering persistent resistance at $2,600, the market remains uncertain about its potential to advance. The upcoming days will be pivotal in determining whether Ethereum can regain momentum or continue underperforming compared to its peers.
The anticipated launch of Ethereum ETFs quickly turned into a “sell the news” event, with these financial products underperforming since their introduction. Inflows and outflows have been nearly zero, indicating a lack of sustained investor engagement. Additionally, Bloomberg data shared by Galaxy Research highlights that Ethereum ETFs are trading at much lower volumes than Bitcoin ETFs despite Ethereum's significant market presence. This underperformance underscores a shift in investor preference toward Bitcoin and other alternatives like Solana, raising questions about the long-term appeal of Ethereum ETFs in a competitive market.
Technical Perspective
The last weekly candle ended in solid red, declaring sellers' domination on the asset price and leaving sellers optimistic for the next week.
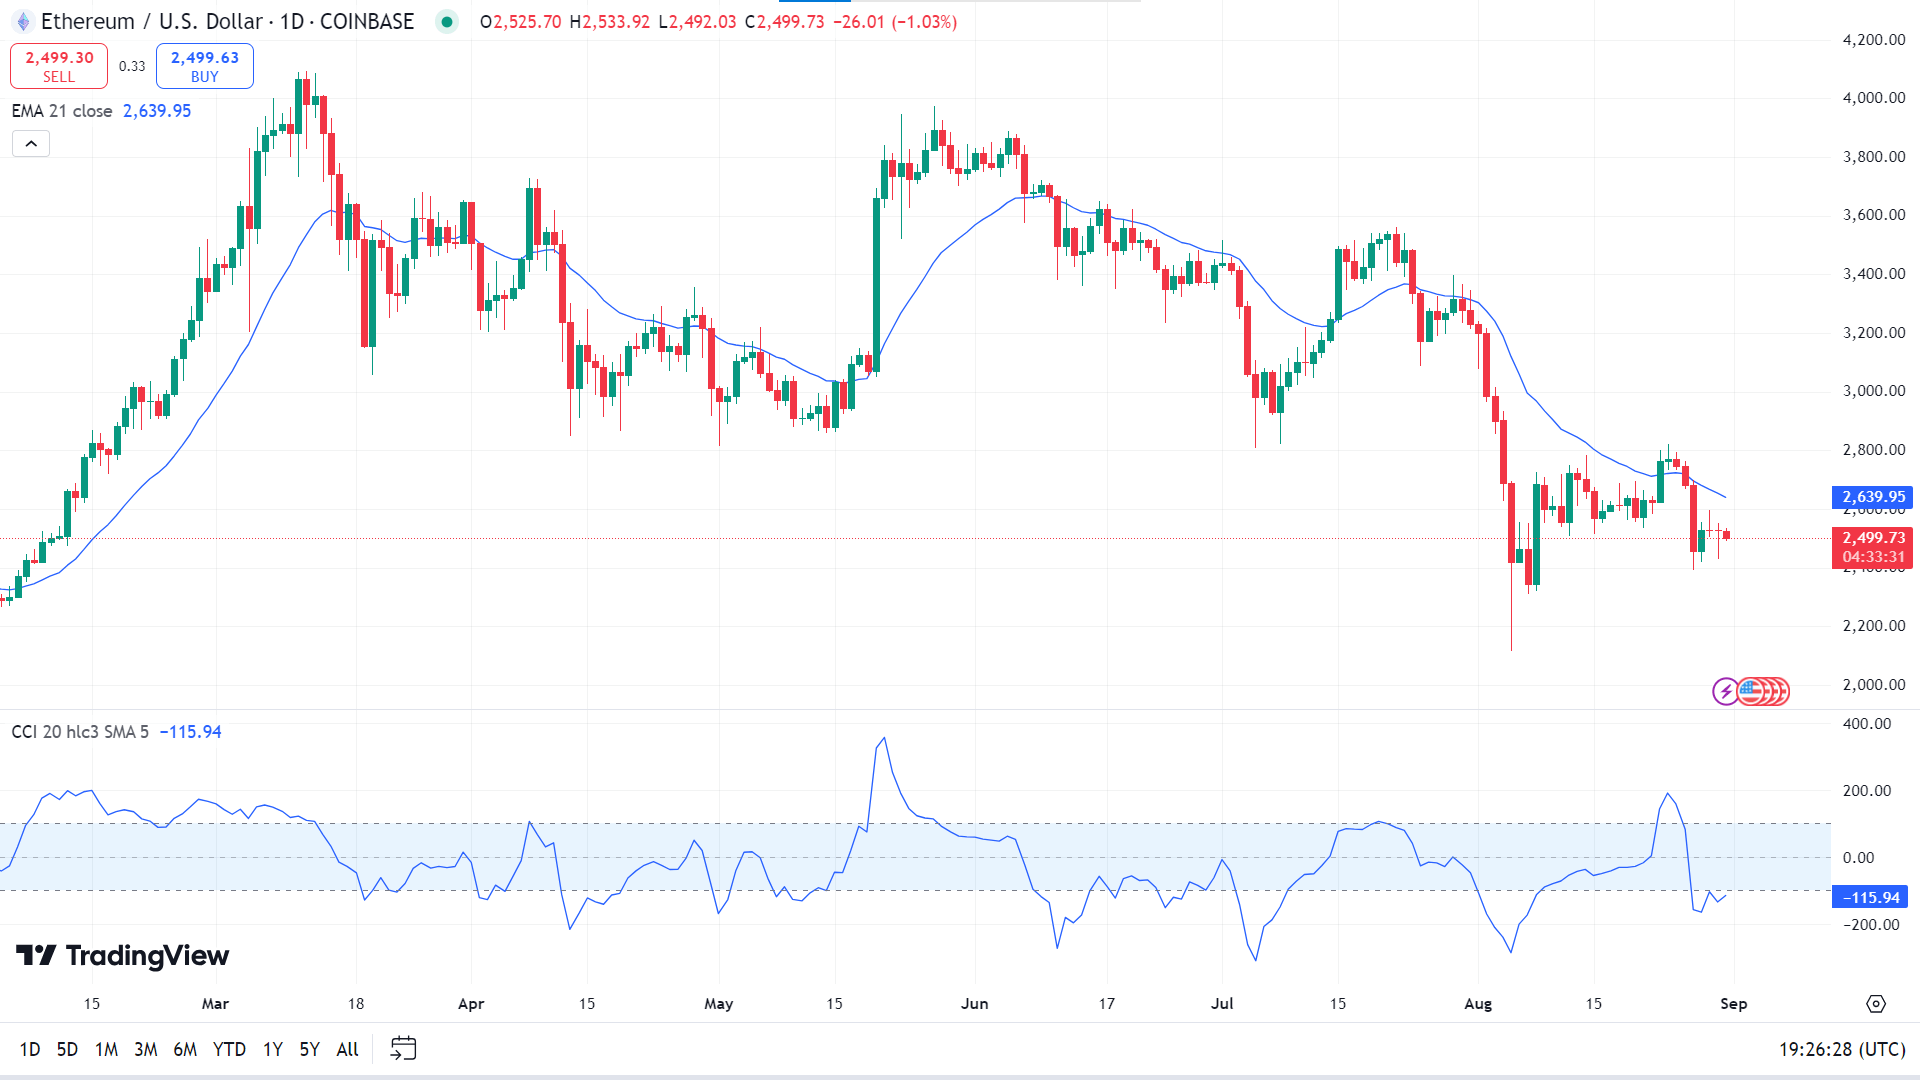
The daily chart gives mixed signals when using the EMA 21 line and CCI indicator. The price below the EMA 21 line declares bearish pressure on the asset price, while the CCI signal line reflects fresh bullish pressure edging upside. If the price keeps floating below the EMA 21 line and the CCI signal line slopes downward, it will indicate the price may head to retouch the support near 2,400.87, followed by the next support near 2,116.02.
Meanwhile, if the CCI signal line keeps sloping upwards, it can reach the primary resistance near 2,639.95. In contrast, a successful breakout can trigger the price to hit the next resistance near 2,873.88.
Nvidia Stock (NVDA)
Fundamental Perspective
Nvidia investors should concentrate on the long-term potential of the AI market and the company's next-generation GPU rather than reacting to short-term stock volatility linked to recent earnings. While Apple and Microsoft posted modest year-over-year revenue growth of 5% and 15%, respectively, Nvidia's performance has been exceptional. In its fiscal second quarter, it saw a 122% revenue increase to $30 billion, largely due to a 154% rise in its data-center business driven by AI demand.
In addition to these strong results, Nvidia exceeded Wall Street expectations with its outlook for the current quarter and announced a significant $50 billion stock buyback program. Although the stock dipped by up to 6% in after-hours trading, such concerns seem misplaced given the promising developments ahead, particularly with the forthcoming Blackwell GPU. This new GPU is expected to drive substantial growth next year, with Nvidia's CEO, Jensen Huang, highlighting its game-changing potential for the industry.
Nvidia CEO Jensen Huang emphasized Blackwell's transformative potential, projecting substantial growth for the data center business. The recent fix to the Blackwell chip design positions Nvidia for a robust production ramp, with the GPU set to outperform current models by up to four times in AI processing. This growth trajectory should be the key focus for investors, as it will likely drive Nvidia's stock in the long term.
Technical Perspective
The last weekly candle closed solid red after three consecutive gaining weeks, reflecting a loss of bullish pressure. This leaves sellers optimistic for the next week.
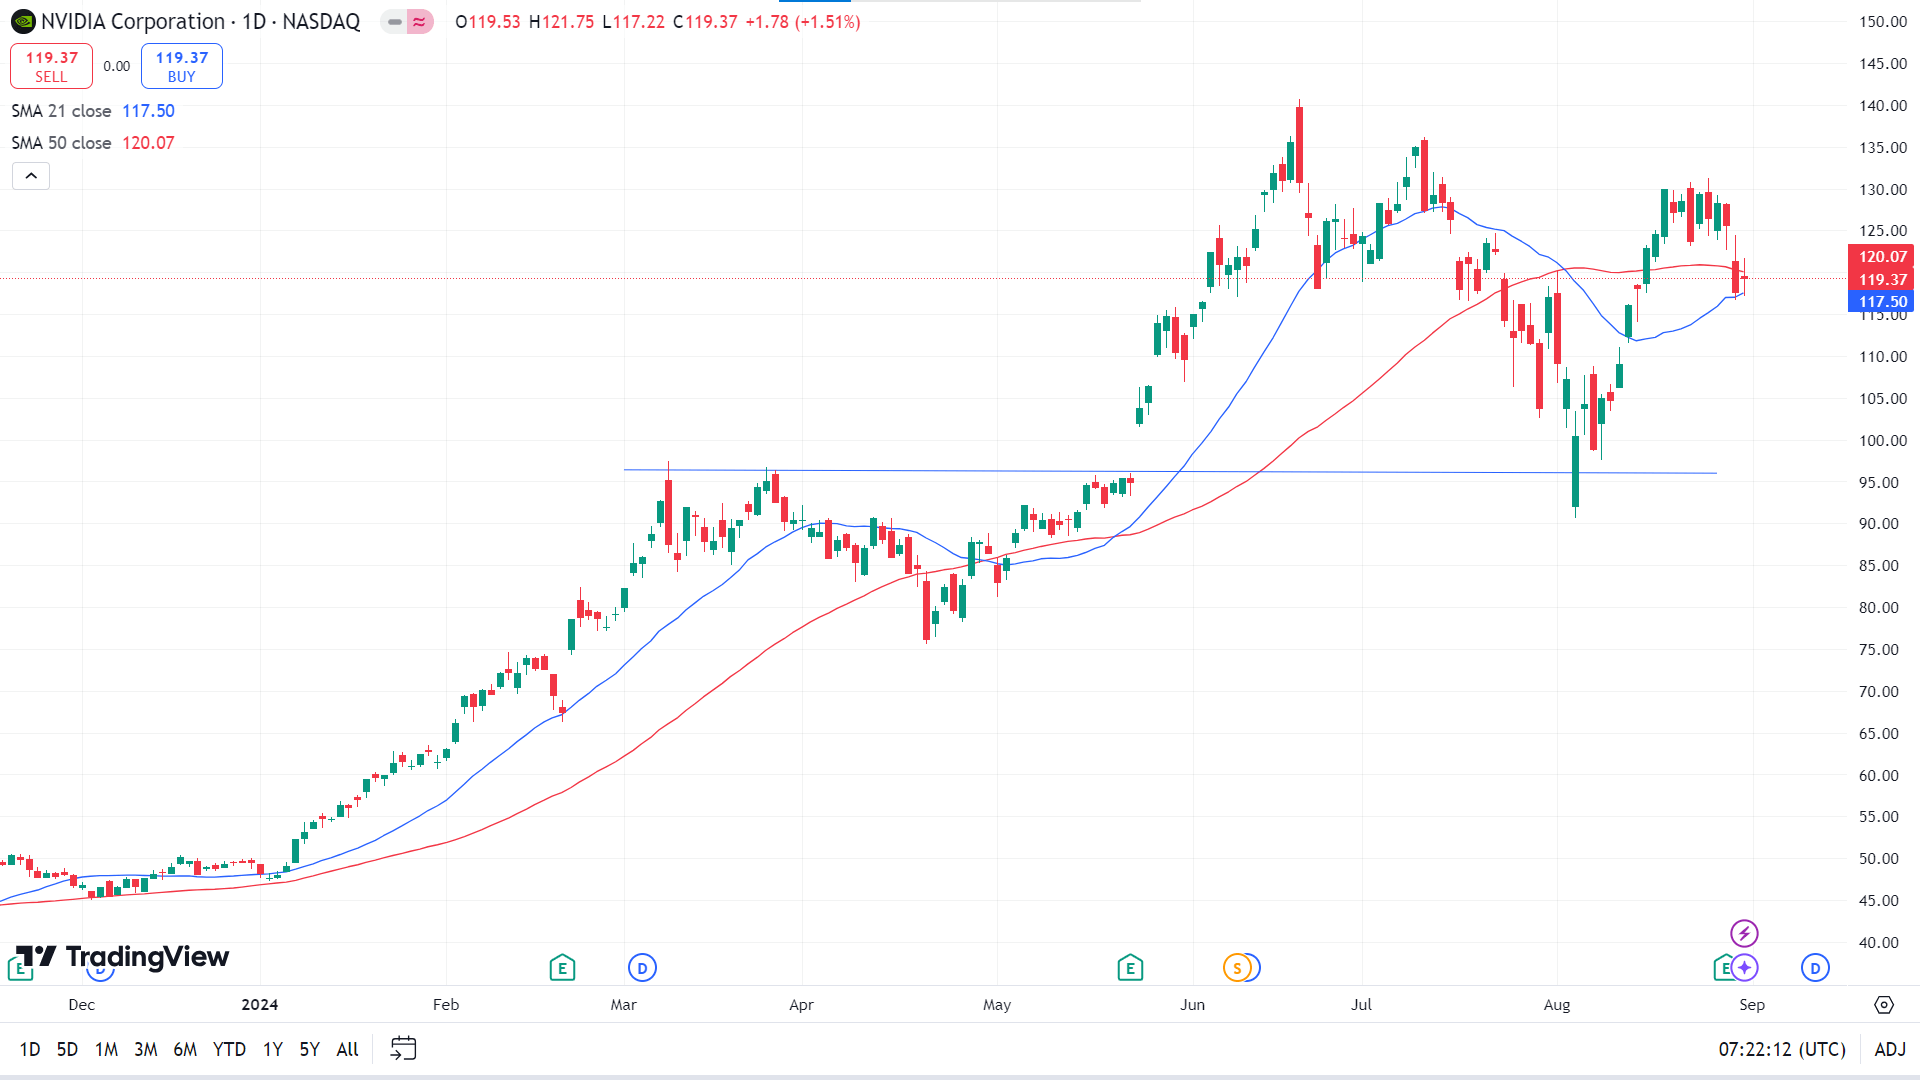
The price floats between the SMA 21 and SMA 50 lines, reflecting a mixed signal, where the SMA 21 line acts as a dynamic support, and the SMA 50 line acts as a dynamic resistance for a short term. If the price exceeds the SMA 50 line, it will indicate significant bullish pressure on the asset price, which can lead the price to hit the primary resistance near 127.01, followed by the next resistance near 135.30.
Meanwhile, if the price declines below the SMA 21 line, it will open the room to reach the nearest support near 110.19, followed by the next support near 99.05.
Tesla Stock (TSLA)
Fundamental Perspective
Both analysts and investors highly anticipate Tesla's upcoming earnings report. The company is expected to report earnings per share (EPS) of $0.59, marking a 10.61% decline from last year's quarter. Revenue is forecasted at $25.66 billion, reflecting a 9.91% increase year-over-year.
For the entire fiscal year, the consensus estimates suggest an EPS of $2.29 and revenue of $98.53 billion. These figures represent a 26.6% decrease in earnings and a modest 1.82% rise in revenue compared to the previous year.
Investors should consider recent revisions to analyst estimates, as these often reflect shifts in short-term business conditions. Positive adjustments can signal growing optimism about Tesla's performance and profitability.
Tesla's current Forward P/E ratio is 93.14, well above the industry average of 13.28, suggesting it is trading at a significant premium. Additionally, Tesla's PEG ratio is currently 4.31, a metric similar to the P/E ratio but factoring in expected earnings growth. In contrast, the Automotive Domestic industry has an average PEG ratio of 1.34, emphasizing the market's high expectations for Tesla's future growth.
Technical Perspective
The last candle on the weekly chart closed as a hammer with a red body and a lower wick after three consecutive gaining weeks. This suggests buyers may still be interested in the asset; the next candle might be another green one.
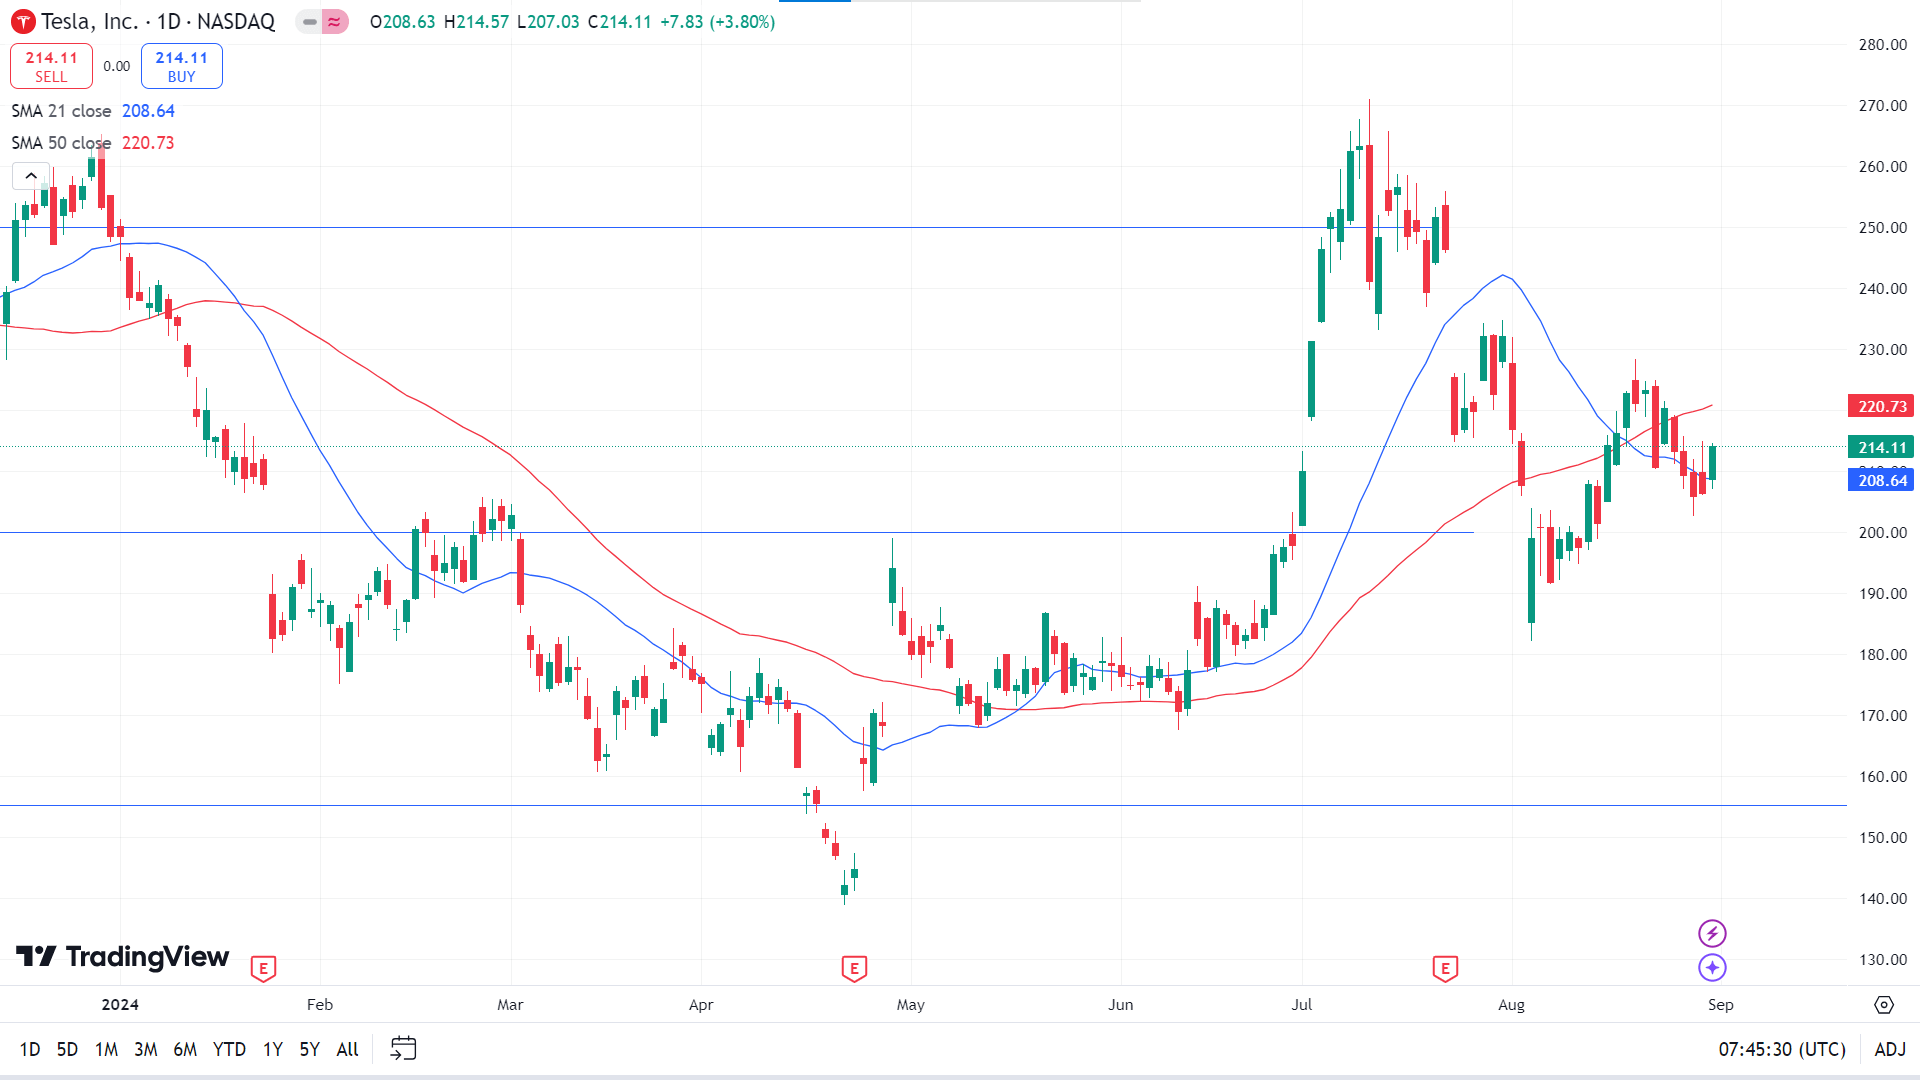
The price is floating between the SMA 21 and SMA 50 lines on the daily chart, where the SMA 21 line acts as dynamic support and the SMA 50 line acts as dynamic resistance. If the price exceeds the SMA 50 line, it can hit the primary resistance near 228.22, followed by the next resistance near 240.70.
Meanwhile, if the price declines below the SMA 21 line, declaring significant bearish pressure on the asset price, it may head toward the nearest support near 202.59, followed by the next support near 191.48.
WTI Crude Oil (USOUSD)
Fundamental Perspective
On Friday, WTI crude futures closed at $73.5 per barrel, which fell by 3.5%, as investors considered the potential for increased OPEC+ supply in October. This decline was further impacted by fading hopes for a significant US interest rate cut next month following strong consumer spending data.
Despite recent production disruptions in Libya, OPEC+ is expected to increase its planned output. US crude inventories are at their lowest since January, with Cushing, Oklahoma stockpiles reaching a low not seen since November.
Oil prices saw their second monthly decline this year, with Morgan Stanley and Goldman Sachs cutting forecasts due to weak demand from China, the world's top importer.
Technical Perspective
The last weekly candle ended as an inverted hammer with a red body and upper wick, posting three consecutive losing weeks, which suggests that the next candle might be another red one.
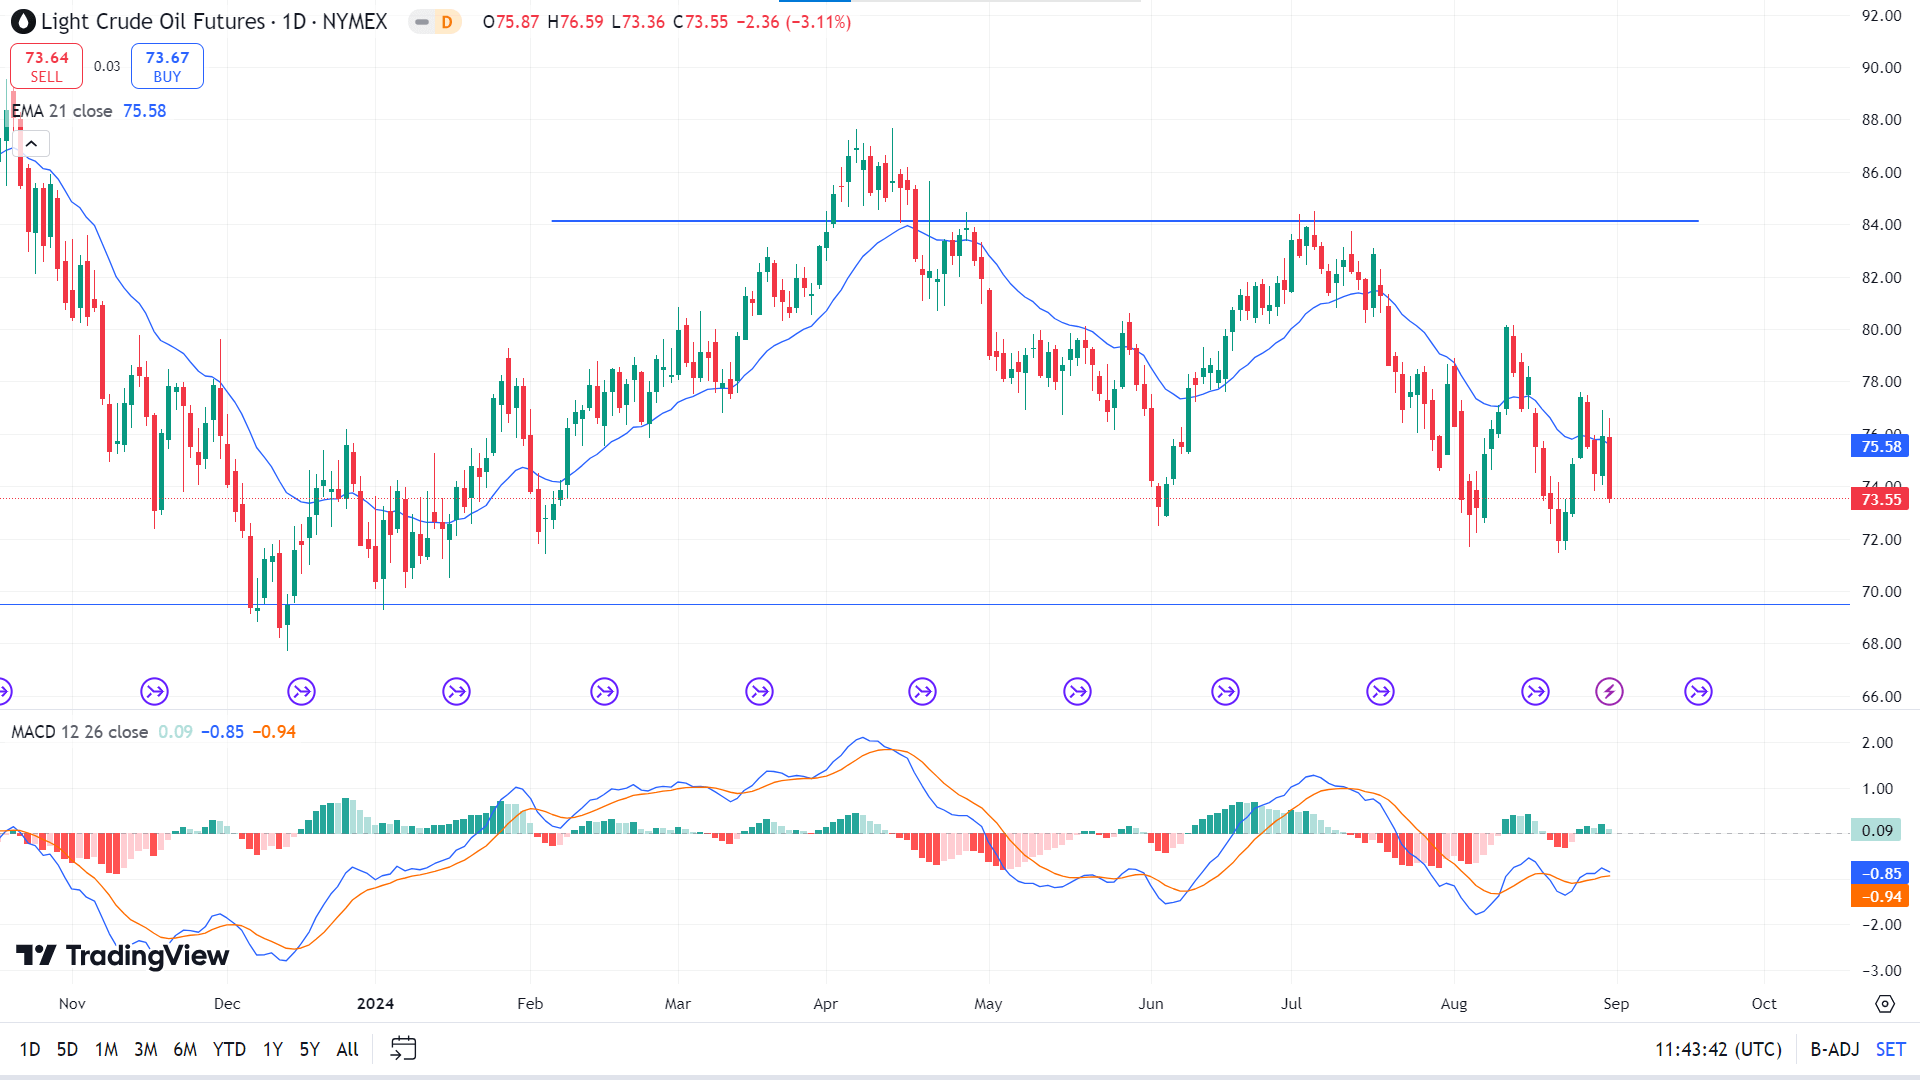
On the daily chart, the price reaches below the EMA 21 line due to the recent bearish pressure, while the MACD indicator window still suggests bullish activity on the asset price. The MACD indicates the price can hit the primary resistance soon, which is near 75.58, followed by the next resistance near 79.84 if the bullish pressure sustains.
Meanwhile, if the bearish domination continues and the price keeps floating below the EMA 21 line, it can reach the nearest support near 71.96, followed by the next support near 69.50.


