
EURUSD
Fundamental Perspective
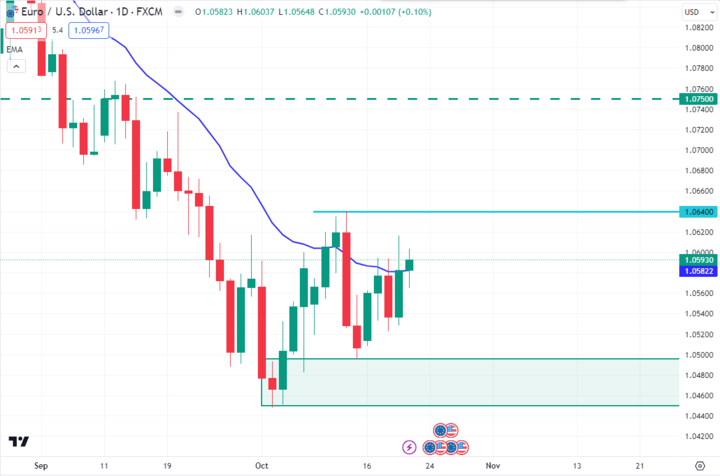
At the commencement of Friday's trading session, the EUR/USD pair initiated near the 1.0593 mark, maintaining a relatively narrow trading range throughout most of the day. It briefly touched an early low of 1.0565 before experiencing a volatile upswing towards the 1.0600 threshold.
The Euro (EUR) exhibited upward momentum on Thursday, reaching 1.0616, primarily in response to dovish remarks made by Federal Reserve (Fed) Chairman Jerome Powell. His comments moderated market expectations regarding the pace of future interest rate cuts. Friday's trading session has been relatively subdued as investors position themselves for the weekend ahead, anticipating next week's dual release of the Purchasing Manager Index (PMI) data for both the European Union and the United States.
Technical Perspective
Source: TradingView
EURUSD is currently trading around the 1.0593 price area and trying to recover higher. After bouncing from the 1.0500 price area, the bulls regained momentum and had a daily close above the dynamic level of 20 EMA. As per the current price action, the price may recover higher towards the 1.0640 price level. So, if the price breaks above the 1.0640 neckline, the bulls may sustain the bullish momentum toward the 1.0750 resistance area in the coming days.
GBPJPY
Fundamental Perspective
The GBP/JPY is poised to conclude the trading week on a positive note, currently hovering around 182.20 following a market-wide upswing in sentiment that has prompted a retreat in safe-haven assets, resulting in a decline in the Japanese Yen (JPY) and providing the British Pound Sterling (GBP) with an opportunity to regain lost ground.
Despite a disappointing release of UK Retail Sales data, which registered at -0.9% for September, a stark contrast to August's 0.4% performance, and falling short of the projected -0.3%, the Pound Sterling initially dropped to 181.30 against the Yen.
Notably, early Friday witnessed the release of the Japanese National Consumer Price Index (CPI) for September, which posted an annualized rate of 3%, slightly lower than the 3.2% figure recorded in August for the same period. However, market response remained muted, as attention has been directed towards the upcoming Tokyo CPI reading, scheduled for the end of September.
Technical Perspective

Source: TradingView
GBPJPY is currently residing inside the range of 182.80 - 181.00 price area. As per the current price action context, if the price can break above the 182.80 resistance level with an impulsive h4 bullish candle close, the bulls may continue higher toward the 183.80 price area in the days ahead.
On the other hand, if the price breaks below the 181.00 support level with an impulsive bearish candle close, the bears may sustain the bearish momentum toward the 179.50 psychological event level in the coming days.
NAS100
Fundamental Perspective
For the week of October 23 to October 27, 2023, the NAS100 index faces a mixed outlook. Recent data on corporate earnings and economic indicators may influence its performance. Tech giants like Apple, Amazon, and Facebook are expected to release quarterly reports, which could sway market sentiment.
Moreover, the ongoing debate about inflation and central bank policies will play a crucial role in the index's direction. Investors are keenly watching the Federal Reserve's stance on interest rates. Additionally, geopolitical events and global economic shifts could impact the NAS100, making it imperative to stay informed and adaptable in the week ahead.
Technical Perspective
Source: TradingView
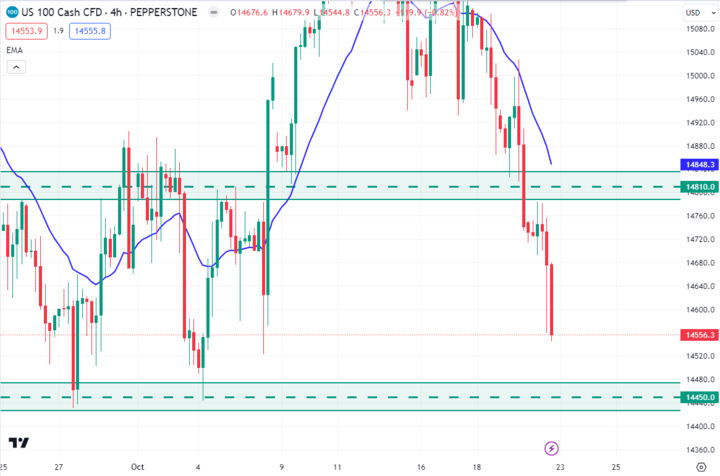
NAS100 broke below the $14810.0 psychological support level and is currently trading around the $14556.3 price area. After rejecting from the dynamic level of 20 EMA, the bears pushed the price down quite impulsively and had a weekly close below the $14810.0 price area. As per the current situation, the bears may sustain the bearish momentum toward the $14450.0 support level.
So, if the price continues toward the $14450.0 support level and rejects with an impulsive H4 bullish candle close, NAS100 may recover higher towards the $14810.0 psychological level in the days ahead.
SP500 (SPX500)
Fundamental Perspective
The SP500 index is set for a dynamic week from October 23 to October 27, 2023. Earnings season will be in full swing, with major companies such as Apple, Amazon, and Microsoft scheduled to report results, influencing investor sentiment. Analysts will closely monitor these earnings releases for insights into corporate health.
The ongoing conversation about inflation and central bank policies will also remain a key driver for the SP500's trajectory. The Federal Reserve's position on interest rates, geopolitical developments, and broader economic shifts will add to the market's volatility. Staying well-informed and agile in response to these dynamic factors is essential for the week ahead.
Technical Perspective

Source: TradingView
SP500 price dropped below the $4322.20 event level and is currently trading around the $4222.47 price area. After rejecting the $4400.00 resistance area, the bears regained momentum and pushed the price downside quite impulsively. As per the current price action, the bears may sustain the bearish momentum toward the $4210.00 support level in the coming days.
So, if the price bounces from the $4210.00 support level with a bullish D1 candle close, bulls may regain momentum and recover higher toward the $4322.20 price area in the days ahead.
HK50
Fundamental Perspective
The HK50 index is poised for an eventful week, spanning October 23 to October 27, 2023. Market dynamics are expected to be influenced by ongoing trade developments and global economic conditions. The Hong Kong market's resilience in the face of external pressures will be closely monitored, focusing on companies exposed to international trade. Geopolitical events, particularly in the Asia-Pacific region, could impact investor sentiment.
Additionally, the People's Bank of China's monetary policies and Hong Kong's regulatory landscape will be interesting. Staying agile and well-informed in response to these dynamic factors will be crucial for navigating the upcoming week's market fluctuations.
Technical Perspective

Source: TradingView
HK50 broke below the $17100.0 significant support level and resided around the $17012.7 price area. As per the current price action, if the price can have another daily bearish candle close below the $17100.0 price level, HK50 may sustain the bearish momentum toward the $16600.0 price area in the days ahead.
On the contrary, if the price has a daily bullish candle close above the $17100.0 price area, the bulls may regain momentum and push the price higher toward the $17600.0 price area in the coming days.
Bitcoin (BTC)
Fundamental Perspective
The approval of a Bitcoin (BTC) spot exchange-traded fund (ETF) can trigger a significant surge in total market capitalization, as stated by the head of research at CryptoQuant. This development could pave the way for the next wave of institutional adoption of BTC. The researcher has projected that approval by the US Securities and Exchange Commission (SEC) for a spot BTC ETF could result in an infusion of up to $155 billion of fresh capital into the BTC market, signifying a new era of institutional adoption in the cryptocurrency market.
This projection is based on an analysis of the historical relationship between the total market capitalization and the realized capitalization of Bitcoin. In the researcher's own words:
"If $150 billion in new funds flows into the Bitcoin market, it could potentially increase BTC's market capitalization by a range of $450 to $900 billion." Nonetheless, the researcher acknowledges that the potential influx of new capital through spot ETFs into the BTC market would surpass the amount of money that flowed into the largest Bitcoin fund during the previous bull market cycle, namely the Grayscale Bitcoin Trust (GBTC) fund.
Technical Perspective

Source: TradingView
BTC price was rejected from the $30200 resistance level and is currently trading around the $29878 price area. As per the current price action context, BTC may retrace to the downside toward the $28100 support level before continuing the bullish momentum.
So, if the price retraces to the downside toward the $28100 support level and bounces with an impulsive daily bullish candle close, the bulls may continue the bullish momentum toward the $31500 key level in the coming days.
Ethereum (ETH)
Fundamental Perspective
The Ethereum (ETH) price has recently broken out of a prolonged consolidation phase, creating a favorable scenario for bearish sentiment. This sudden breakout has instilled a sense of unease among investors, and if the current outlook for ETH does not show signs of improvement, the likelihood of further downside remains significant.
Although there have been some optimistic movements in weekend price action, ETH must surmount two critical resistance levels before investors can begin to feel a sense of reassurance.
Technical Perspective
Source: TradingView
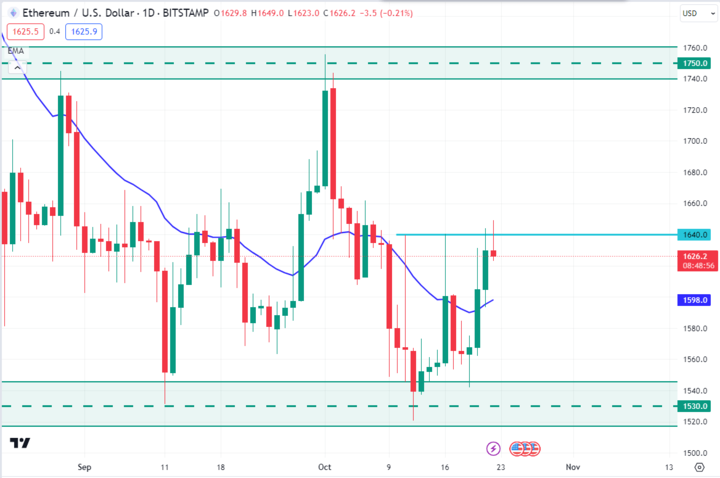
ETH is currently trading around the $1626.2 price area and trying to break above the $1640.0 neckline. So, if the price can break above the $1640.0 neckline with an impulsive daily bullish candle close, the bulls may sustain the bullish momentum toward the $1750.0 resistance area in the coming days.
Tesla (TSLA)
Fundamental Perspective
In the week of October 23 to October 27, 2023, Tesla Inc. (TSLA) faces a pivotal period. The electric vehicle pioneer will unveil its third-quarter financial results, with investors keenly watching for insights into production and delivery numbers, as well as any updates on the company's global expansion plans.
Tesla's performance will be closely scrutinized as the automotive industry grapples with supply chain disruptions and chip shortages. Moreover, developments in the electric vehicle sector and competition from established automakers are key factors.
Investor sentiment may be swayed by Tesla's ability to navigate these challenges. Staying informed about these critical dynamics is crucial for those considering TSLA investments in the coming week.
Technical Perspective

Source: TradingView
TSLA price dropped to the $212.50 support level with a huge gap and is currently trading around the $211.99 price area. As per the current price action, if the price can have an impulsive daily bullish candle close above the $212.50 support level, TSLA may recover higher toward the $242.20 event area in the upcoming days.
GOLD (XAUUSD)
Fundamental Perspective
Amidst the fluctuations in financial markets, investors are seeking refuge in precious metals. The recent stock market downturn, driven by concerns over rising interest rates, has garnered attention. It's not merely the prospect of additional rate hikes by the Federal Reserve that is unsettling investors, but rather the substantial surge in long-term bond yields.
On Thursday, the 10-year Treasury yield reached a 16-year high, approaching 5%, while the 30-year bond exceeded 5.1%. Notably, 30-year mortgage rates have climbed above 8%, posing a potential threat to the housing market. Given the tightening measures undertaken by the bond market, it is widely anticipated that the Federal Reserve will maintain its current interest rates for the remainder of the year.
However, Federal Reserve Chairman Jerome Powell's recent statements did not provide significant clarity regarding the future trajectory of monetary policy.
Technical Perspective

Source: TradingView
Gold price pushed higher and broke over the $1947.00 resistance area. As per the current situation, the price may retrace downward toward the $1947.00 support level in the days ahead. So, if the price retraces down toward the $1947.00 support level and bounces with an impulsive daily bullish candle close, the bulls may sustain the bullish trend toward the $2010.00 resistance area in the coming days.
OIL (WTI)
Fundamental Perspective
West Texas Intermediate (WTI) Crude Oil prices are trading slightly lower on Friday due to ongoing geopolitical tensions in the Gaza Strip, which are raising concerns about potential disruptions in global oil production.
The surge in spot Crude prices observed on Thursday extended into early Friday, pushing WTI to $89.64 per barrel, approaching its highest levels in nearly three weeks before a slight pullback brought it just below $88.00 per barrel. Currently, price action is stabilizing in the midrange, with Crude Oil bids fluctuating around the $88.00 mark as energy traders assess their options leading into the weekend.
Technical Perspective
Source: TradingView
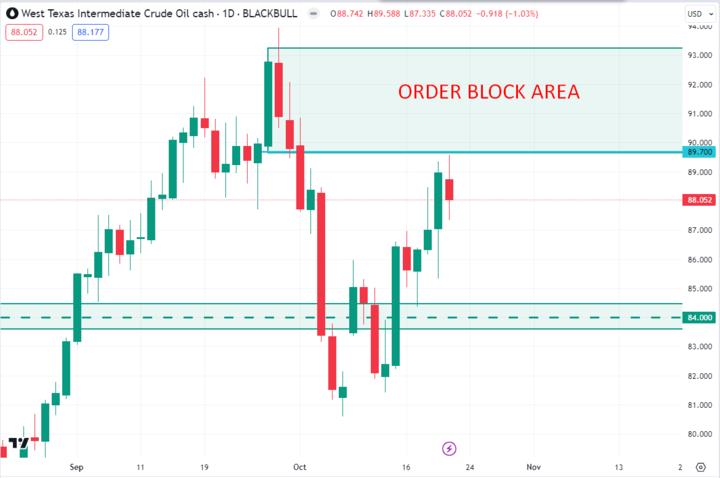
Oil prices moved higher last week after breaking above the $84.00 psychological event area. As per the current price action context, the price may recover further toward the daily order block area. So, if the price recovers further higher and has a daily bearish candle close below the $89.70 price area, the bears may regain momentum and push the price down toward the $84.00 price area again in the days ahead.


