
EURUSD
Fundamental Perspective
On Friday, the EURUSD pair dipped to the 1.0500 mark, influenced by European production data and reaffirmed by the European Central Bank's (ECB) President Christine Lagarde. The banks showed a commitment to maintain a stringent monetary policy stance until inflation aligns with the central bank's 2% target.
In contrast, European Industrial Production reported mixed results early on Friday. The month-over-month Industrial Production for August exceeded expectations, registering a healthy gain of 0.6% compared to the anticipated 0.1%. This marked a strong recovery from the previous reading of -1.1%. However, the annualized figure fell short of expectations, recording -5.5% in contrast to the projected -3.5%, extending the decline from the prior reading of -2.2%.
The Euro (EUR) weakened against the US Dollar (USD), although the downside pressure on the EUR/USD pair was somewhat mitigated by a lower-than-expected Michigan Consumer Sentiment Index. The report came in at 63, below the forecasted 67.4 and indicating a further decline from the previous reading of 68.1.
Technical Perspective
Source: TradingView
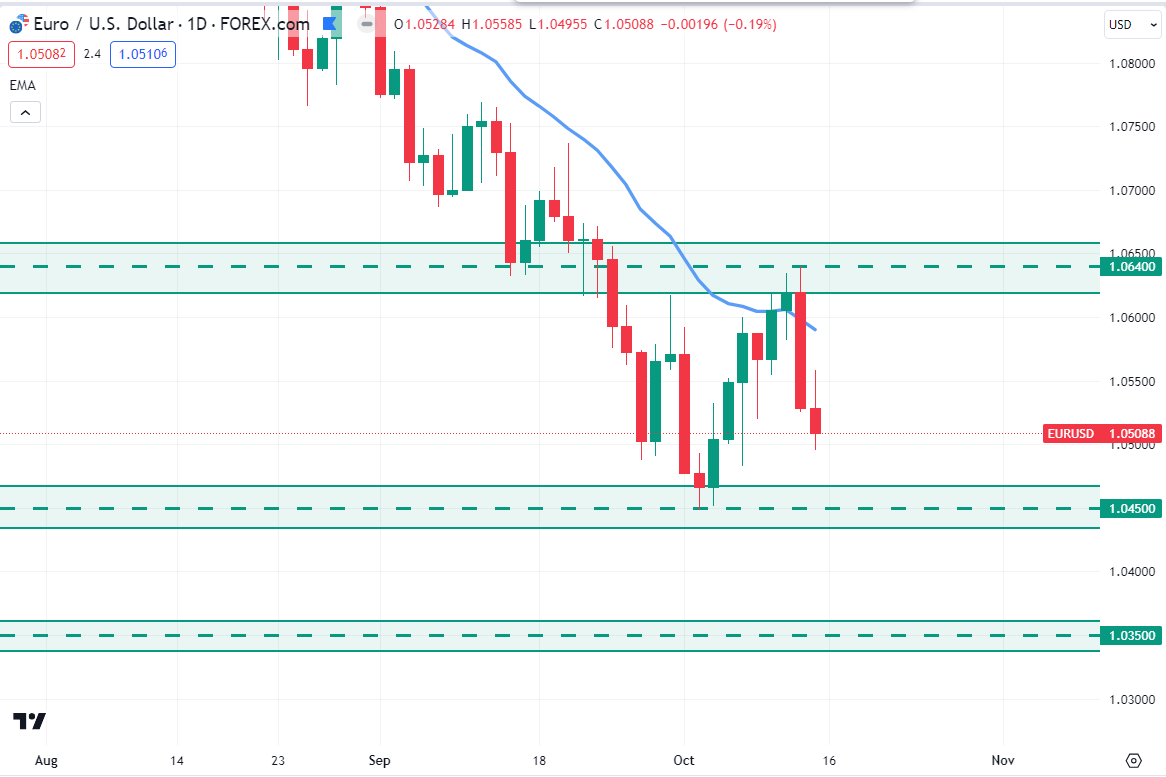
EURUSD is currently trading around the 1.0508 price area after rejecting the 1.0640 psychological resistance level.
As per the current price action, EURUSD may sustain the bearish momentum toward the 1.0450 support level. So, if the price continues toward the 1.0450 support level and bounces with an impulsive daily bullish candle close, the bulls may regain momentum and push the price upward toward the 1.0640 price area again in the days ahead.
On the other hand, if the price breaks below the 1.0450 support level with a daily bearish candle close, the bears may sustain the bearish momentum toward the 1.0350 event area in the coming days.
GBPJPY
Fundamental Perspective
On Thursday, UK economic indicators painted a somewhat unfavorable picture, with Manufacturing Production for August experiencing a decline of 0.8%, falling short of the projected -0.4%. This marked a slight improvement from the previous -1.2%, which was notably revised down from -0.8%.
Looking ahead to the upcoming week, Monday appears to be relatively uneventful on the British economic calendar. Tuesday, however, commenced with a speech by Huw Pill of the Bank of England (BoE), followed by labor and wage data. Projections indicate that the UK's Employment Change for August may moderate from -207K to -195K, while Average Earnings are anticipated to remain steady at 7.8% for the quarter leading into August.
The highlight of the week for the Pound Sterling will be the release of the UK Consumer Price Index (CPI) inflation figures on Wednesday. Investors will be closely monitoring these figures, hoping to observe a slight uptick in CPI inflation for September, moving from 0.4% to 0.3%, as inflationary pressures continue to impact the United Kingdom.
Technical Perspective
Source: TradingView
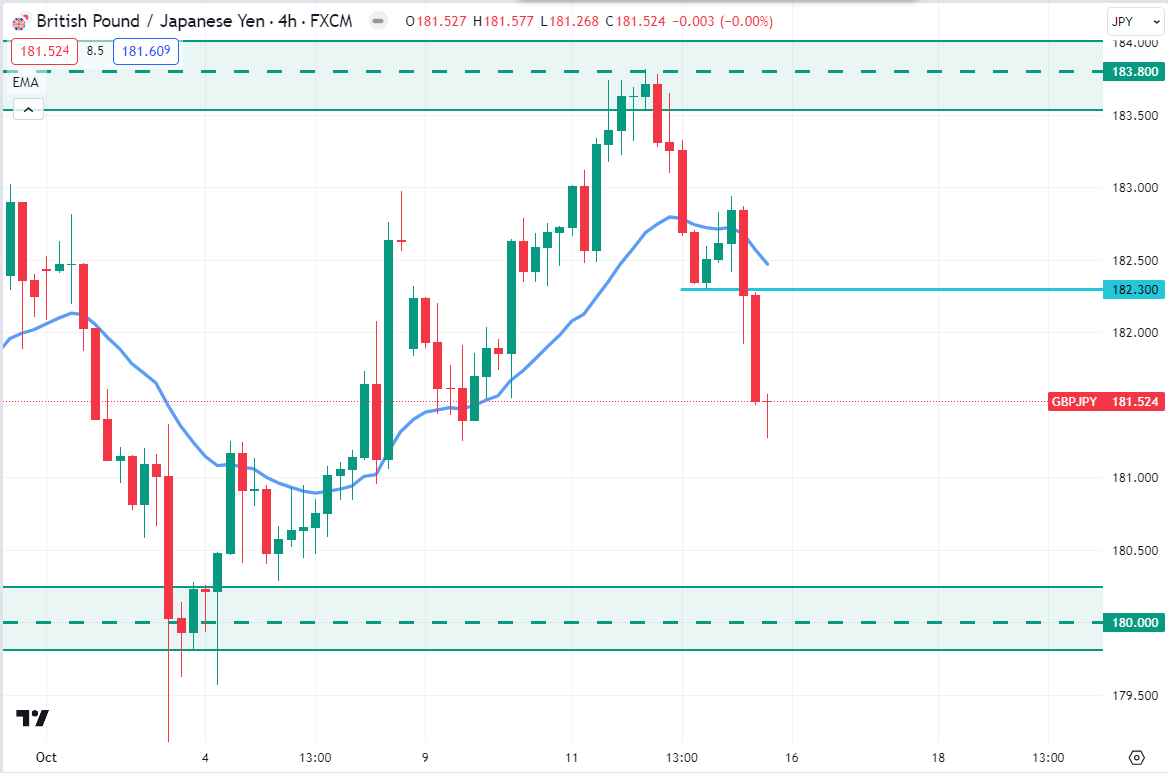
GBPJPY is currently residing around the 181.52 price area. After rejecting the 183.80 resistance level, the bears regained momentum and pushed the price down below the 182.00 psychological level.
As per the current situation, the price may retrace higher toward the 182.30 level in the coming days. So, if the price retraces upward toward the 182.30 price area and rejects with an impulsive H4 bearish candle close, the bears may push the price down toward the 180.00 support level in the days ahead.
NAS100
Fundamental Perspective
The upcoming week holds key developments for the NASDAQ 100 (NAS100) index. Recent data highlights the technology sector's resilience, driven by strong earnings reports from tech giants. This momentum is poised to continue, with investors eyeing the tech-driven innovation and digitalization trends.
However, concerns persist regarding potential regulatory changes that may impact tech companies' operations. It's imperative to closely monitor any government policy shifts, which can influence NAS100's performance.
Additionally, global economic dynamics and trade tensions may introduce volatility, underscoring the importance of a cautious approach. The semiconductor industry and green tech initiatives are key areas to watch. As we step into the upcoming week, market participants should stay informed and adaptable to navigate NAS100's movements effectively.
Technical Perspective

Source: TradingView
NAS100 faced strong bearish pressure last week but failed to break below the dynamic level of 20 EMA on the daily chart. As per the current price action context, if the price can have an impulsive daily bullish candle close above the 14,945.0 support level, the bulls may regain momentum and push the price higher toward the 15,500.0 resistance area in the coming days.
On the bearish side, a failure to hold the price above the 14,800.00 mark could indicate a massive selling pressure towards the 14,500.00 level.
SP500 (SPX500)
Fundamental Perspective
In the approaching week, the S&P 500 index anticipates dynamic market moves. Recent economic data reveals robust corporate earnings, underpinned by a resilient job market and strong consumer spending. These factors continue to buoy the index's performance, with steady gains expected.
However, concerns loom regarding inflationary pressures and potential interest rate hikes by the Federal Reserve. Investors should closely monitor Fed policy statements, which can significantly impact the S&P 500.
Geopolitical tensions and global economic uncertainties remain risk factors, underscoring the need for cautious optimism. The tech sector, in particular, will remain a key focus area.
As we enter the upcoming week, market participants should stay attuned to these drivers to navigate the S&P 500's trajectory effectively.
Technical Perspective
Source: TradingView
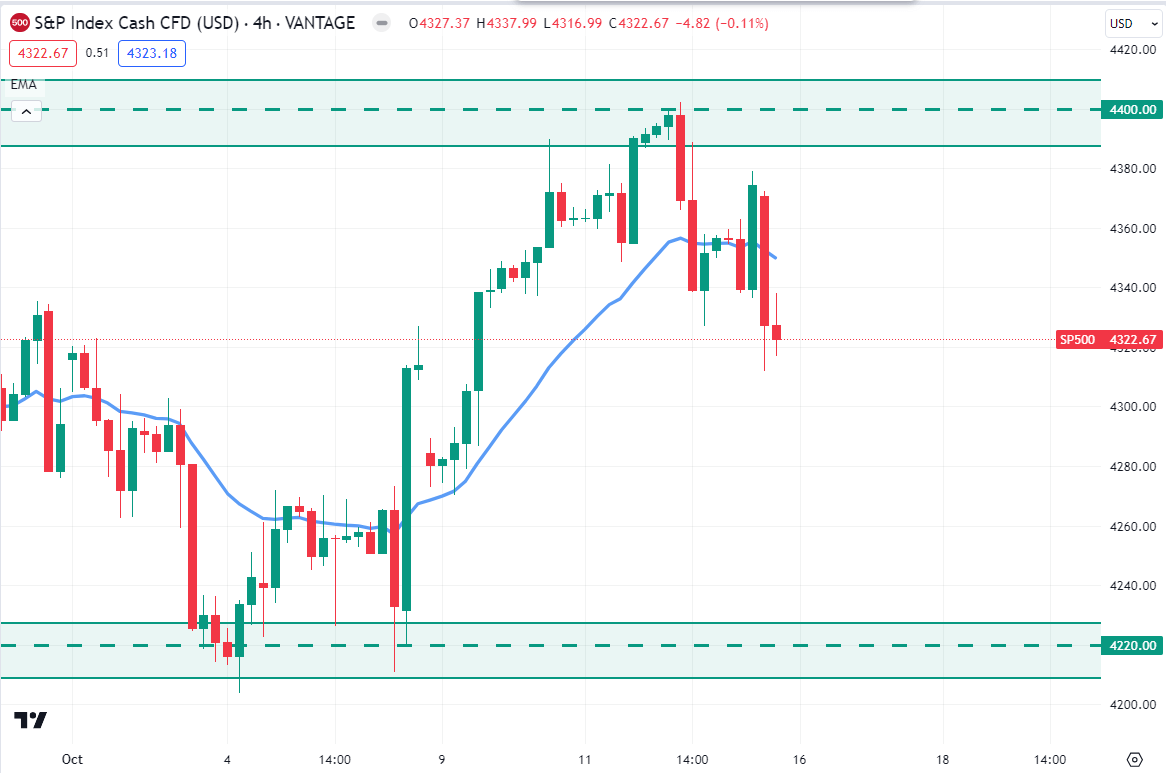
SP500 is currently trading around $4322.67 price area and trying to continue lower. After rejecting the $4400.00 psychological event level, the bears pushed the price down and had an impulsive H4 candle close below the dynamic level of 20 EMA.
As per the current price action, the price may retrace higher towards the $4340.00 price area before continuing further downside in the day's head. So, if the price had an impulsive H4 bearish candle close after retracing toward the $4340.00 price area, the bears may push the price down to the $4220.00 support level in the coming days.
HK50
Fundamental Perspective
The Hong Kong 50 (HK50) index is poised for a dynamic performance in the week ahead. Recent economic indicators suggest an upturn in Hong Kong's financial landscape, bolstered by resilient trade volumes, sound corporate earnings, and the region's prominence in the Greater Bay Area initiative.
However, potential volatility may stem from global economic uncertainties and ongoing geopolitical developments. Traders should remain attentive to news regarding US-China relations, which can significantly influence HK50's performance.
Furthermore, Hong Kong's property market and real estate investment trusts (REITs) continue to draw investor attention, playing a pivotal role in the index's movements. Market participants should keep a close eye on property sector dynamics as they navigate the upcoming trading week.
Technical Perspective
Source: TradingView
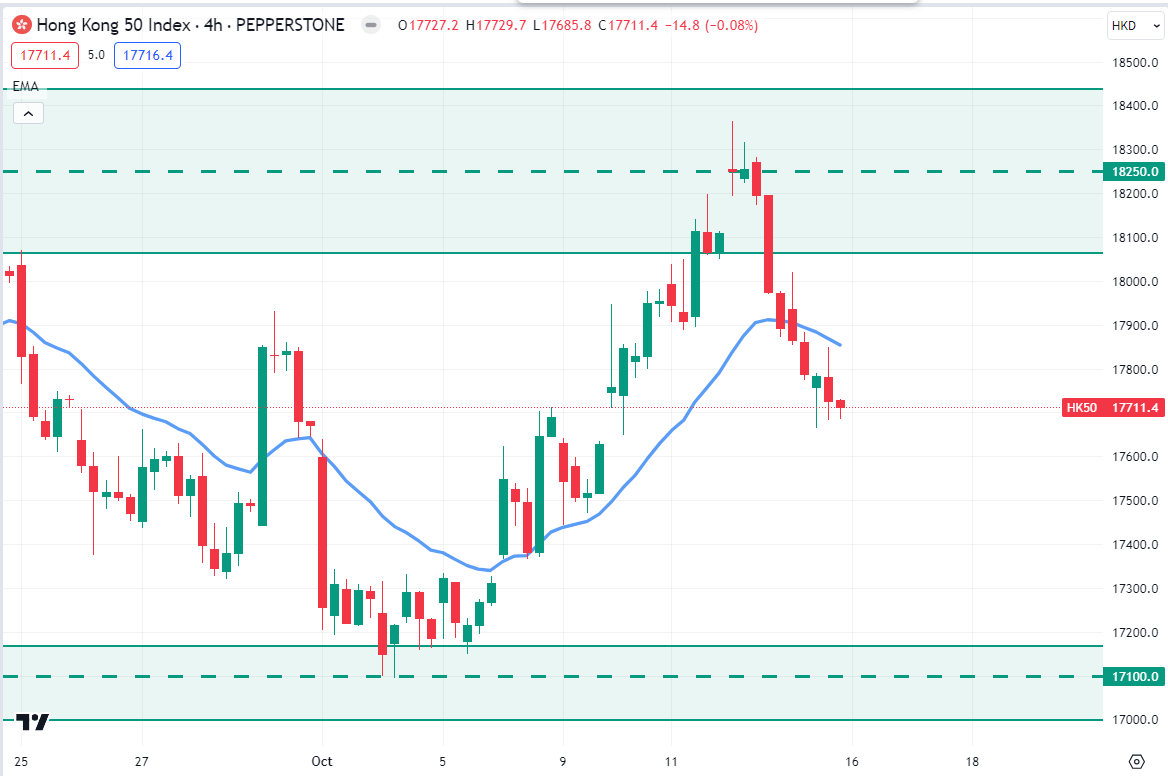
HK50 had an impulsive daily bearish candle close below the dynamic level of 20 EMA after rejecting the $18250.0 resistance area. As per the current scenario, the price may retrace higher toward the dynamic level of 20 EMA on the H4 chart.
So, if the price had an impulsive bearish candle close after rejecting the 20 EMA, the bears may push the price down toward the $17100.0 price area in the coming days.
Bitcoin (BTC)
Fundamental Perspective
Bitcoin (BTC) is currently exhibiting a bullish bias and remains above a pivotal support level as the discussion surrounding a Bitcoin exchange-traded fund (ETF) is a prominent topic within the cryptocurrency community.
This conversation gains traction, fueled by the perception that the US Securities and Exchange Commission (SEC) may not contest the recent Grayscale victory, as the deadline for such action has passed.
Technical Perspective
Source: TradingView
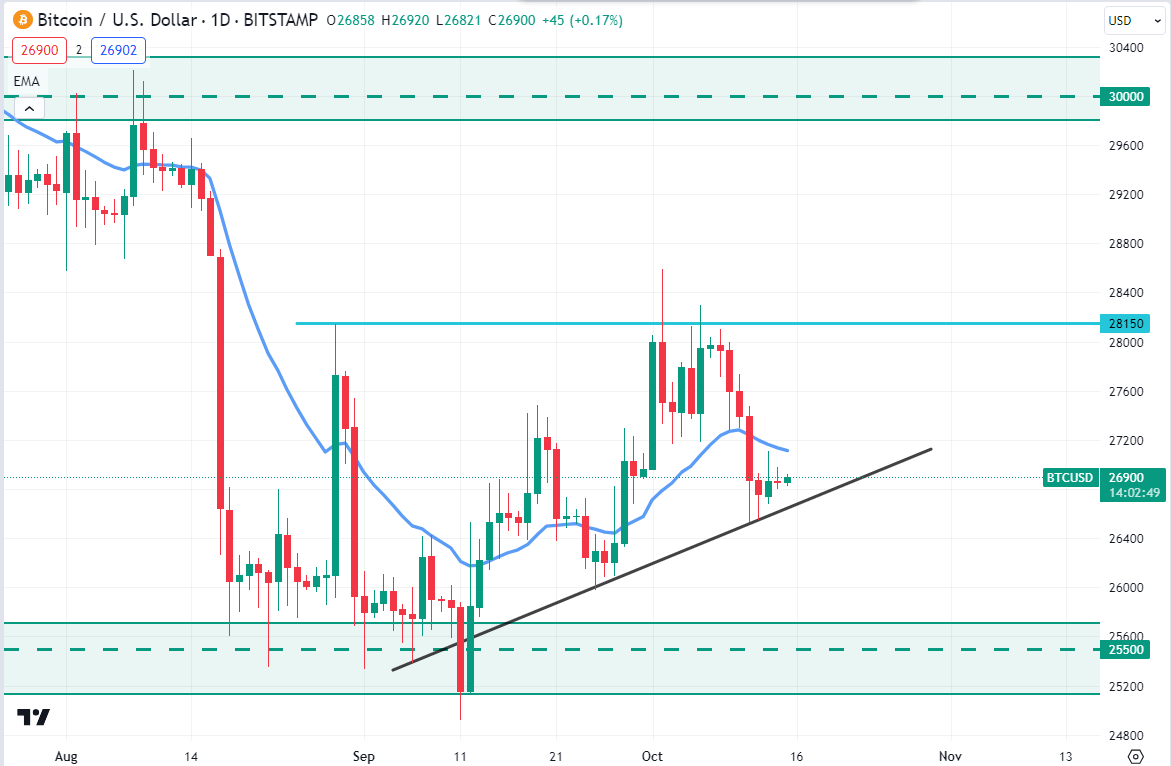
BTC is currently trading around the $26,900 price area after bouncing from the bullish trend line on the daily chart. As per the current price action, if the price can have an impulsive daily bullish candle close above the dynamic level of 20 EMA, the bulls may sustain the bullish bias toward $28,150 as a first target. And our second target will be a $30,000 psychological price area.
On the bearish side, the rising trendline support indicates the presence of retail liquidity. Therefore, a bearish D1 candle below the 26,500 level could be a bearish opportunity for this week.
Ethereum (ETH)
Fundamental Perspective
Ethereum (ETH) continues to follow a downward trend when observed from a broader perspective on the daily timeframe, marked by a series of lower lows and lower highs. The leading alternative cryptocurrency, with the largest market capitalization, has experienced a decline of approximately 12% over the course of the month. Nonetheless, indications of a potential recovery are emerging.
According to a report by Wu Blockchain, Perps Watcher has identified a bold move by a trader known as 0xSifu, who has entered a long position in ETH with a substantial position size exceeding $20 million. The report notes that this trader has been gradually increasing their ETH long positions on Kwenta over the past three days, initiating these positions at an average price of $1,562.27 and leveraging their position with a factor of 5.2X.
It is worth mentioning that Sifu. Eth had previously maintained a short position on ETH during the recent two-week decline in Ethereum's price.
Technical Perspective

Source: TradingView
ETH is currently trading in the $1530.0 - $1745.0 price area. After rejecting the $1745.0 price area, the bears regained momentum and pushed the price down quite impulsively toward the $1530.0 support level.
As per the current price action context, if the price can break above the $1573.0 neckline level with an impulsive daily bullish candle close, the bulls may regain momentum and push the price upwards toward the $1745.0 price area in the coming days.
Telsa (TSLA)
Fundamental Perspective
As we approach the upcoming trading week, Tesla stock (TSLA) investors are keeping a watchful eye on the electric vehicle (EV) giant. Recent data shows that TSLA's production figures continue to rise, driven by robust demand for EVs. With the global push for sustainability, TSLA's green energy solutions and EV offerings are in high demand, reflecting positively on its stock price.
Additionally, recent reports suggest that TSLA's ambitious expansion plans and investments in self-driving technology are bearing fruit. The market anticipates strong quarterly earnings, expected to bolster TSLA's position. Nevertheless, geopolitical tensions and supply chain challenges remain concerns. Traders should remain vigilant and monitor these factors closely as they navigate the week ahead.
Technical Perspective

Source: TradingView
TSLA's price broke below the bullish trend line last week and had a daily close below the $256.50 event area. As per the current situation, the price may retrace higher towards the $256.50 price area before continuing further downside towards the $245.00 price area in the coming days.
GOLD (XAUUSD)
Fundamental Perspective
XAU/USD saw an influx of buyers as gold prices surged by more than 3% in response to reports of Israel transitioning from air to ground operations in the Gaza Strip, raising concerns of potential regional spillover in the Middle East. Consequently, safe-haven assets maintained their appeal leading into the weekend, and the likelihood of the non-yielding precious metal reaching the $2,000 mark increased.
Simultaneously, economic data from the United States revealed a continuing decline in consumer sentiment among Americans, as indicated by the University of Michigan's October survey. Furthermore, Philadelphia Fed President Patrick Harker noted that additional interest rate hikes are unlikely to be necessary.
This environment prompted a deceleration in US Treasury bond yields, notably the US 10-year Real Yields, which currently stand at 2.289%, marking a seven-basis-point decrease, mirroring the movement of the 10-year benchmark note, which yielded 4.629%, also down by 7 basis points. Meanwhile, the US Dollar Index (DXY) has advanced by 0.08%, currently resting at 106.66. This is typically viewed as a headwind for gold prices, as both the US dollar and safe-haven assets, which generally move inversely, are trending upwards in unison.
Technical Perspective

Source: TradingView
Gold price pushed higher quite impulsively after bouncing from the $1811.50 support level. As per the current price action, the bulls may sustain the bullish pressure toward the $1947.50 resistance area. So, if the price continues higher towards the $1947.50 resistance area and rejects with an impulsive daily bearish candle close, the bears may regain momentum and push the price down toward the $1884.80 price area in the days ahead.
OIL (WTI)
Fundamental Perspective
On Friday, oil prices surged by more than four dollars in response to the United States' decision to intensify its sanctions on Russian crude exports. Additionally, concerns about the potential expansion of the Israel-Hamas conflict, potentially involving Iran and impacting the transit of oil through the Strait of Hormuz, contributed to the momentum in oil prices.
The significant price movements that followed the assault can be attributed to a widespread liquidation of long positions held by CTA trend followers, leading to subsequent ripple effects on prices. Based on our current positioning analytics, it appears that there is a significant potential for increased buying activity to occur beyond the $90.50 per barrel threshold in the Brent crude market, which should bolster its ongoing strength.
Technical Perspective
Source: TradingView
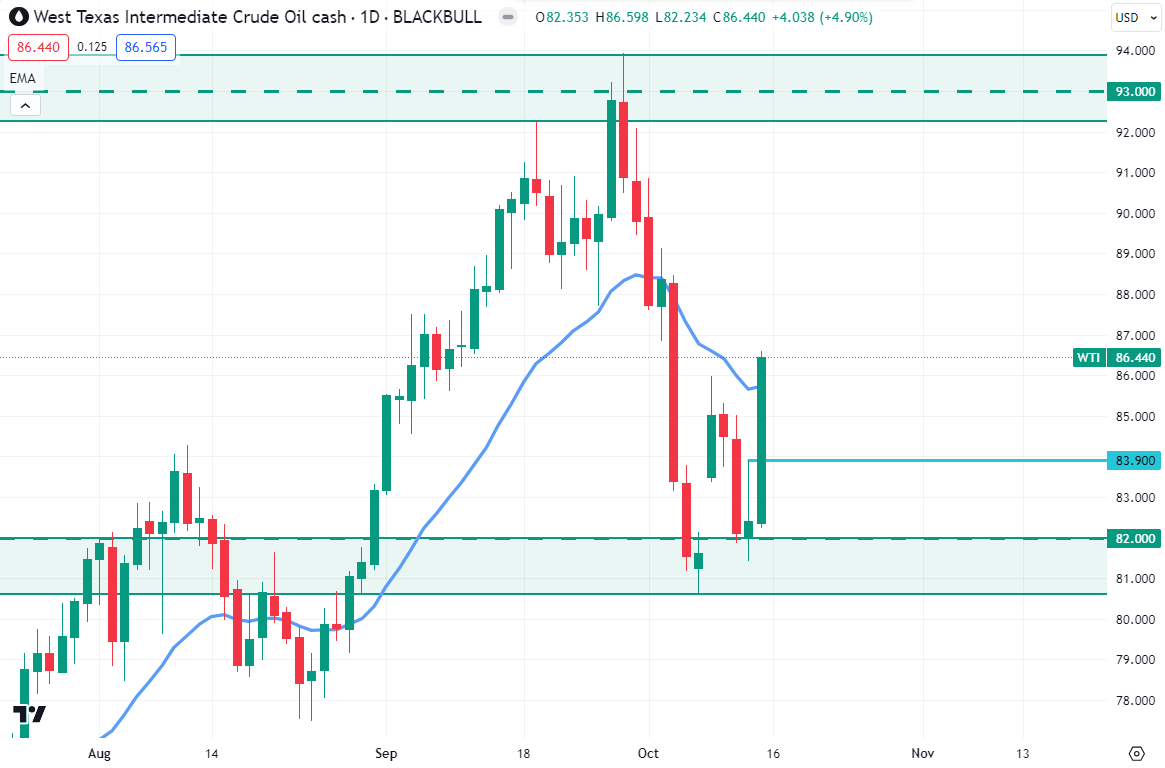
WTI's price moved higher after bouncing from a psychological support level of $82.00 and had a daily close above the $86.00 price level. As per the current price action, the price may retrace downside towards the $83.90 price area in the days ahead. So, if the price retraces down toward the $83.90 price area and bounces with an impulsive daily bullish candle, the bulls may sustain the bullish pressure toward the $93.00 price area in the coming days.


