EURUSD
Fundamental Perspective
The EURUSD pair touched a two-month low of 1.0900 before finishing the week slightly higher at 1.0940. The US Dollar initially lost ground but recovered following the release of the FOMC's September minutes. The minutes revealed that most participants viewed inflation risks as less concerning, with a significant majority supporting a 50 bps rate cut, though some favored a 25 bps reduction. Policymakers also noted that the risks to both inflation and employment are now more balanced.
US inflation data for September exceeded expectations, with the Consumer Price Index rising 0.2% for the month and 2.4% annually. However, these figures weren't enough to shift expectations for the Fed's 25 bps rate cut in November. Recent labor market data also pointed to a more robust economy than anticipated.
German factory orders fell 5.8% in Europe in August, while industrial production rose 2.9%. The ECB's minutes revealed expectations for inflation to rise before falling by late 2025, though recent weak manufacturing data points to near-term headwinds.
Markets are now focused on the ECB's upcoming policy decision, with widespread anticipation of a 25 bps rate cut. Meanwhile, economic releases, including Germany's ZEW sentiment survey and US retail sales, will be closely watched next week.
Technical Perspective
The weekly chart pattern creates a possible double-top pattern, enabling optimism for sellers in the upcoming weeks. However, investors look at the price reaction to the possible neckline of the double-top pattern.
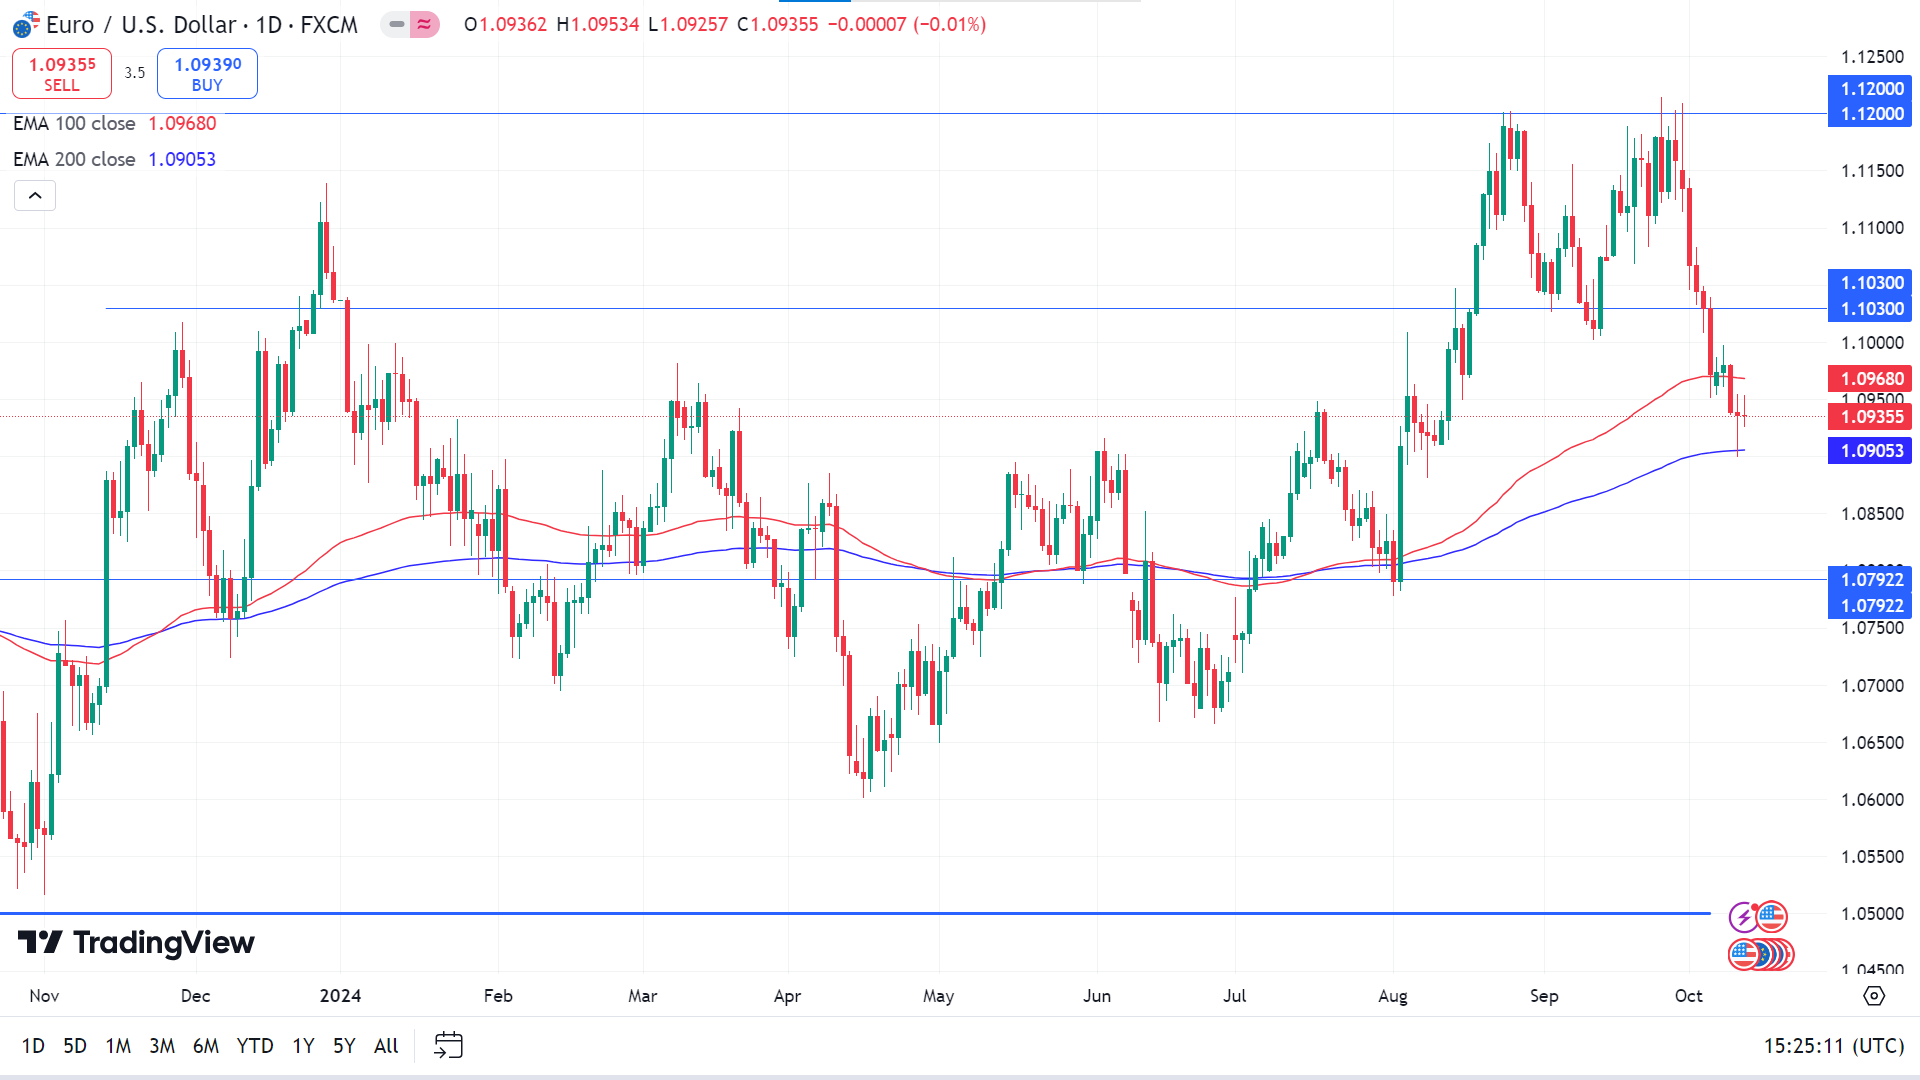
On the daily chart, the price declines at the EMA 200 line but still floats below the EMA 100 line, indicating a mixed signal. If the price bounces back above the EMA 100 line, it will declare significant bullish pressure toward the primary resistance near 1.1030, followed by the next resistance near 1.1197.
On the other hand, the bearish continuation below the EMA 200 line could enable the door for the nearest support near 1.0801, followed by the next support near 1.0690.
GBPJPY
Fundamental Perspective
The Pound Sterling (GBP) posted moderate gains on Friday, buoyed by favorable economic data. August's Gross Domestic Product (GDP) expanded by 0.2%, aligning with expectations and improving July's flat performance. This uptick strengthened the Pound, causing a dip in EUR/GBP.
UK Industrial Production rose by 0.5% in August, recovering from July's revised 0.7% decline and outperforming the forecasted 0.2% increase. Similarly, Manufacturing Production surged by 1.1%, exceeding both previous figures and market expectations. These robust numbers reflect the resilience of the UK economy despite prevailing high interest rates at 5.0%. The data suggests that the Bank of England (BoE) is unlikely to rush into cutting rates, giving the Pound an edge over currencies where rate cuts are widely anticipated.
Earlier in October, the Pound weakened sharply after BoE Governor Andrew Bailey hinted at more aggressive rate cuts. However, it regained stability following BoE Chief Economist Huw Pill's more measured remarks. The next BoE policy meeting, scheduled for November 7, holds a balanced possibility of a 25 bps rate cut.
Meanwhile, the Japanese Yen (JPY) drifted lower amid concerns over Japan's economic outlook. Declining wages and household spending raised doubts about the Bank of Japan's plans for future rate hikes.
Technical Perspective
On the weekly chart, a hammer candle after a solid bullish candle reflects buyers' domination of the asset price, leaving buyers optimistic for the upcoming weeks.
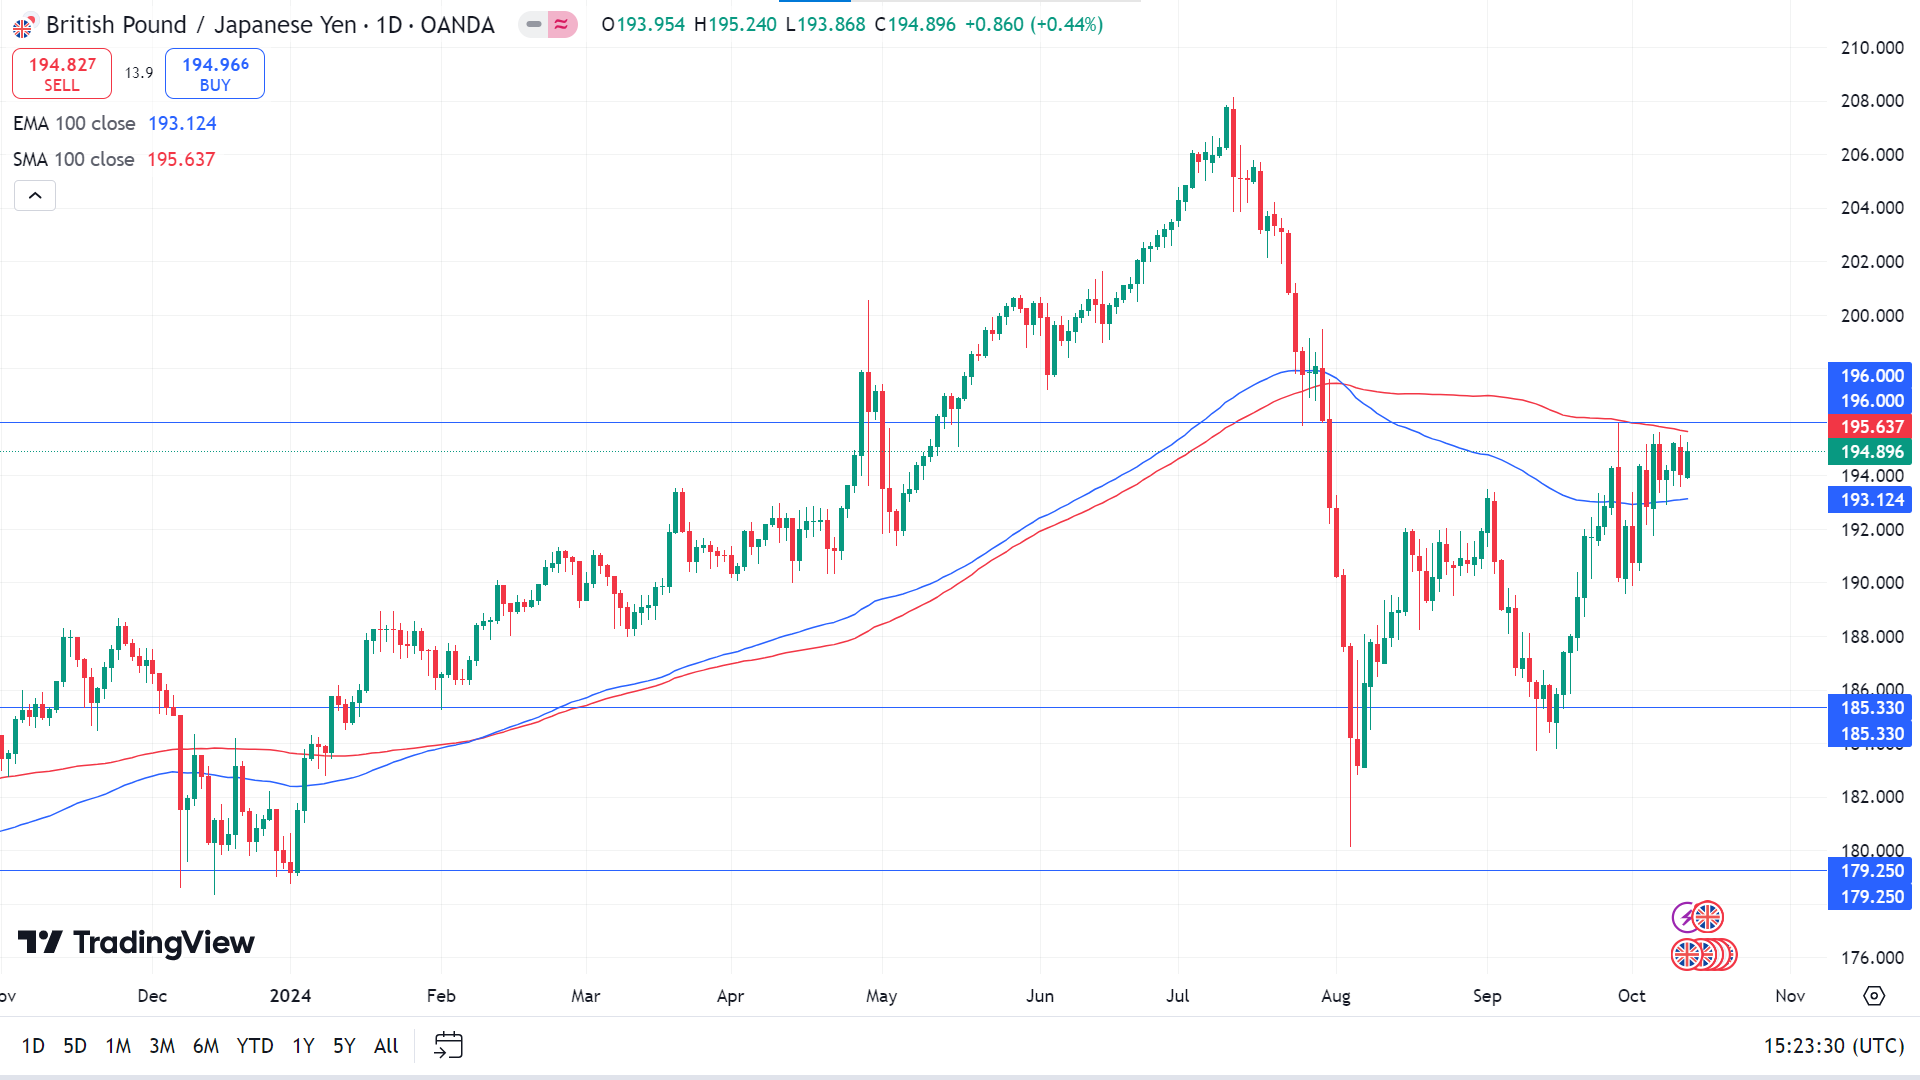
On the daily chart, the price is floating between the EMA 100 and SMA 100 lines, indicating a sideways momentum. In that case, any breakout will determine the future price direction.
On the bullish side, a break above the 100-day SMA line might find a primary resistance at the 196.00 level and a breakout will trigger the price to reach the next resistance near 200.35.
On the other hand, the ongoing price action is corrective to the 193.00 high, which signals a weaker buying pressure. In that case, a bearish reversal with a stable market below the EMA 100 line could trigger the price to drop at the primary support near 189.92, followed by the next support near 185.33.
Nasdaq 100 (NAS100)
Fundamental Perspective
Wall Street closed bullish last Friday, boosted by solid post-earnings gains from JPMorgan Chase and Wells Fargo. The Dow rose 1% to 42,863.9, while the Nasdaq Composite edged up 0.3% to 18,342.9. Financial stocks led the market higher, with technology unchanged and consumer discretionary the only sector to decline.
Over the week, the Dow increased 1.2%, with the S&P 500 and Nasdaq gaining 1.1%.
JPMorgan's shares climbed 4.4%, leading the Dow, as the bank reported stronger-than-expected third-quarter earnings driven by its investment banking division. Wells Fargo also saw a 5.6% rise, ranking among the top performers on the S&P 500, as trading gains and investment banking fees boosted earnings despite a decline from the previous year.
Fastenal shares surged 9.8% following better-than-expected third-quarter results, making it one of the top performers on both the S&P 500 and Nasdaq.
Tesla fell 8.8% after unveiling its "Cybercab" and "Robovan" prototypes, with analysts citing a lack of updates on critical developments.
US Treasury yields changed little, with the two-year yield dipping to 3.95% and the 10-year holding steady at 4.1%.
Technical Perspective
The weekly chart confirms the price is in a straight bullish trend, which has recovered from recent retracements and may seek to create a new high.
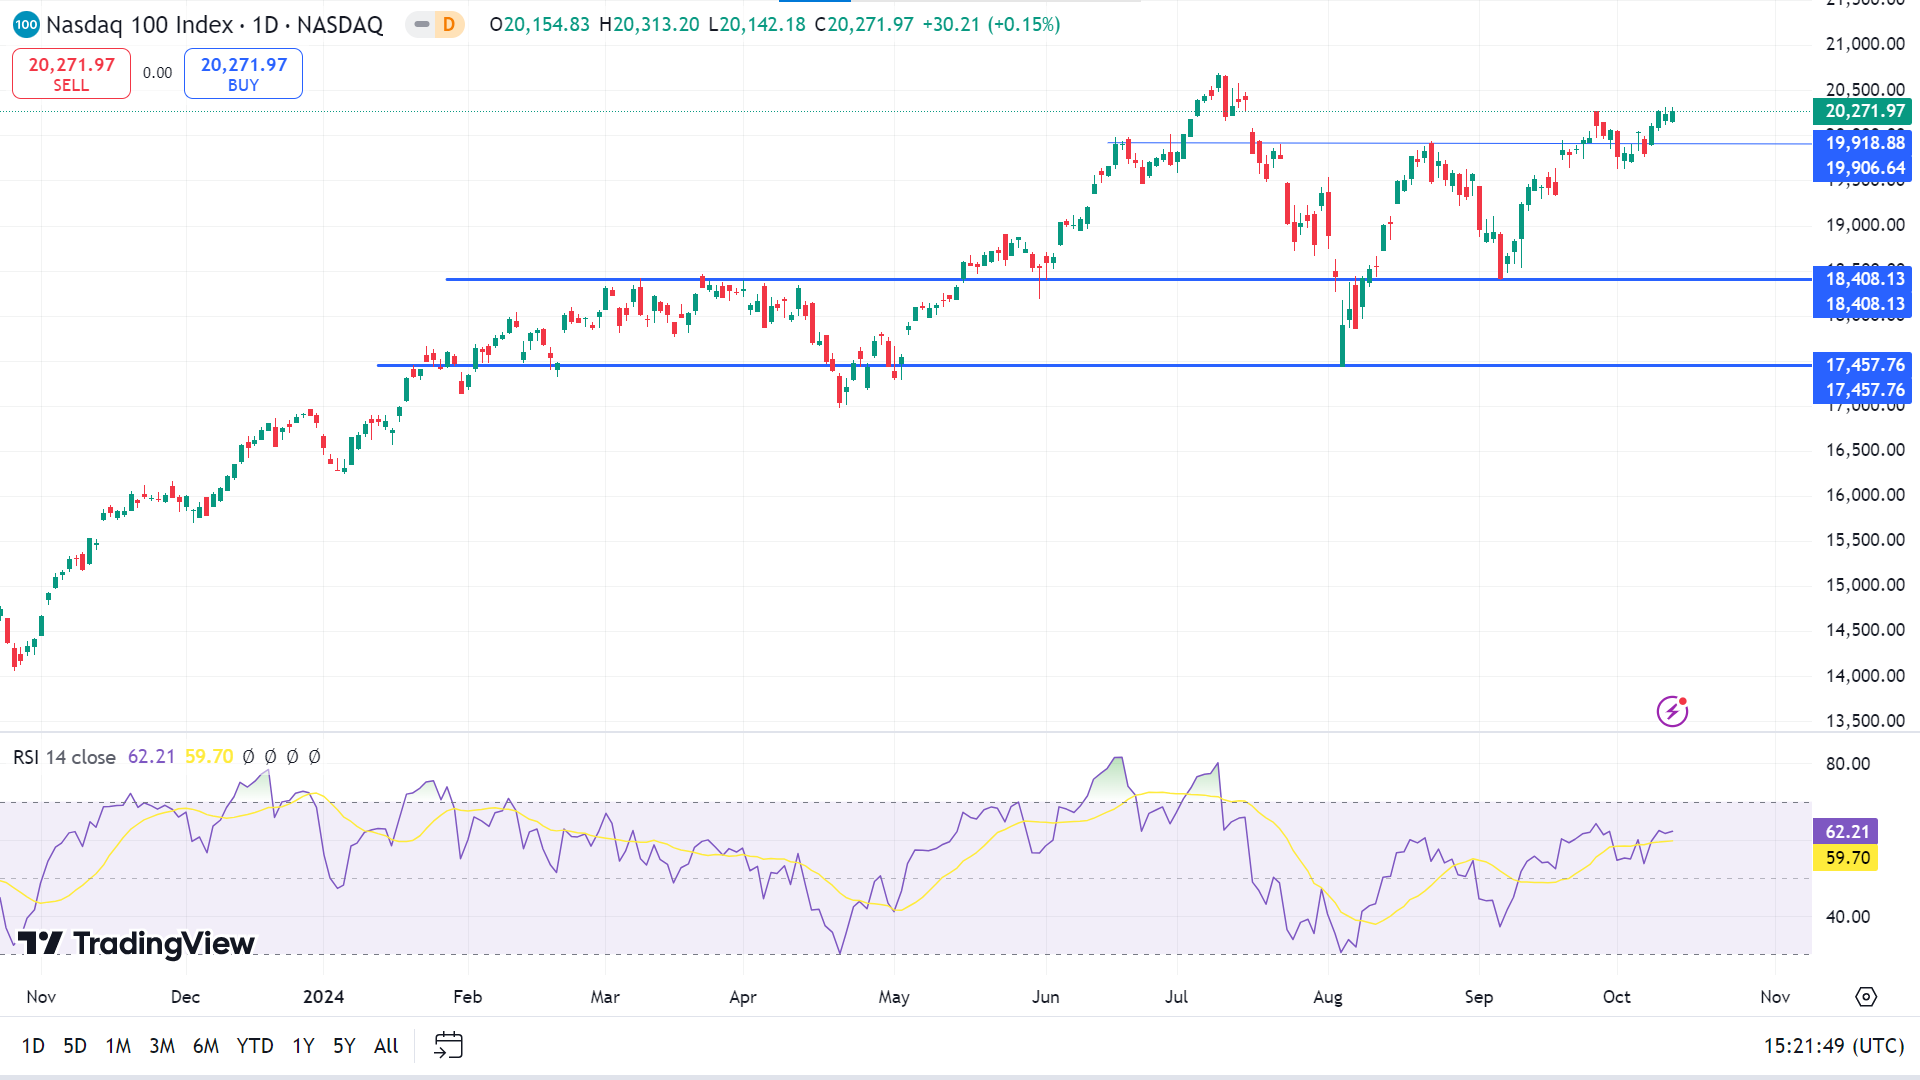
On the daily chart, the price breaks above the previous resistance and floats below the ATH as the RSI indicator reading remains neutral, with the dynamic signal line floating below the overbought line. Following the major trend the RSI might extend above the 70.00 line, taking the main price at the resistance of 20,735.42, followed by the next resistance near 21,450.65.
Meanwhile, the main price has squeezed to an area from where a bearish pressure might come from a valid symmetrical triangle breakout. In that case, the RSI below the 50.00 line could support the selling pressure towards the 19,431.95 level, followed by the next support near 18,627.06.
S&P 500 (SPX500)
Fundamental Perspective
The S&P 500 advanced 1.1% last week, reaching new record highs as the Q3 earnings season began on a solid note. The index closed at 5,815.03 on Friday, marking its fifth straight weekly gain and setting an intraday high of 5,822.13. For October, the S&P 500 is up 0.9%, with a year-to-date increase of 22%.
Investor sentiment was bolstered by better-than-expected JPMorgan Chase and Wells Fargo earnings, sparking optimism for upcoming corporate results.
Technology led the week's gains, climbing 2.5%, followed by industrials at 2.1% and financials at 1.8%. Health care, materials, and consumer staples also posted increases. Super Micro Computer soared 16%, the largest tech sector gainer, after deploying over 100,000 GPUs in one quarter and unveiling a liquid cooling system for data centers. Fastenal jumped 9.5%, exceeding Q3 expectations despite weaker market demand.
On the downside, utilities dropped 2.6%, with significant losses in Vistra (-9.5%) and AES Corp. (-8.4%). Communication services, consumer discretionary, energy, and real estate also declined.
Looking ahead, major earnings reports next week include UnitedHealth, Bank of America, and Johnson & Johnson, along with critical economic data on retail sales and industrial production.
Technical Perspective
The weekly chart suggests the asset remains in a solid bullish trend. The upcoming candle might be another green one, as the asset has posted consecutive gaining candles for several weeks.
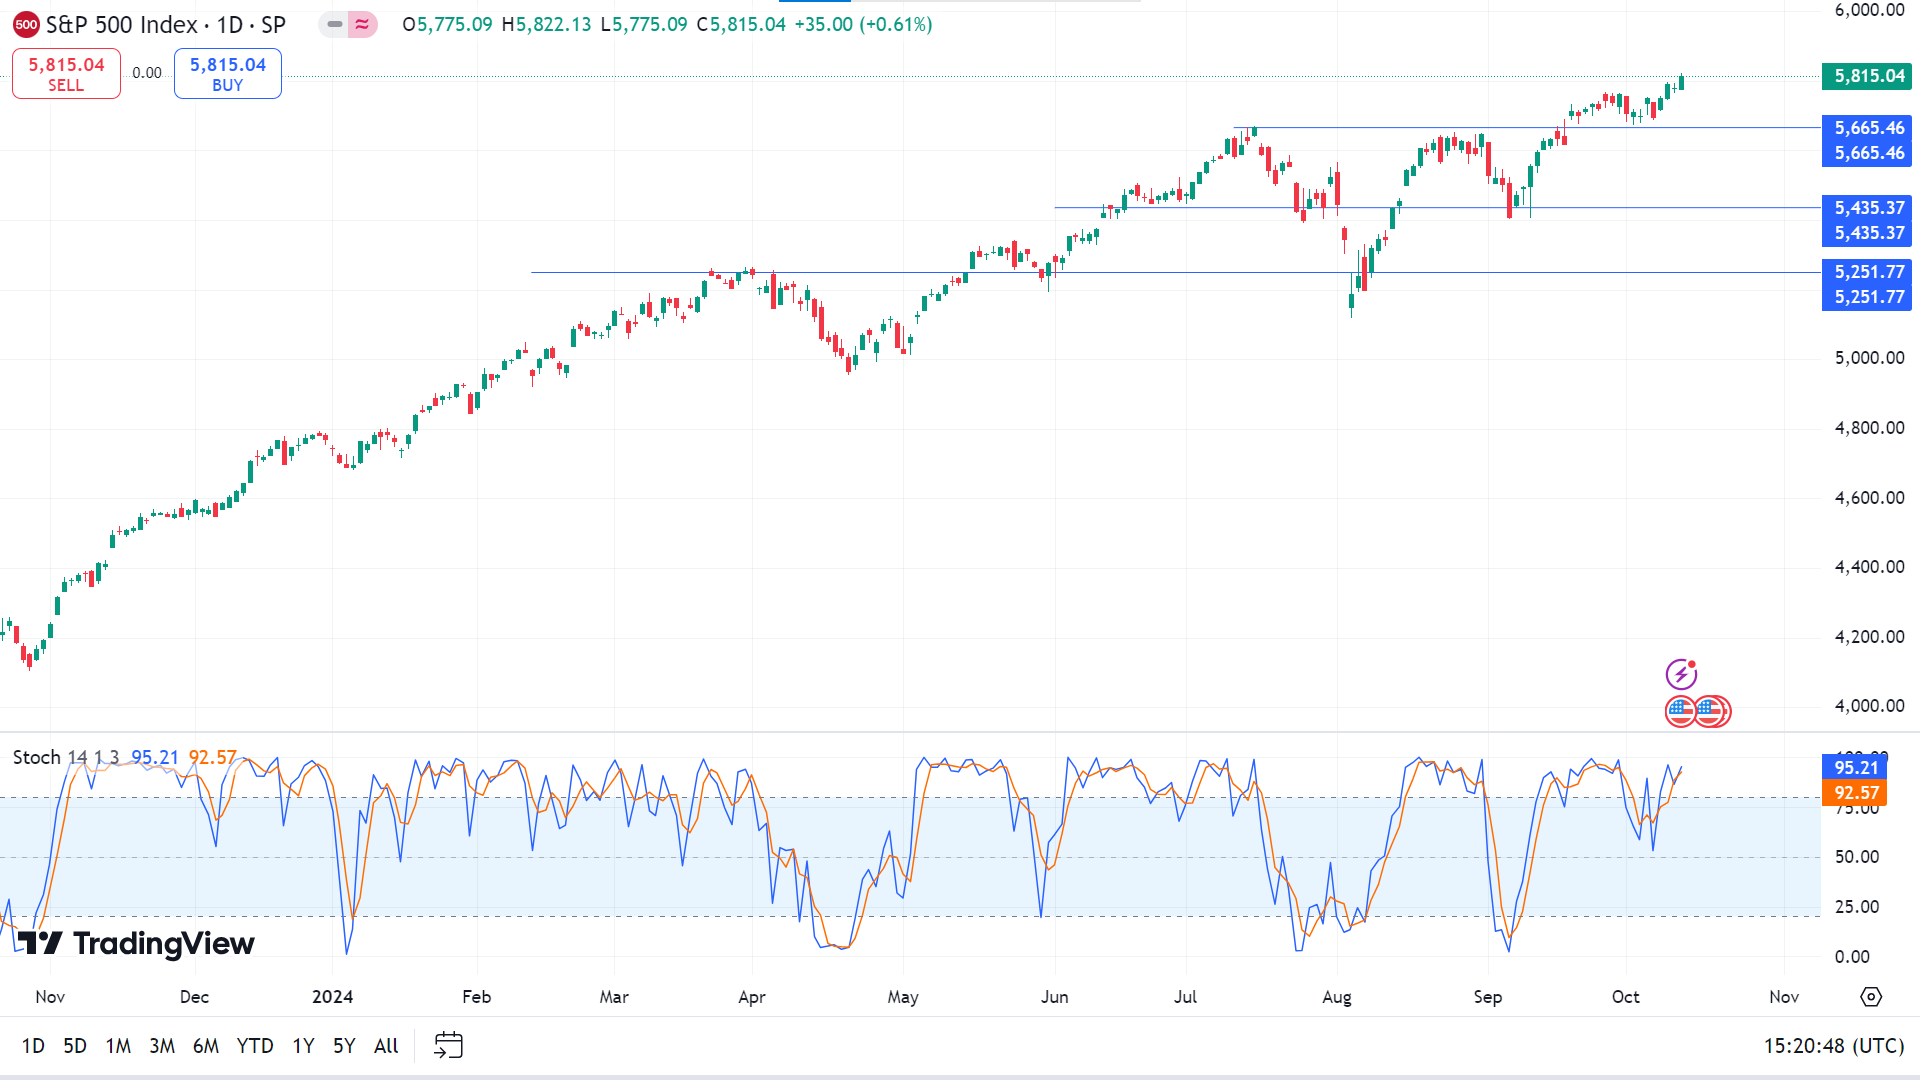
The Stochastic indicator window confirms the price on a bullish trend as the dynamic signal lines float above the upper line of the indicator window while the readings remain neutral. As the major trend is bullish, supported by the bullish Stochastic, we may expect the price to find a resistance from the 5,869.58 level, followed by the next possible resistance near 6,008.91.
On the downside, any retracement of the current bullish trend may drive the price toward the nearest support, which is 5,722.98. If the Stochastic signal lines reach below the 50.00 neutral line, the price might decline toward the next support near 5,621.97.
Gold (XAUUSD)
Fundamental Perspective
Gold (XAU/USD) saw a sharp decline early in the week but recovered after nearing the $2,600 mark. Investors are now awaiting critical economic data from China and monitoring geopolitical tensions closely.
Gold weakened as the US Dollar strengthened following robust employment data. Despite ongoing tensions between Israel and Iran, the lack of escalation reduced Gold's appeal as a safe-haven asset. Concerns over China's economic slowdown further pressured the metal, with the Shanghai Composite and Hang Seng indices experiencing significant declines.
The Federal Reserve's hawkish tone from its September meeting minutes strengthened the USD midweek, keeping Gold from rebounding. US inflation data released on Thursday showed a slight decrease, but higher-than-expected core CPI figures and disappointing jobless claims allowed Gold to stabilize by week's end. On Friday, stronger-than-expected Producer Price Index (PPI) data limited further gains.
Gold investors will closely monitor China's trade balance, GDP, and industrial production data, as negative surprises could weigh on the metal. Additionally, geopolitical tensions in the Middle East, especially between Israel and Iran, could drive Gold's safe-haven demand if the situation escalates.
Technical Perspective
A doji candle, after four consecutive gaining candles, reflects a strong possibility that the next candle might be another bullish one.
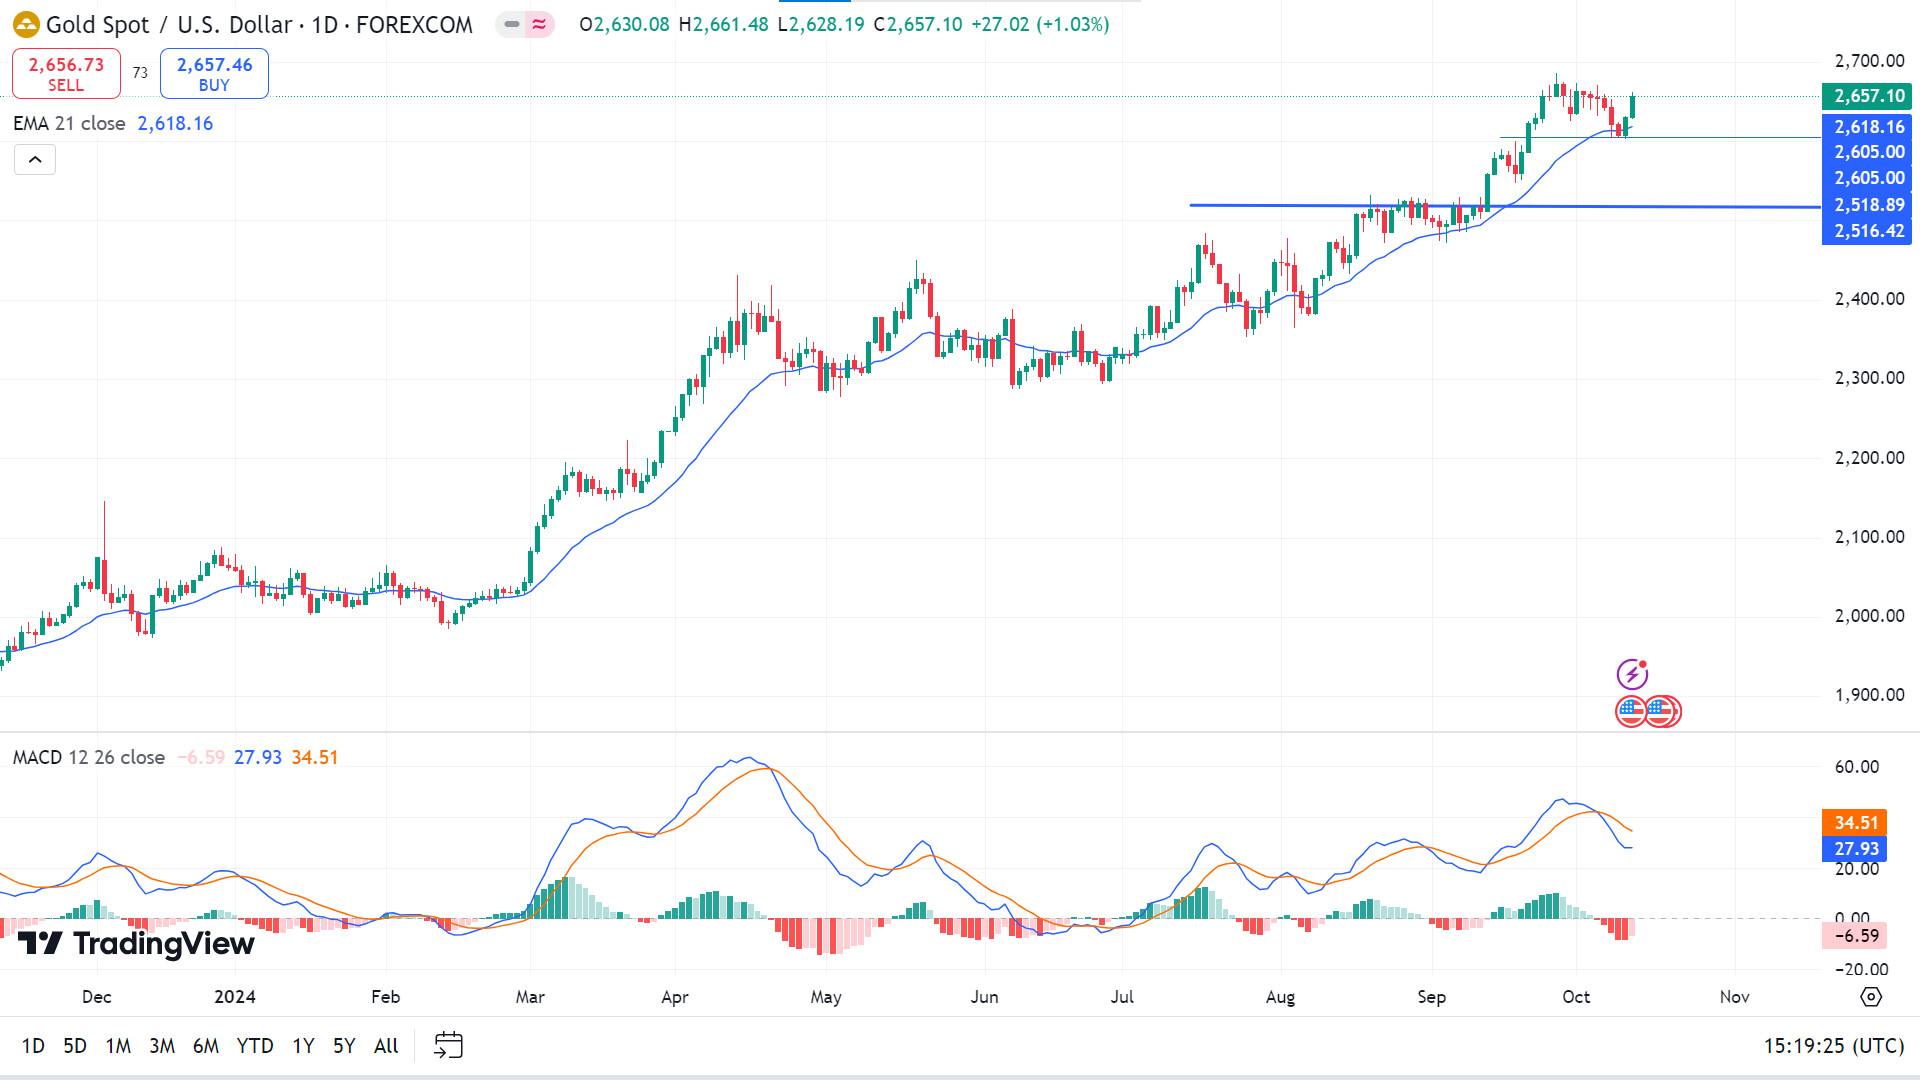
The MACD indicator window shows the price moving in the bearish territory while staying above the EMA 21, declaring a bullish force on the asset price. Despite the sentiment in the MACD Histogram, the main price chart shows a different story.
A strong bullish reversal is visible from the 20-day EMA, supporting the major market trend. In that case, a positive Histogram might boost the buying pressure toward the primary resistance of 2,679.05, followed by the next resistance near 2,729.47.
Even if the major trend is bullish, higher volatility might come from the geopolitical tension, where a valid downside pressure below the 2618.18 low might initiate a consolidation in this instrument.
Bitcoin (BTCUSD)
Fundamental Perspective
Bitcoin (BTC) dropped over 6% this week, marking its second consecutive weekly decline after failing to break the $66,000 resistance level. Institutional demand weakened, reflected in a sharp drop in U.S. spot Bitcoin ETF inflows from $1.1 billion to $262.8 million. Despite this, Metaplanet Inc. purchased 108.786 BTC, indicating some investor confidence remains.
By midweek, Bitcoin slipped further, briefly falling below $62,000 amid news that the U.S. government could sell 69,370 BTC confiscated from a Silk Road user. This potential sale has raised concerns about increased selling pressure.
On Thursday, Bitcoin experienced significant volatility, falling to $58,946 before recovering to $60,326. This movement followed the release of U.S. inflation data, which showed a 2.4% annual increase in the Consumer Price Index (CPI) for September, slightly above expectations.
By Friday, BTC had partially rebounded to trade above $61,000. Analysts expect that further U.S. interest rate cuts could positively affect Bitcoin, and some projections suggest BTC could reach $90,000 by the end of 2024, driven by macroeconomic factors and increased money supply.
Technical Perspective
A doji after a bearish candle on a bullish trend indicates a mixed signal on the weekly chart. Depending on the investor's activity, the next candle might be red or green.
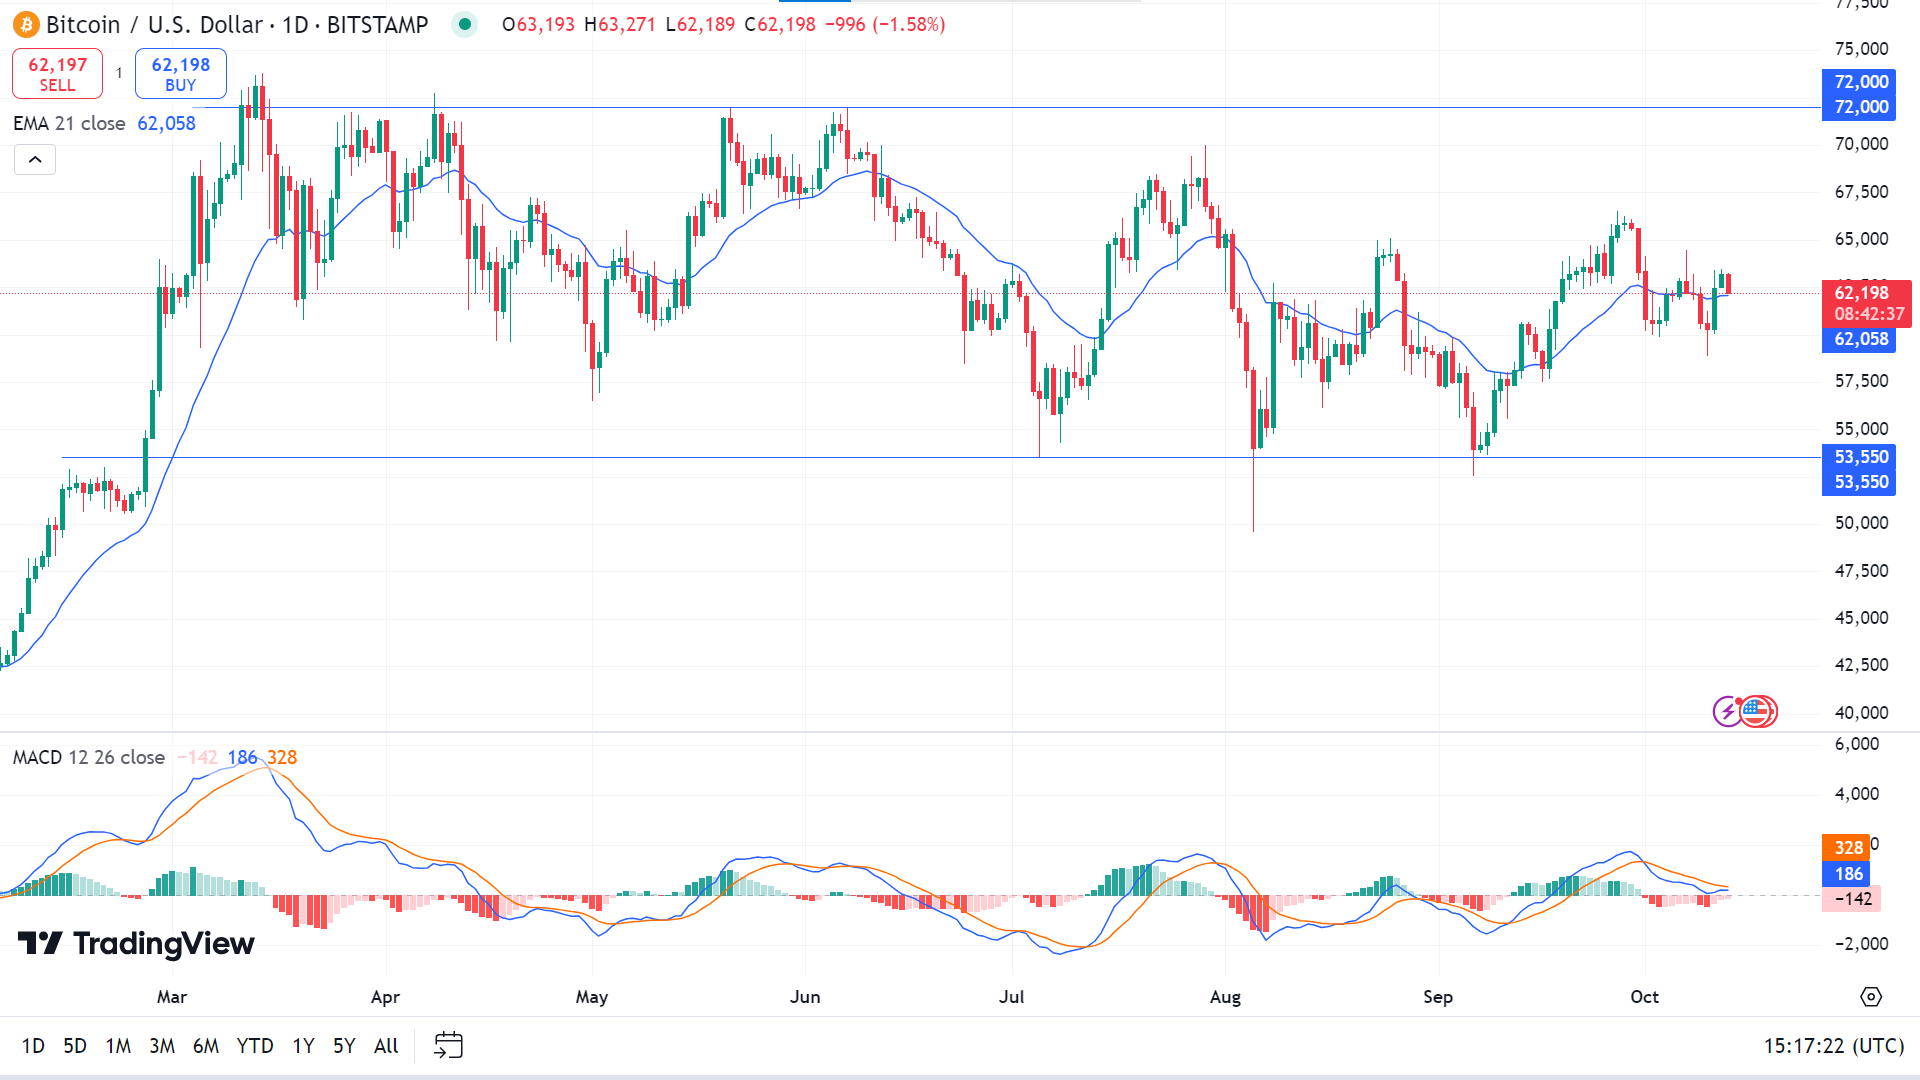
Due to recent bullish pressure, the price is above the EMA 21 line on the daily chart, whereas the MACD indicator reading remains bearish. So, according to the EMA 21 line, the price may head to regain the resistance of 65,454, followed by the next resistance near 68,326.
However, according to the MACD indicator suggestion, if the price crosses below the EMA 21 line, it can retouch the primary support of 59,351, followed by the next support near 55,223.
Ethereum (ETHUSD)
Fundamental Perspective
Ethereum's recent price dip has led to speculation that China is selling Ether (ETH) seized from the Plustoken Ponzi scheme. Plustoken, a fraudulent crypto scheme in China between 2018 and 2019, resulted in authorities confiscating 194,000 BTC and 830,000 ETH. While most of the Bitcoin was sold by 2020, a large portion of the ETH remained unsold until now.
On-chain analysis by OTC Research suggests that China has begun liquidating the remaining 542,000 ETH, valued at over $1.3 billion. In the last 24 hours, 15,700 ETH was transferred to an unknown address, raising speculation about a potential sell-off.
Adding to the concerns, the Chinese government has reportedly moved 7,000 ETH to crypto exchange-linked addresses. These moves have coincided with a 2% drop in Ethereum's price, now trading below $2,400, according to Coingecko. Analysts are watching closely as further sales could continue to impact ETH prices.
Technical Perspective
The last candle on the weekly chart closed as a bullish hammer, but still, the price remains on the bearish trend, leaving sellers optimistic for the next week.
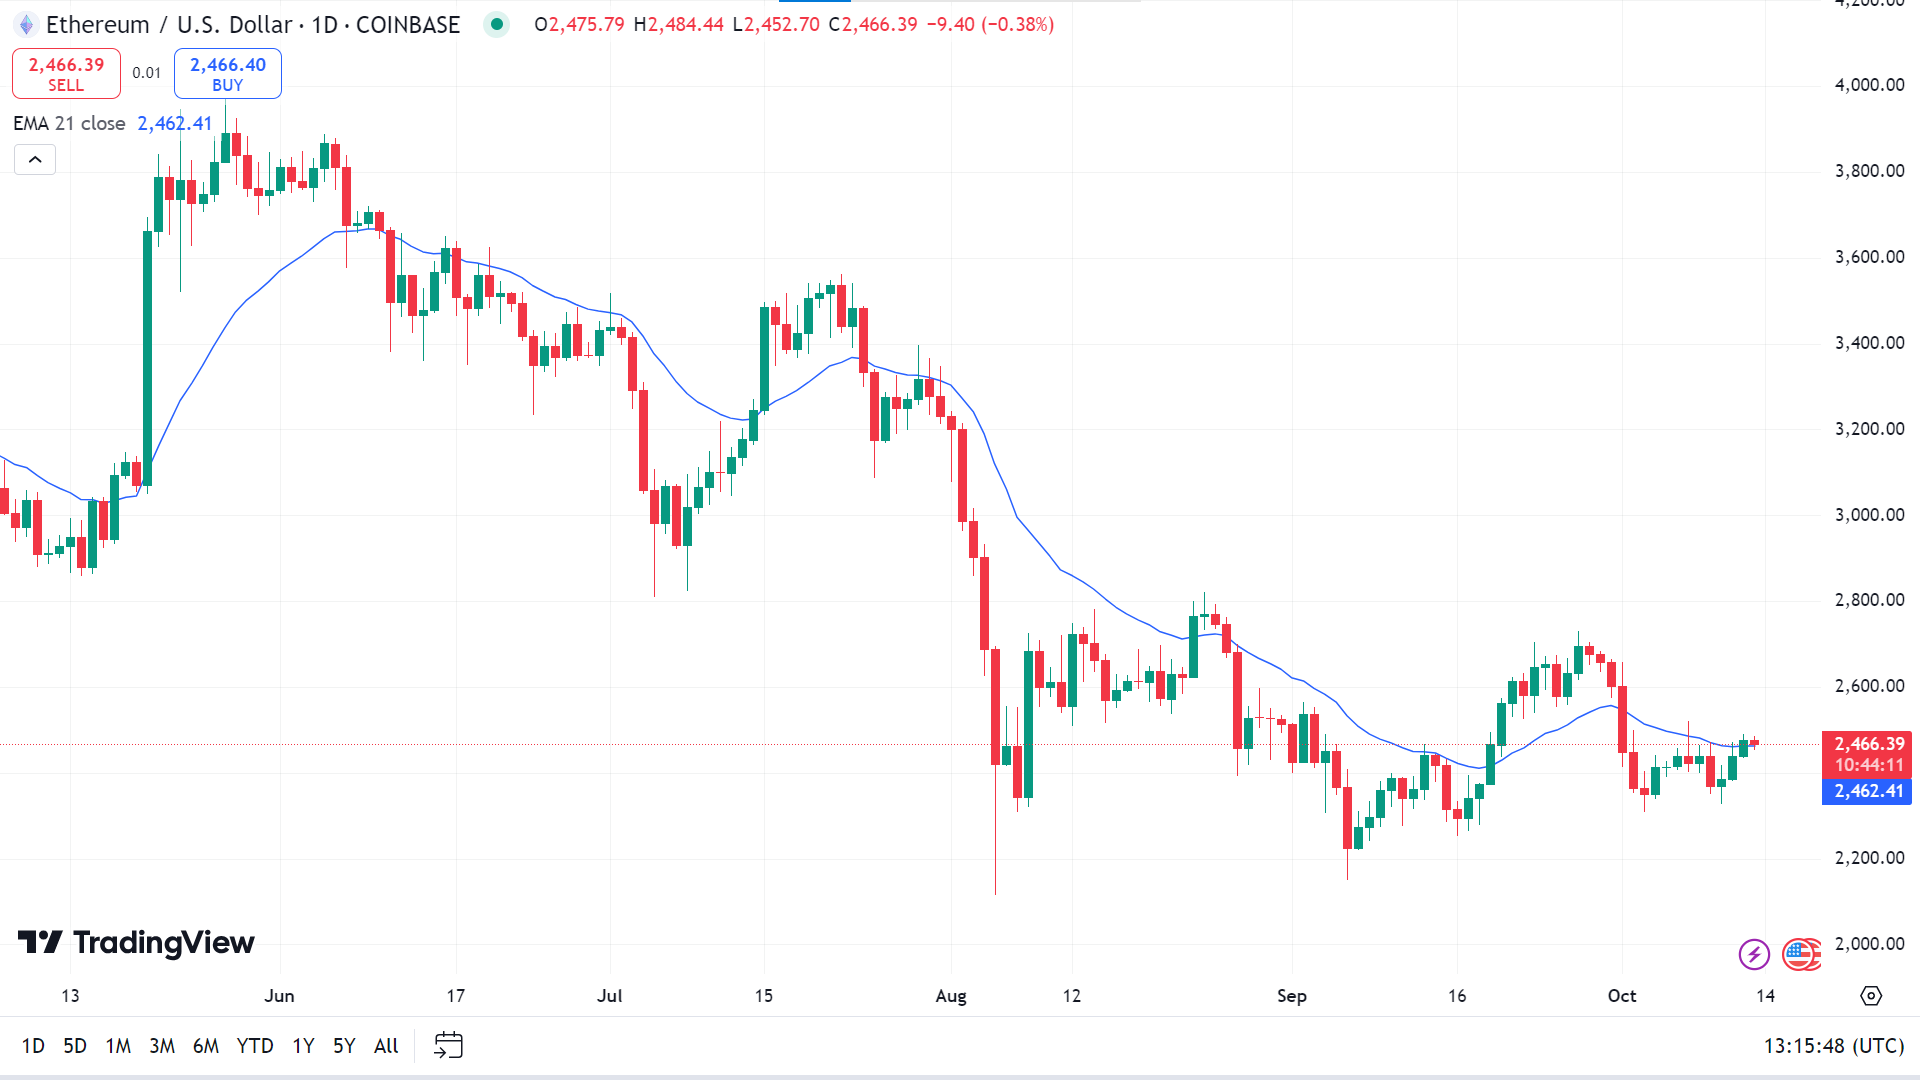
The price floats closely with the EMA 21 line; if the price exceeds the EMA 21 line, it can hit the primary resistance of 2,644.61, and a breakout may trigger the ETHUSD pair to the next resistance of 2,806.40.
On the other hand, if the price declines below the EMA 21 line, it may reach the nearest support near 2,343.35, and the next support is near 2,203.87.
Tesla Stock (TSLA)
Fundamental Perspective
Tesla stock has been rebounding ahead of the much-anticipated October 10 robotaxi event, approaching a key buy point. Despite recent gains, investors are cautious, given Tesla's tendency for post-event stock dips. Invitations for the event were sent on September 25, with CEO Elon Musk fueling excitement by calling it a historic moment, on par with the launch of the Model 3. The event, dubbed “We, Robot,” will take place at Warner Bros. Studios in Los Angeles, with high expectations for Tesla's autonomous driving technology updates.
Analysts, however, remain wary. CFRA's Garrett Nelson warned of downside risks, noting Tesla's recent stock surge and the potential for post-event disappointment. On Thursday, shares were down 4.5% for the week, closing at $238.77 while staying above their 50-day moving average.
Amidst this, Tesla reported a 6% year-over-year rise in global Q3 deliveries and introduced new price cuts on critical models to boost sales. Analysts expect the robotaxi event to showcase Tesla's advancements in full self-driving (FSD) technology, with predictions of a demonstration of the autonomous "Cybercab" on a closed course, signaling Tesla's next chapter in autonomous vehicles.
Technical Perspective
The price creating a possible double-top pattern on the weekly chart suggests that the price may be entering a bearish trend.
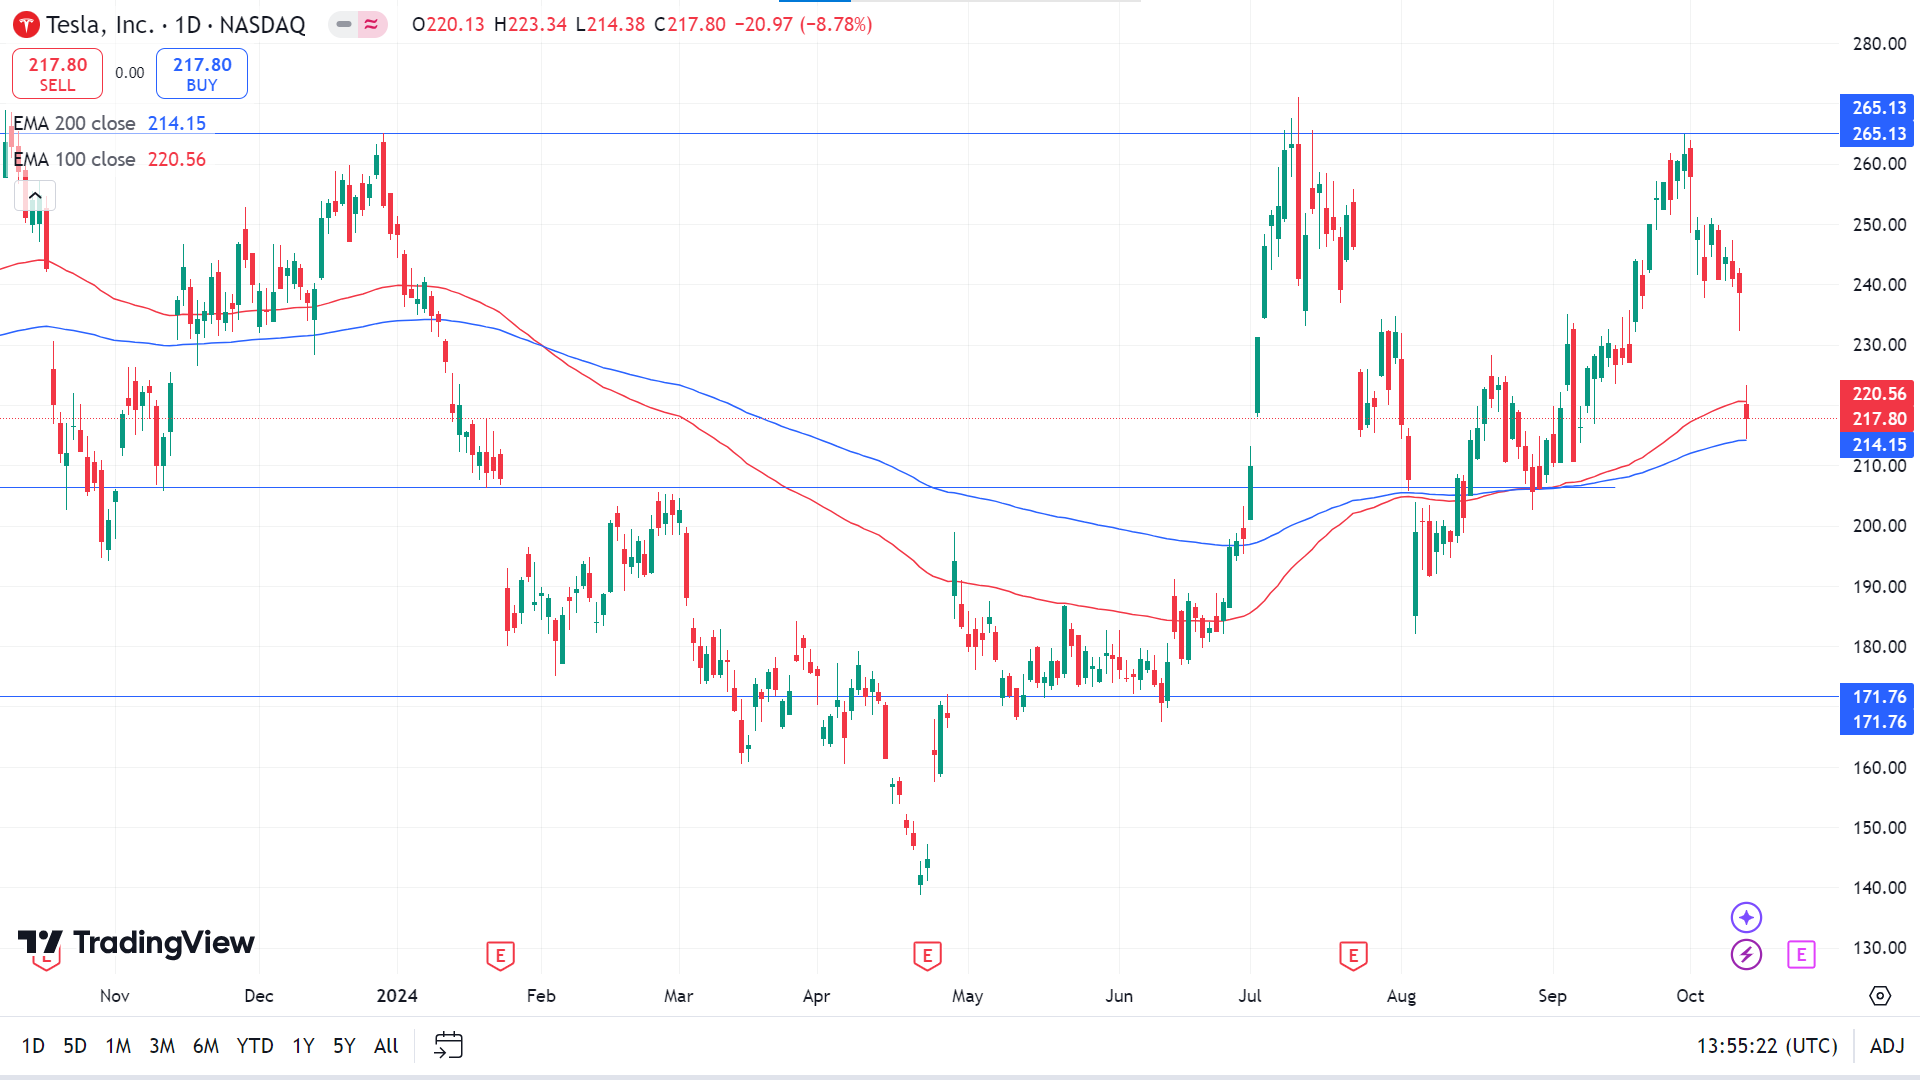
The price floats between the EMA 100 and EMA 200 lines on the daily chart, and the subsequent price direction comes beyond this range. If the assets show a valid bullish reversal from the near-term dynamic support area, it will trigger buyers to drive TSLA share price toward the primary resistance of 233.58, and a breakout may trigger the price to reach the next resistance near 265.13.
Meanwhile, if the price continues to decline below the EMA 200 line, it may reach the primary support near 195.47, followed by the next support near 171.76.
Nvidia Stock (NVDA)
Fundamental Perspective
After stellar gains in 2023 and 2024, Nvidia's stock has stalled over the past three months, with concerns about its AI growth prospects causing hesitation among investors. However, optimism remains for 2025, as analysts predict a significant rise in shipments of Nvidia's AI GPUs, driven by its next-generation Blackwell processors. Market research firm TrendForce forecasts a 55% increase in Nvidia's AI GPU shipments, with Blackwell accounting for 80%.
Additionally, Mizuho, a Japanese investment bank, has raised its estimate for Nvidia's 2025 shipments by 8%-10%, citing improvements in its supply chain. Taiwan Semiconductor Manufacturing (TSMC), Nvidia's key partner, plans to double its advanced packaging capacity, ensuring Nvidia can meet growing demand.
With Nvidia commanding up to 95% of the AI chip market, it stands to benefit from an AI chip industry projected to grow 38% annually through 2032. Despite its current valuation, Nvidia's impressive growth trajectory suggests it remains a substantial investment for the future.
Technical Perspective
The price posted consecutive gaining candles on the weekly chart, creating a valid bullish pattern that keeps buyers optimistic for the next week.
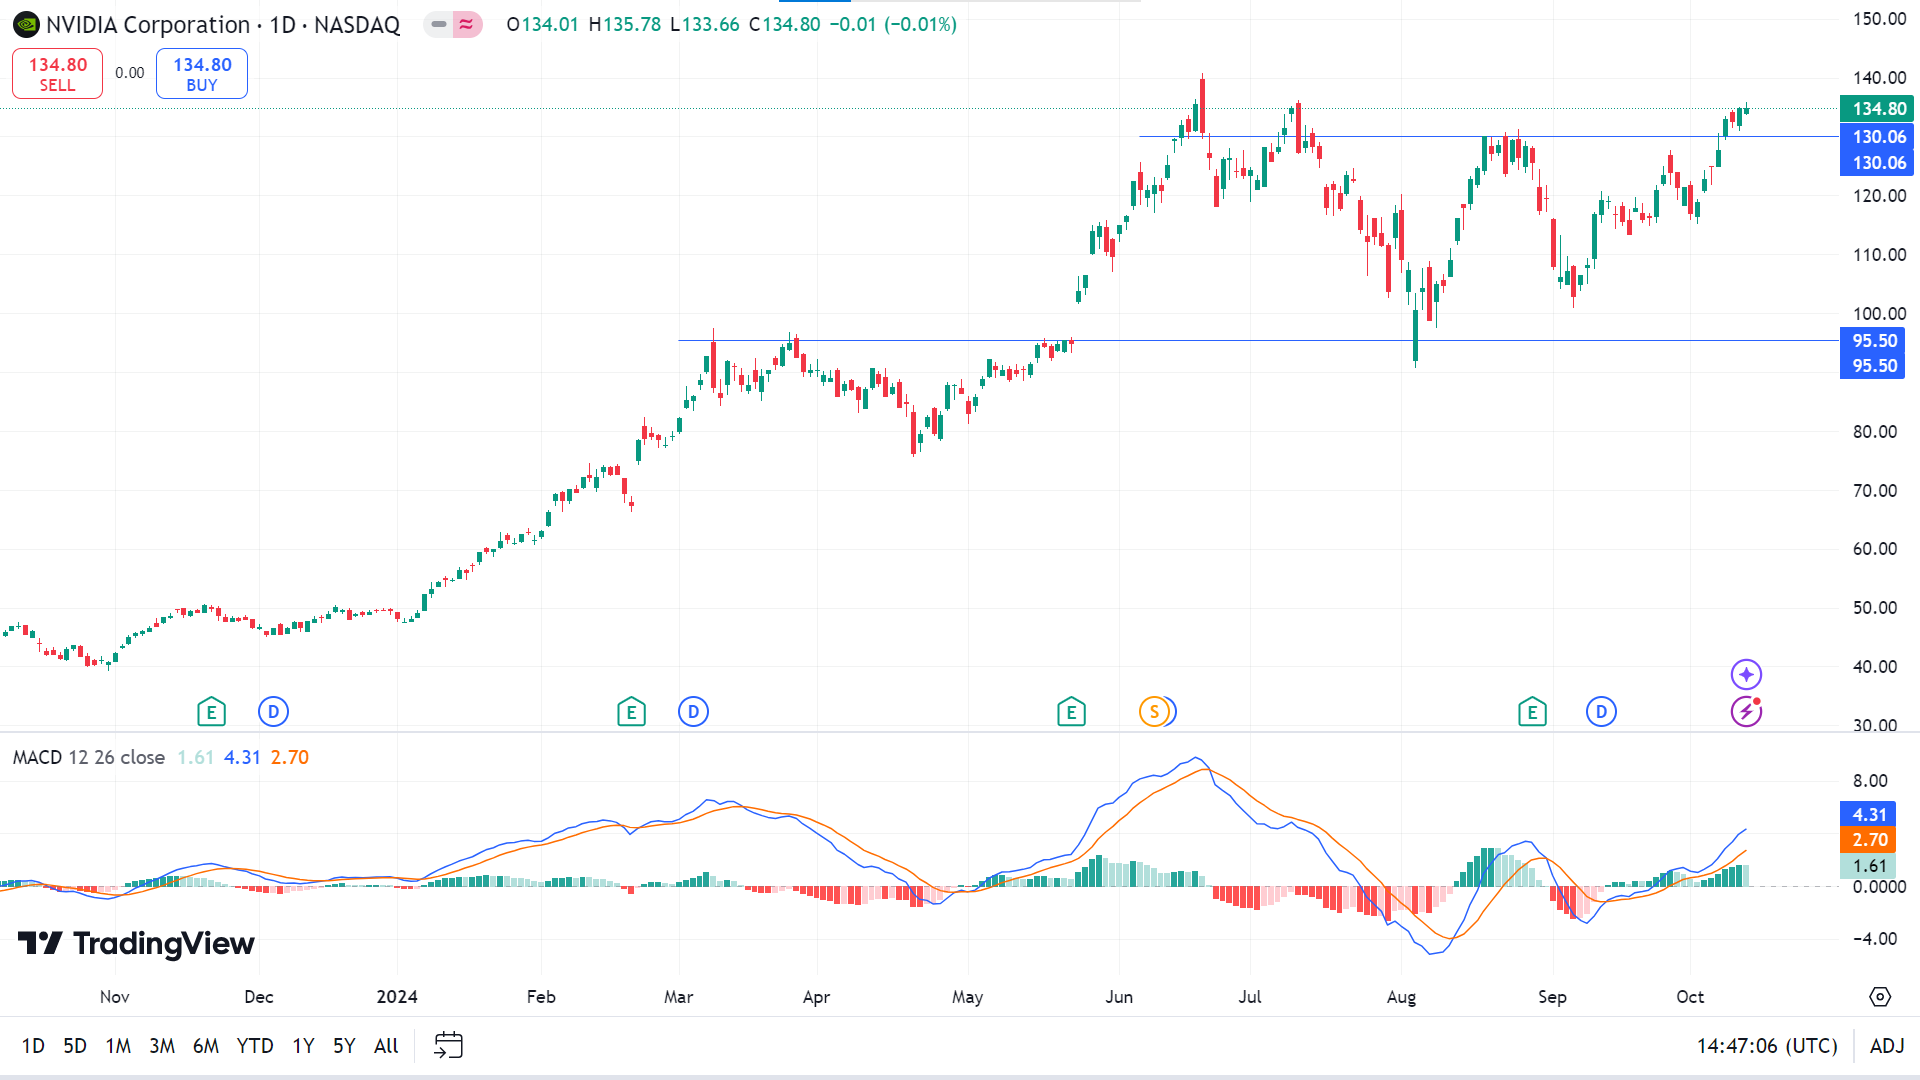
According to the MACD indicator reading on the daily chart, the price remains in a bullish trend. This indicates that the price may reach the primary resistance of 140.76, followed by the next resistance near 143.40.
Meanwhile, the green histogram bars fading at the MACD indicator window, indicating decreasing bullish pressure. Suppose the dynamic signal lines also slope downward at the MACD indicator window, declaring significant bearish pressure. In that case, the price may hit the nearest support of 130.06, followed by the next support near 116.39.
WTI Crude Oil (USOUSD)
Fundamental Perspective
Fears of a broader Middle East war disrupting oil supplies are balanced by disappointment over China's stimulus efforts, and OPEC+ plans to increase production, potentially setting the crude oil market up for a sharp price correction. Bart Melek, TDS' Head of Commodity Strategy, predicts that a surplus in early 2025, driven by weaker global demand and robust supply growth, could lead to significantly lower oil prices next year.
This week, crude prices have stabilized near $75, recovering after earlier declines as tensions rise between Israel and Iran. Israel has hinted at retaliation following a phone call between U.S. President Joe Biden and Israeli Prime Minister Benjamin Netanyahu, in which Biden advised against attacking Iran's oil infrastructure.
Meanwhile, Hurricane Milton's impact is being assessed in Florida, and oil platforms in the U.S. Gulf are preparing to reopen. The U.S. Dollar Index has retraced after reaching a peak on Thursday. U.S. shale oil prices remain around $66 per barrel, indicating steady production growth. Additionally, market attention is focused on the upcoming Baker Hughes oil rig count, following the previous reading of 479 rigs.
Technical Perspective
The weekly chart enables opportunities for buyers, as the price may bounce back from the bottom and enter a bullish trend. It has already posted two consecutive weeks of gains with support from fundamentals.
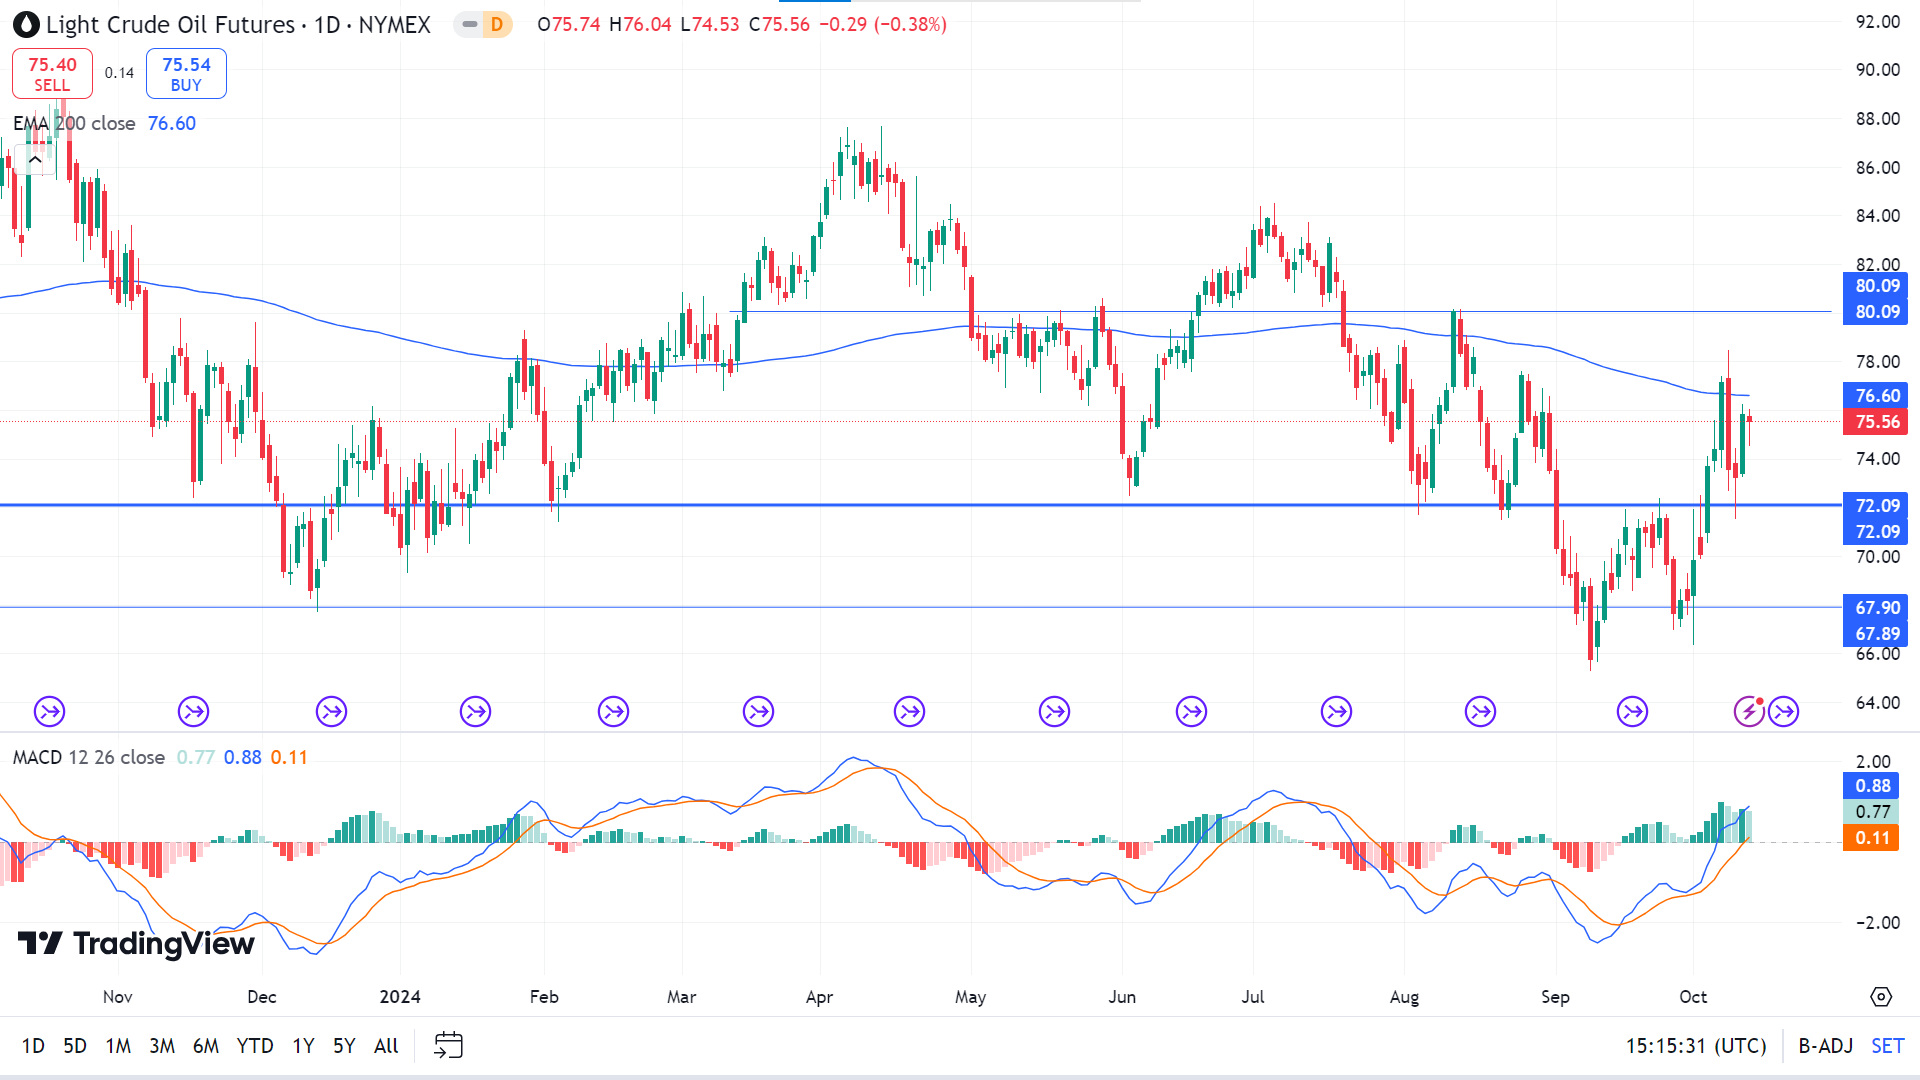
The price has entered a bullish trend, as the MACD indicator window confirms through signal lines and green histogram bars above the midline of the indicator window, but still floats below the EMA 200 line. If the bullish pressure is sustained and the price exceeds the EMA 200 line, it can hit the primary resistance of 80.09, and a breakout might trigger toward the next resistance near 84.57.
Meanwhile, if the price remains below the EMA 200 line and the MACD indicator reading turns bearish, the price may reach the nearest support near 72.09, followed by the next support near 67.90.


