EURUSD
Fundamental Perspective
The EURUSD price remained quite above the 1.0900 mark due to the lack of important events and the Thanksgiving holiday.
Eurozone data revealed economic improvement, with November PMIs beating expectations despite continued contraction. Therefore, the ECB was cautious, considering inflation and slower economic growth.
On the other hand, the US Fed mirrored similar concerns but noted strong economic expansion. Despite mixed US data, the US Dollar Index (DXY) weakened, driven by speculation and demand for high-yield assets. Inflation remains a key focus for DXY, with several important releases. The EUR/USD pair is expected to extend gains, but investors should monitor how the US Data comes, supporting the technical sentiment.
Technical Perspective
Source: TradingView
On the weekly timeframe, EURUSD showed a bullish continuation as the recent candlestick showed a new high formation, followed by a bullish reversal candle pattern.
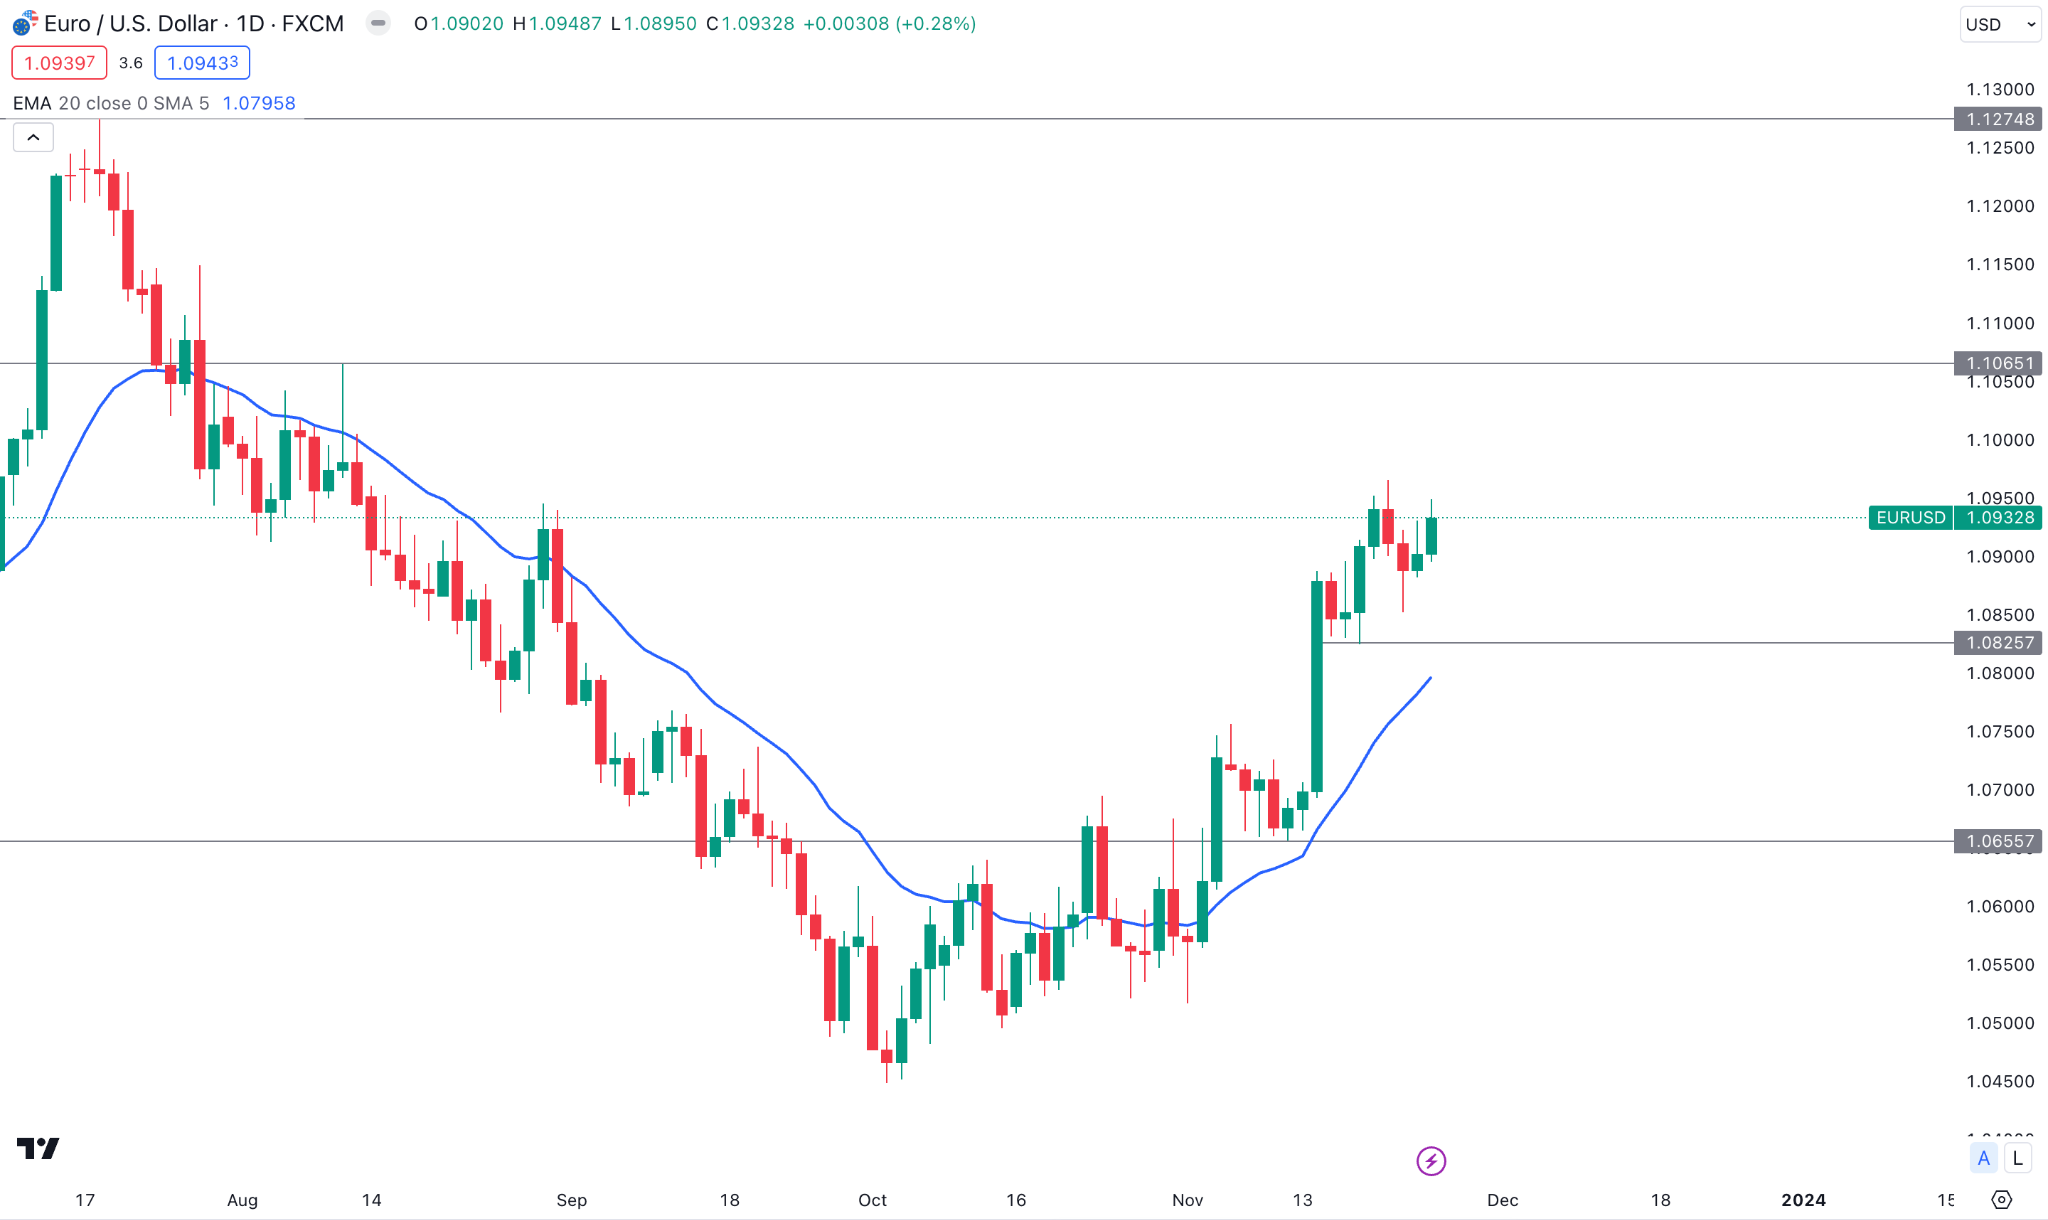
The daily chart shows a bullish trend extension as the current price stalls above the dynamic 20 EMA support. Moreover, a bullish accumulation at the bottom supports the current buying pressure. Moreover, the daily RSI supports bulls as the current reading shows an upward slope above the 50.00 line. The upward possibility is potent for this pair, where the main aim is to test the 1.1000 mark, which could open a long possibility towards the 1.,1274 level.
On the bearish side, a bearish daily candle below the 1.0825 low could be a short-term bearish signal, which could lower the price toward the 1.0655 support.
GBPJPY
Fundamental Perspective
The first half of 2023 showed a modest improvement in the UK mortgage approvals, rebounding from a January low of 39.6k. Last year's year-end slowdown resulted in a lower interest rate, wetting property demand and prices.
The lower energy cost helped the mortgage demand to peak at 54.6k in June. However, a summer rate spike led to a decline, hitting 43.3k approvals in September, the lowest in 2023. Recent housing data hints at consumer reluctance to buy homes despite a post-summer rate drop. However, this week's mortgage approval data could show more clues about the GBP, which will be disclosed before the Governor's speech.
On the other hand, the downside pressure in Yen is still valid, where the current employment forecast remains unchanged at 2.6%.
Technical Perspective
Source: TradingView
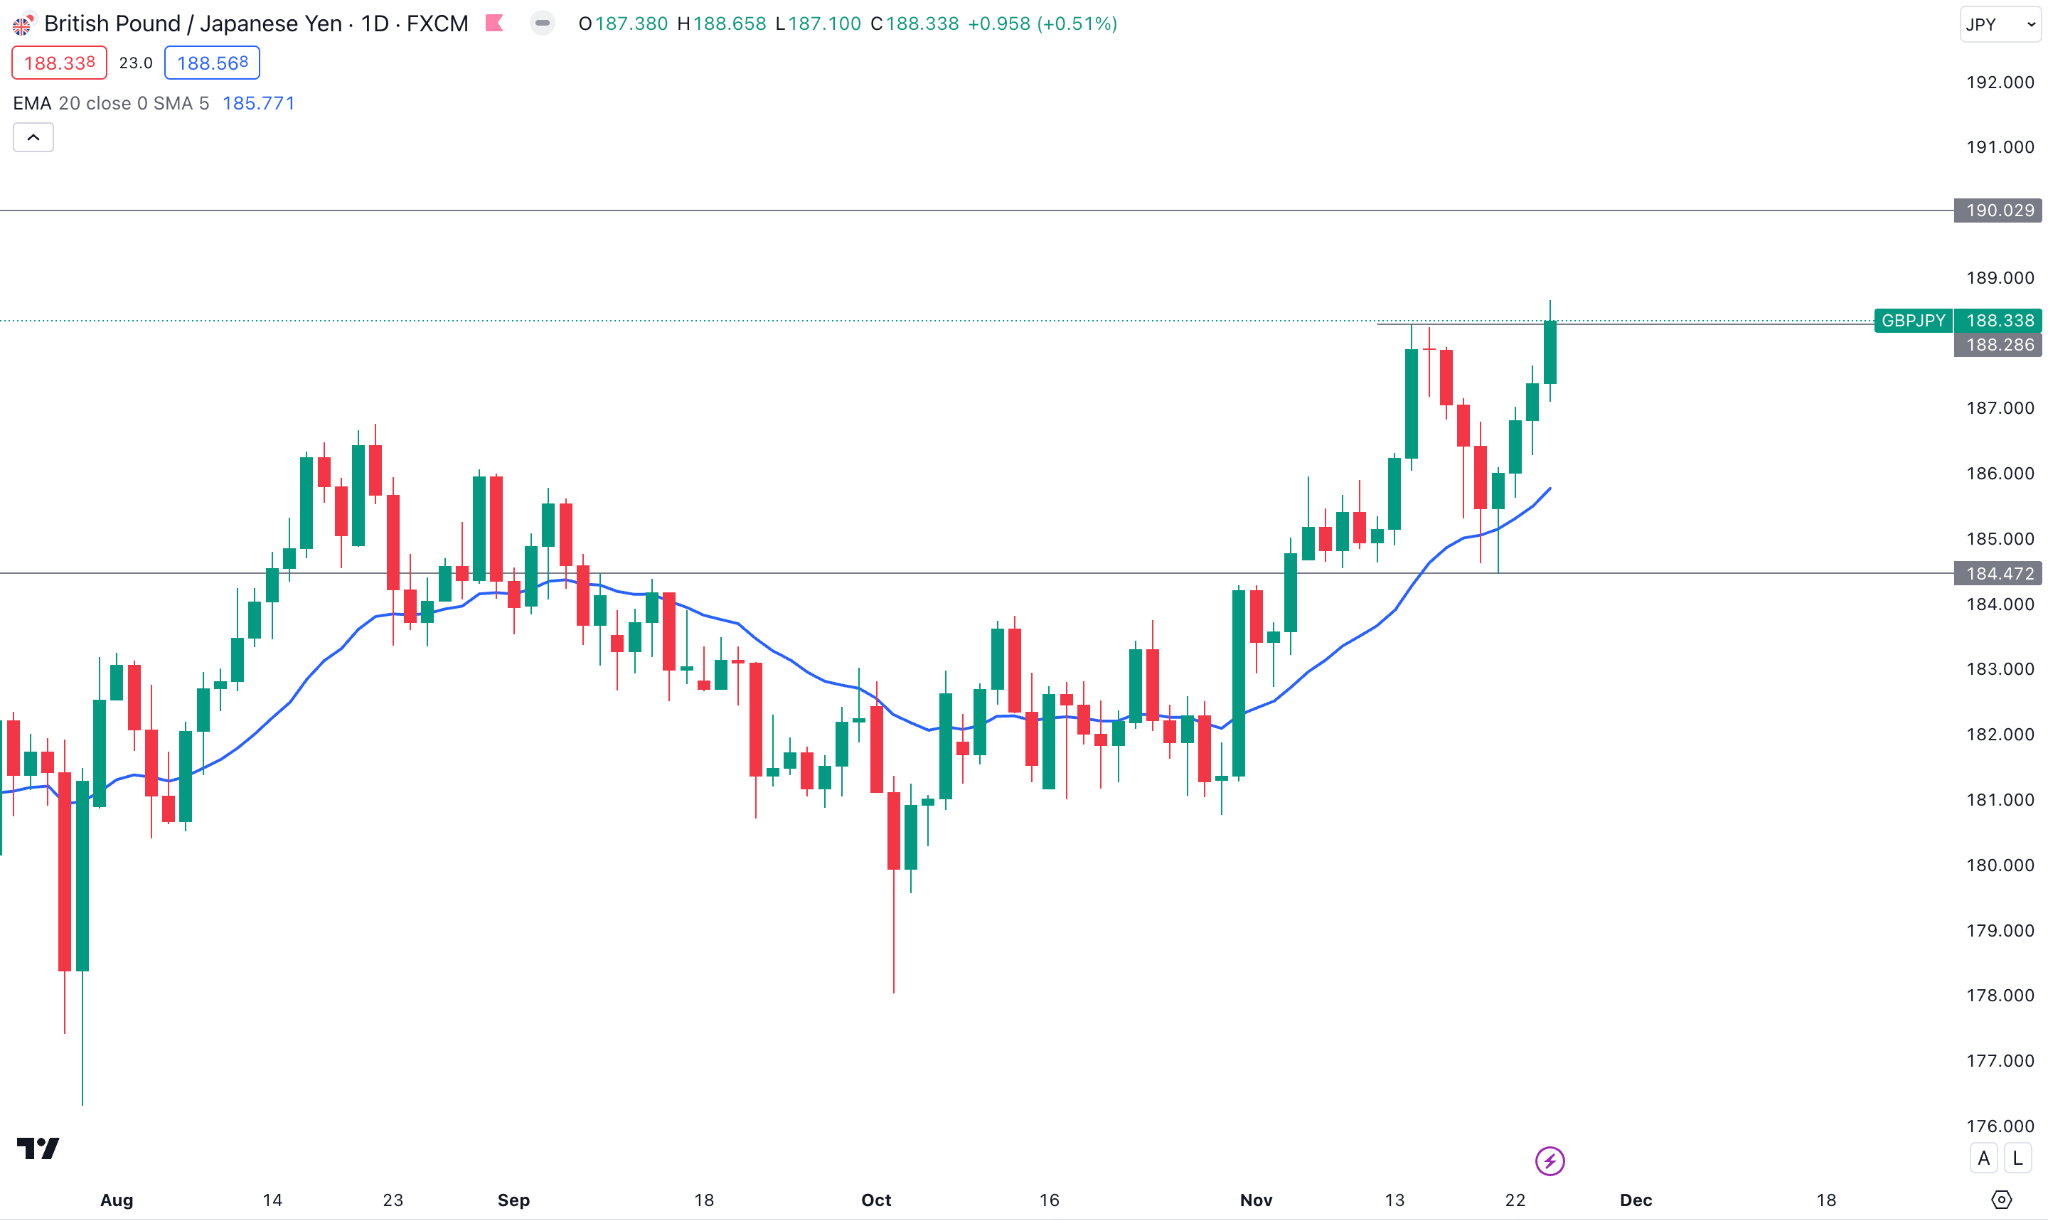
On the weekly chart, the latest candle shows an elimination of bears as the closing price appeared above last week's high with a long wick on the downside. However, the bullish breakout above the 188.26 high is not potent as last Friday's close is not much higher from that particular point.
A bullish continuation is potent as the dynamic 20 EMA is working as a support level with an upward slope. Moreover, the Relative Strength Index (RSI) shows a bullish continuation as the current reading is just below the overbought 70.00 level. Therefore, a bullish continuation may come in this week, where the main aim is to test the 190.00 static level.
On the bearish side, investors should monitor how the price reacts at the 188.26 high, as a failure to hold the price above this number could be a short opportunity.
Nasdaq 100 (NAS100)
Fundamental Perspective
The minutes of the November meeting by the Federal Reserve underscored a cautious approach among policymakers in shaping monetary policy. The Federal Open Market Committee (FOMC) is currently fine-tuning its tightening cycle and remains prepared to make adjustments as necessary to steer inflation. Investors should monitor how the Fed reacts regarding the rate decision as an indication of a cut could be a bullish factor for the US Stock market.
Nasdaq 100 approaches several high-impact releases this week as the earnings session is active. Some significant companies are- Salesforce (CRM), BHP Group Limited (BHP), and Marvel Technologies Inc (MRVL),
Technical Perspective
Source: TradingView
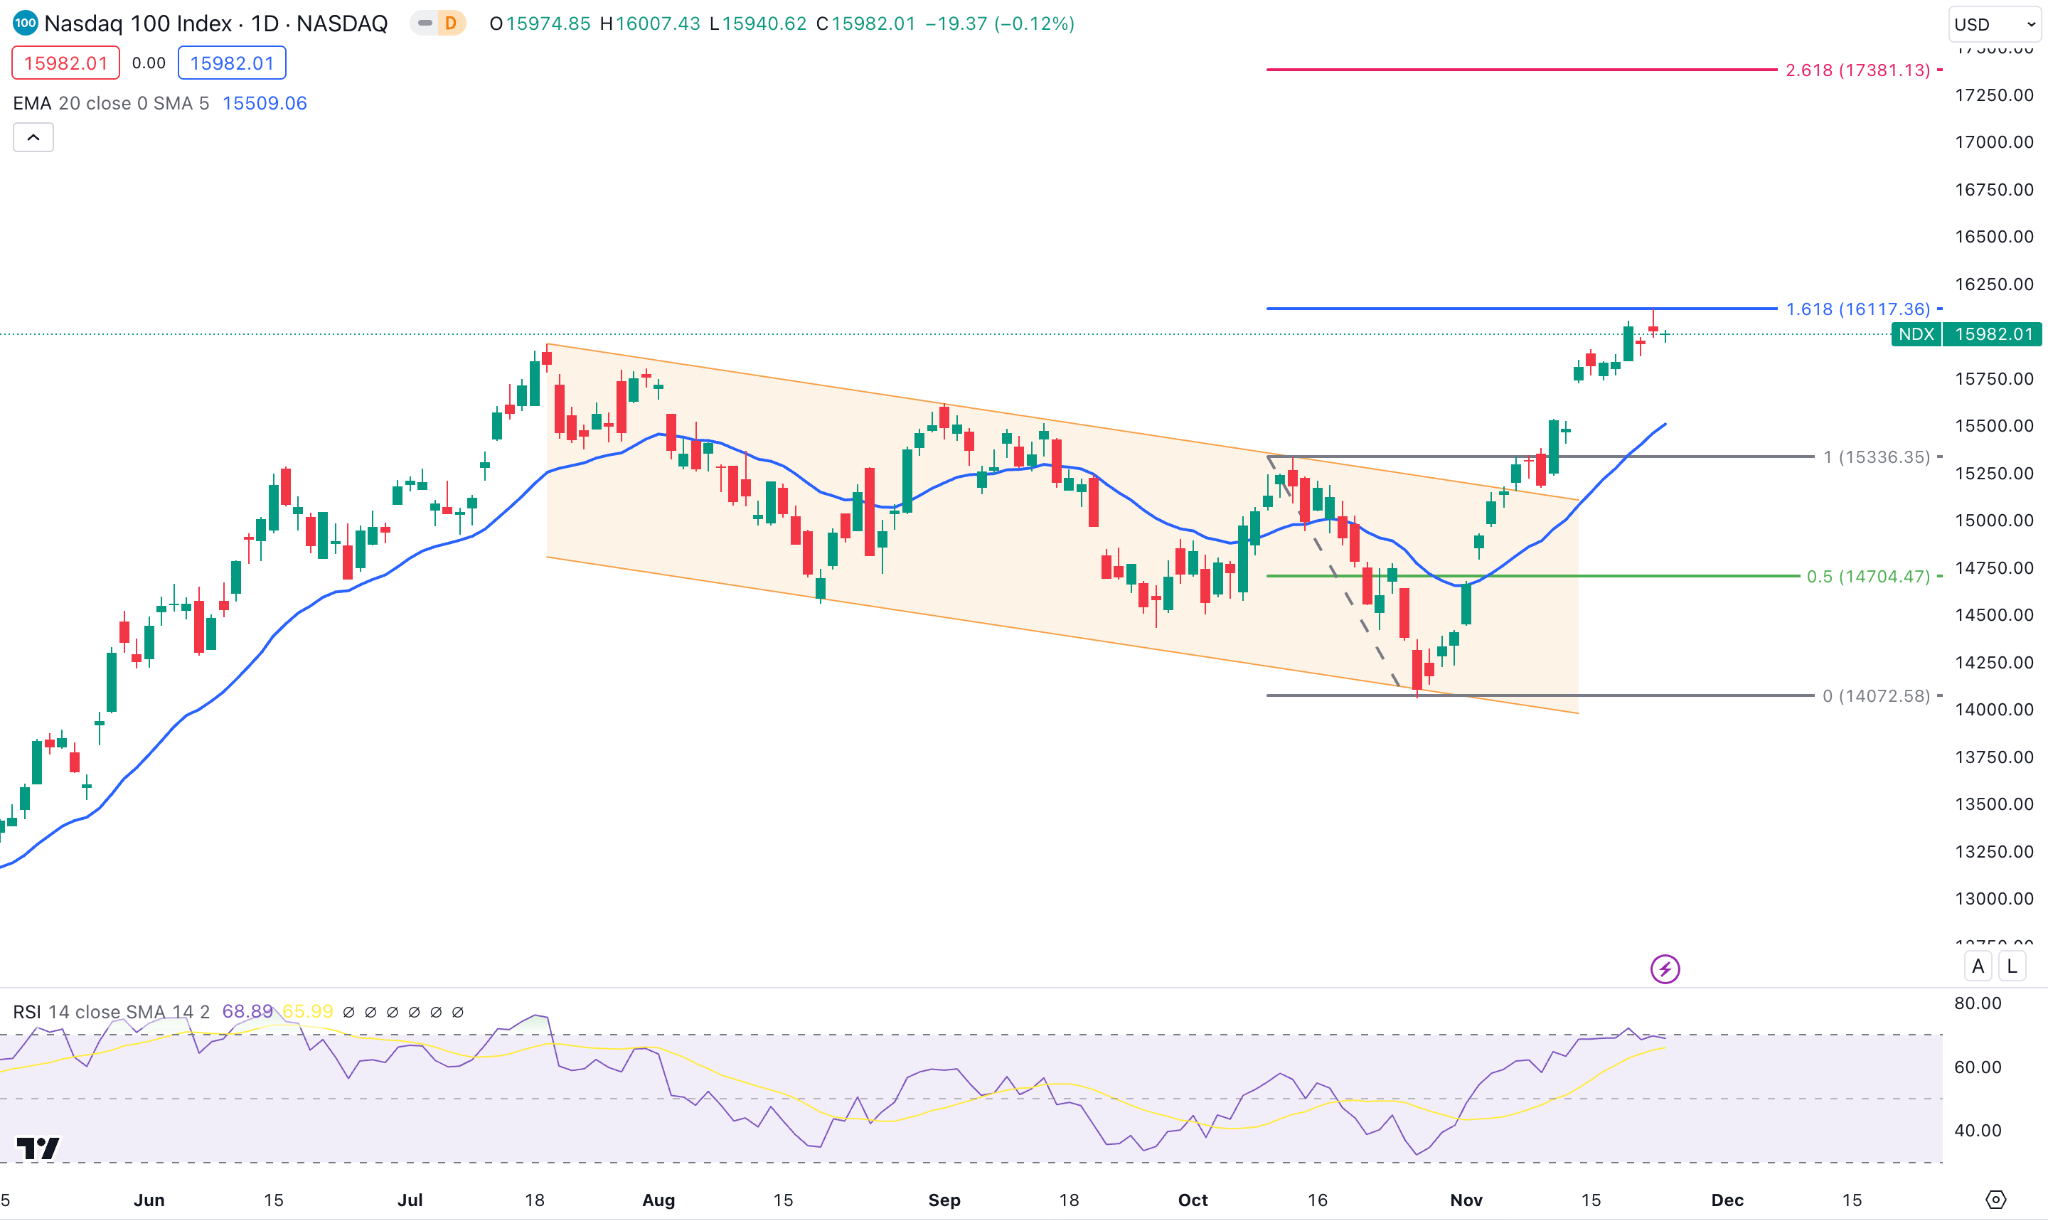
On the weekly chart, the NAS100 bullish continuation is present as the recent price formed four consecutive green candles. Moreover, the bullish pressure is valid as the recent price trades within a descending channel breakout.
The daily chart shows the recent upward pressure at the top from the 161.8% Fibonacci Extension level at the 16117.36 resistance level. As the current price stalls at the crucial zone, investors should monitor how the price reacts above this area. Primarily, a bullish Daily close above the 16200.00 level could be a long opportunity in this instrument.
On the bearish side, investors should find a bearish daily candle below the dynamic 20 EMA, which could open a short opportunity, targeting the 14704.05 level.
S&P500 (SPX500)
Fundamental Perspective
The stock and bond markets were closed on Thursday for the Thanksgiving holiday and closed early on Friday. Traditionally, the fourth quarter is associated with robust stock returns, often called a "Santa Claus rally."
Throughout 2023, long investors experienced a gain, with the S&P registering an almost 20% increase since January. Major contributors to this gain are Mega-cap tech stocks, including Apple, Microsoft, and Nvidia.
If stocks can maintain their recent momentum and achieve new highs, analysts from Goldman Sachs, Morgan Stanley, and UBS project a modest gain in the S&P by the end of 2024. According to Bank of America analysts, the index could reach 5,000 next year, surpassing the 4,796.00 peak.
Technical Perspective
Source: TradingView
The weekly S&P 500 price shows a slower bullish extension, while the broader market trend remained bullish.
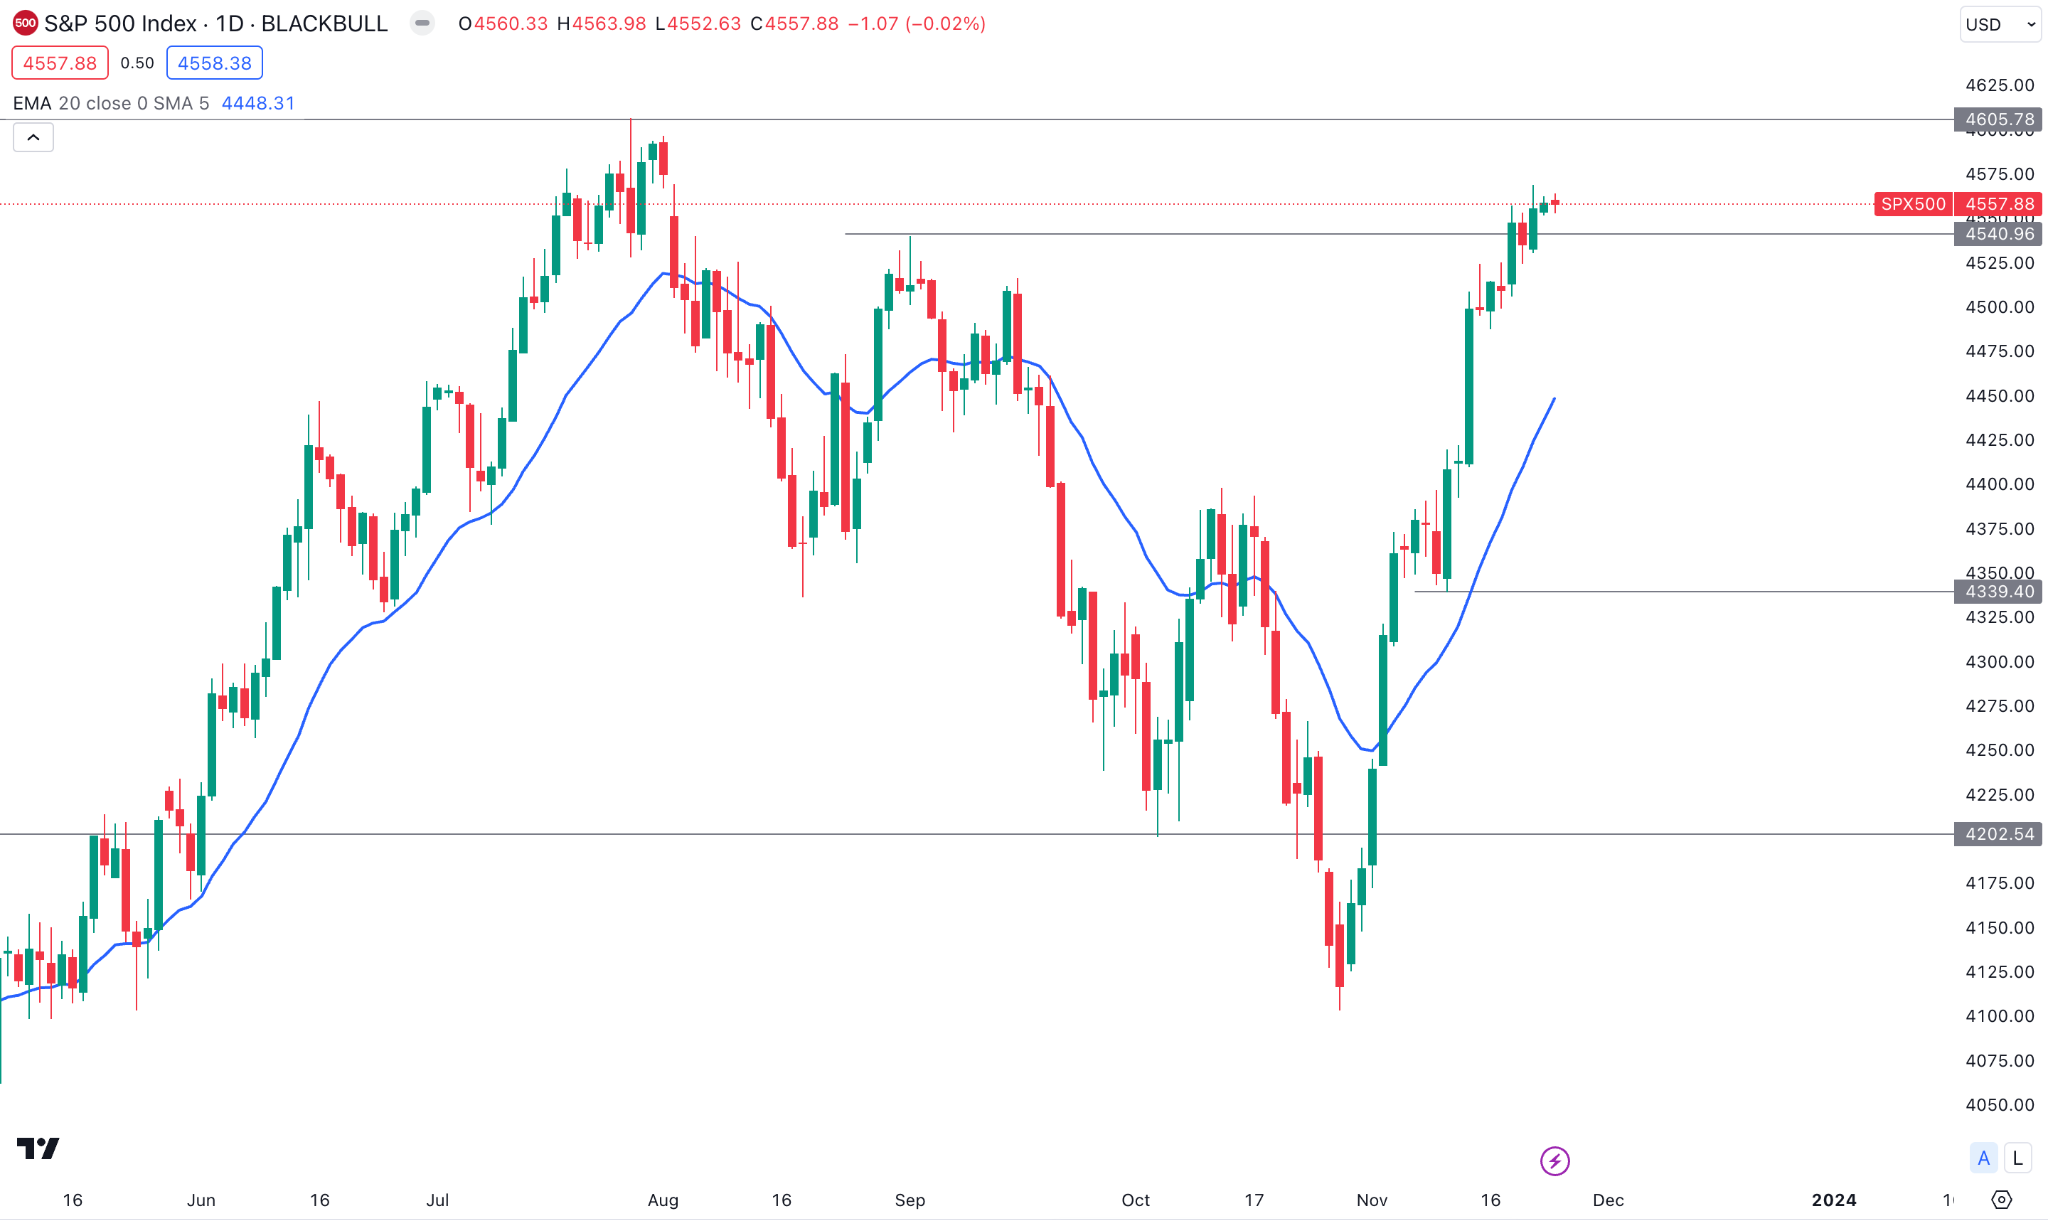
On the daily chart, a bullish daily candle is present at the 4540.06 static level, but no significant upward pressure is seen. In that case, a downside correction with a bearish D1 candle below the 4510.87 level could be a short opportunity.
On the bullish side, a range extension and a bullish rejection from the 4550.00 to 4500.00 could be a long opportunity, targeting the 4800.00 level.
HK50
Fundamental Perspective
On Friday, the HK50 experienced a significant decline of 351.42 points at 17,559.43, led by the tech and consumer sectors. Concerns about an uneven economic recovery before October's Chinese PMI data, following September's factory activity report, were major reasons for the loss.
Moreover, traders expressed growing uncertainty regarding Beijing's strategies to encourage high-risk developer lending. Notable declines in HK50 were observed in Chow Tai Fook Jewellery (-10.0%), Zhongsheng Group (-6.6%), Wuxi Biologics (-4.6%), China Resources Beer (-4.2%), Geely Auto (-3.4%), and Xiaomi Corp. (-3.1%).
Technical Perspective
Source: TradingView
On the weekly timeframe, the price closed sideways above last week's open. Moreover, the overall weekly direction is bearish, where the recent candlestick formation shows a corrective momentum.
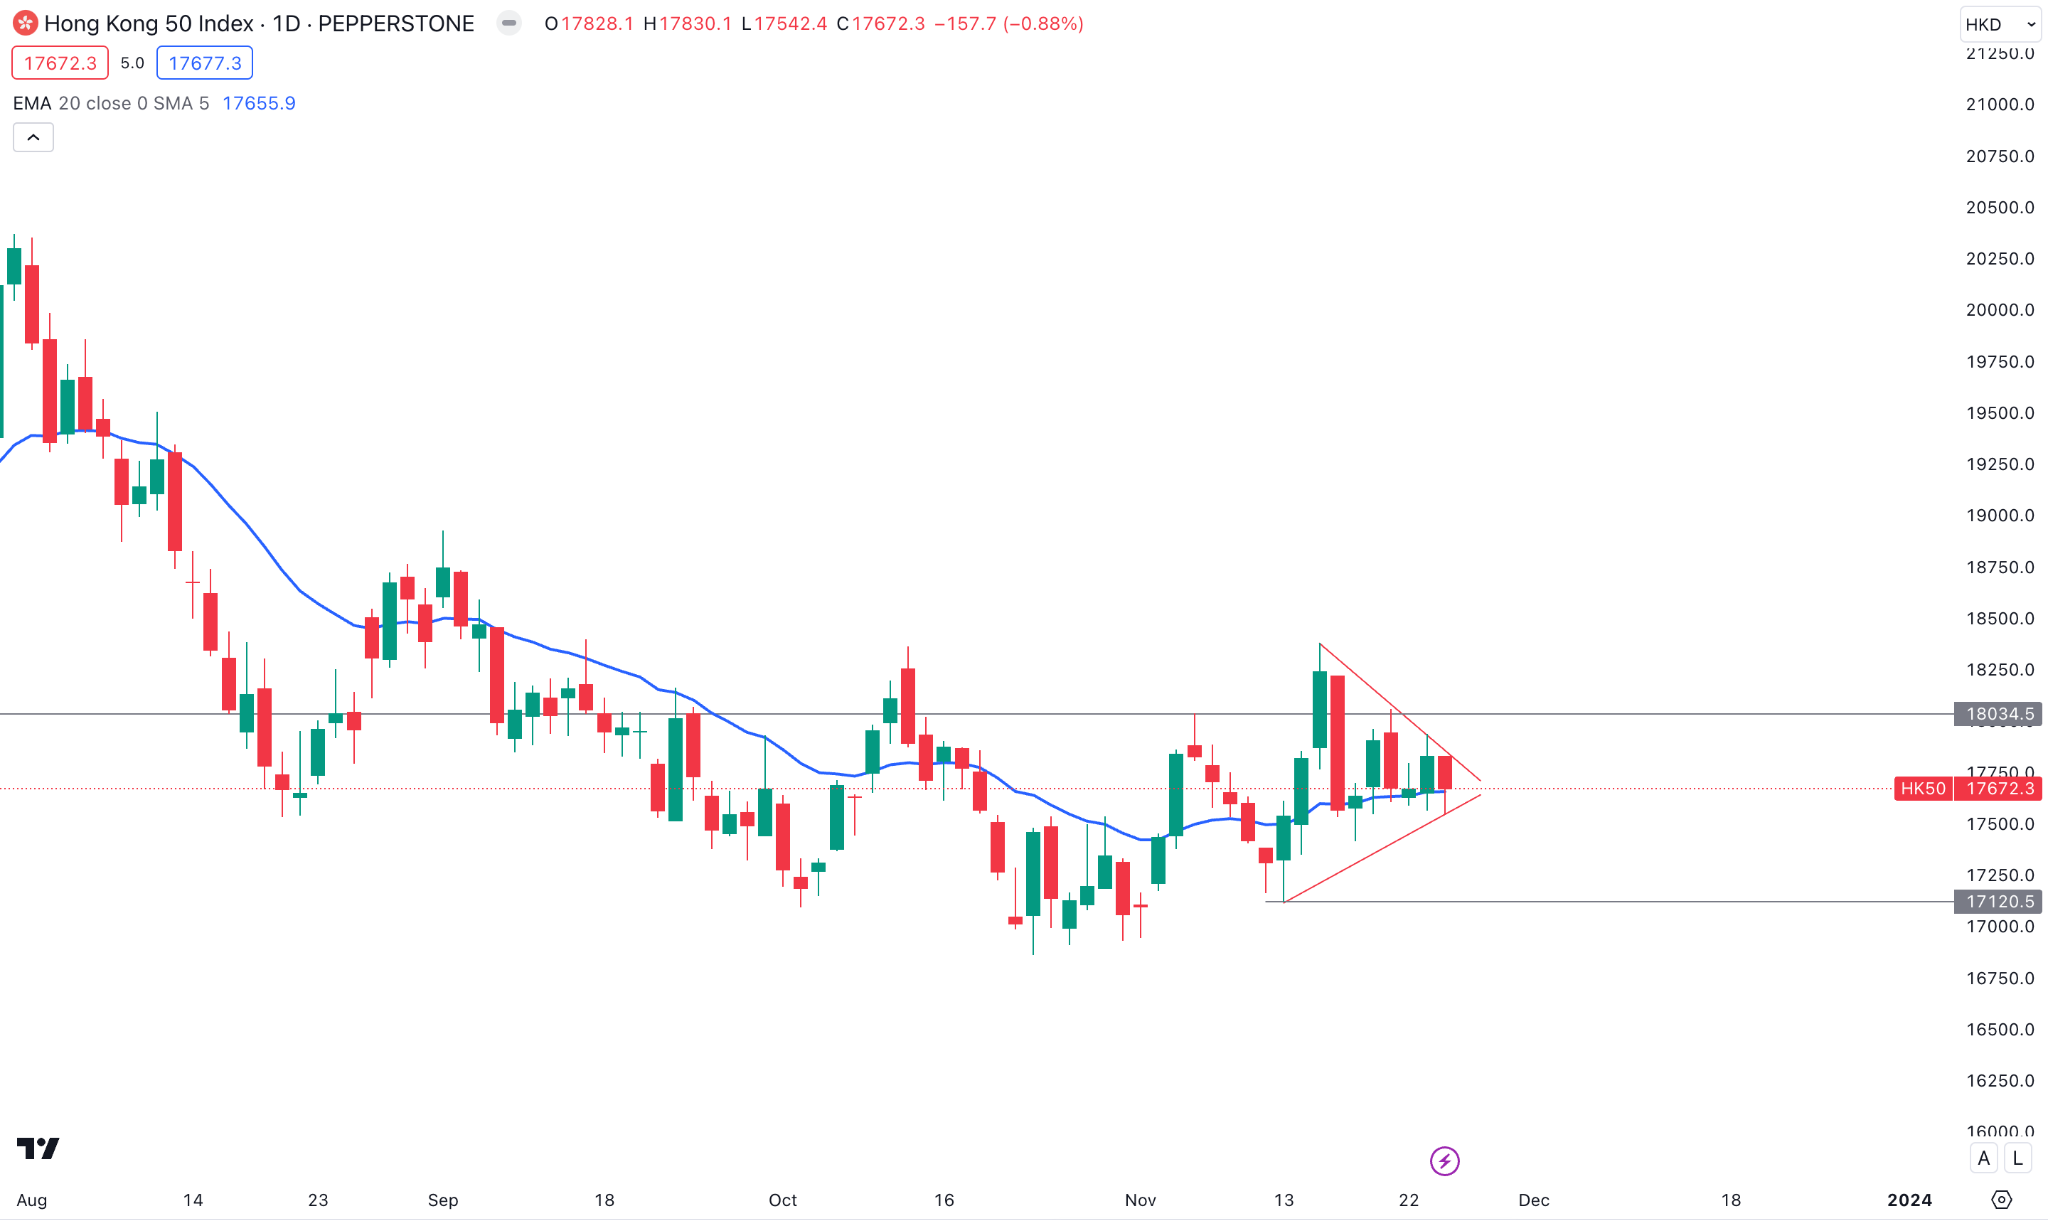
As per the current price action on the daily chart, HK50 needs a breakout from the symmetrical triangle pattern, where a bearish break could provide more profit possibilities. In that case, a daily close below the 17407.70 level could be a bearish opportunity, targeting the 16800.00 level.
On the bullish side, if the price closes above the 18034.50 level, we may expect the upward pressure to extend towards the 18800.00 level.
Bitcoin (BTCUSD)
Fundamental Perspective
The weekend commenced with BTC trading within the $500 range due to the absence of BTC-spot-ETF-related updates. Now, investors should wait for the second deadline for the Hashdex and Franklin Bitcoin ETFs on January 1, 2024.
Moreover, investors will wait for the SEC's approval of BTC-spot ETFs in stages, with the third deadline of January 15, 2024, for five BTC-spot ETF applications. However, mid-January might be premature, leading to additional discussions between the SEC and BTC-spot ETF applicants on aspects like cash creation and in-kind for creation/redemptions.
As of now, the bull run from the ETF approval has taken the crypto market cap to 1.4 trillion, which needs a moderate correction in the technical chart as profit-taking.
Technical Perspective
Source: TradingView
On the weekly timeframe, the BTC price traded indecisive for two consecutive weeks, which suggests more clues from the fundamental perspective.
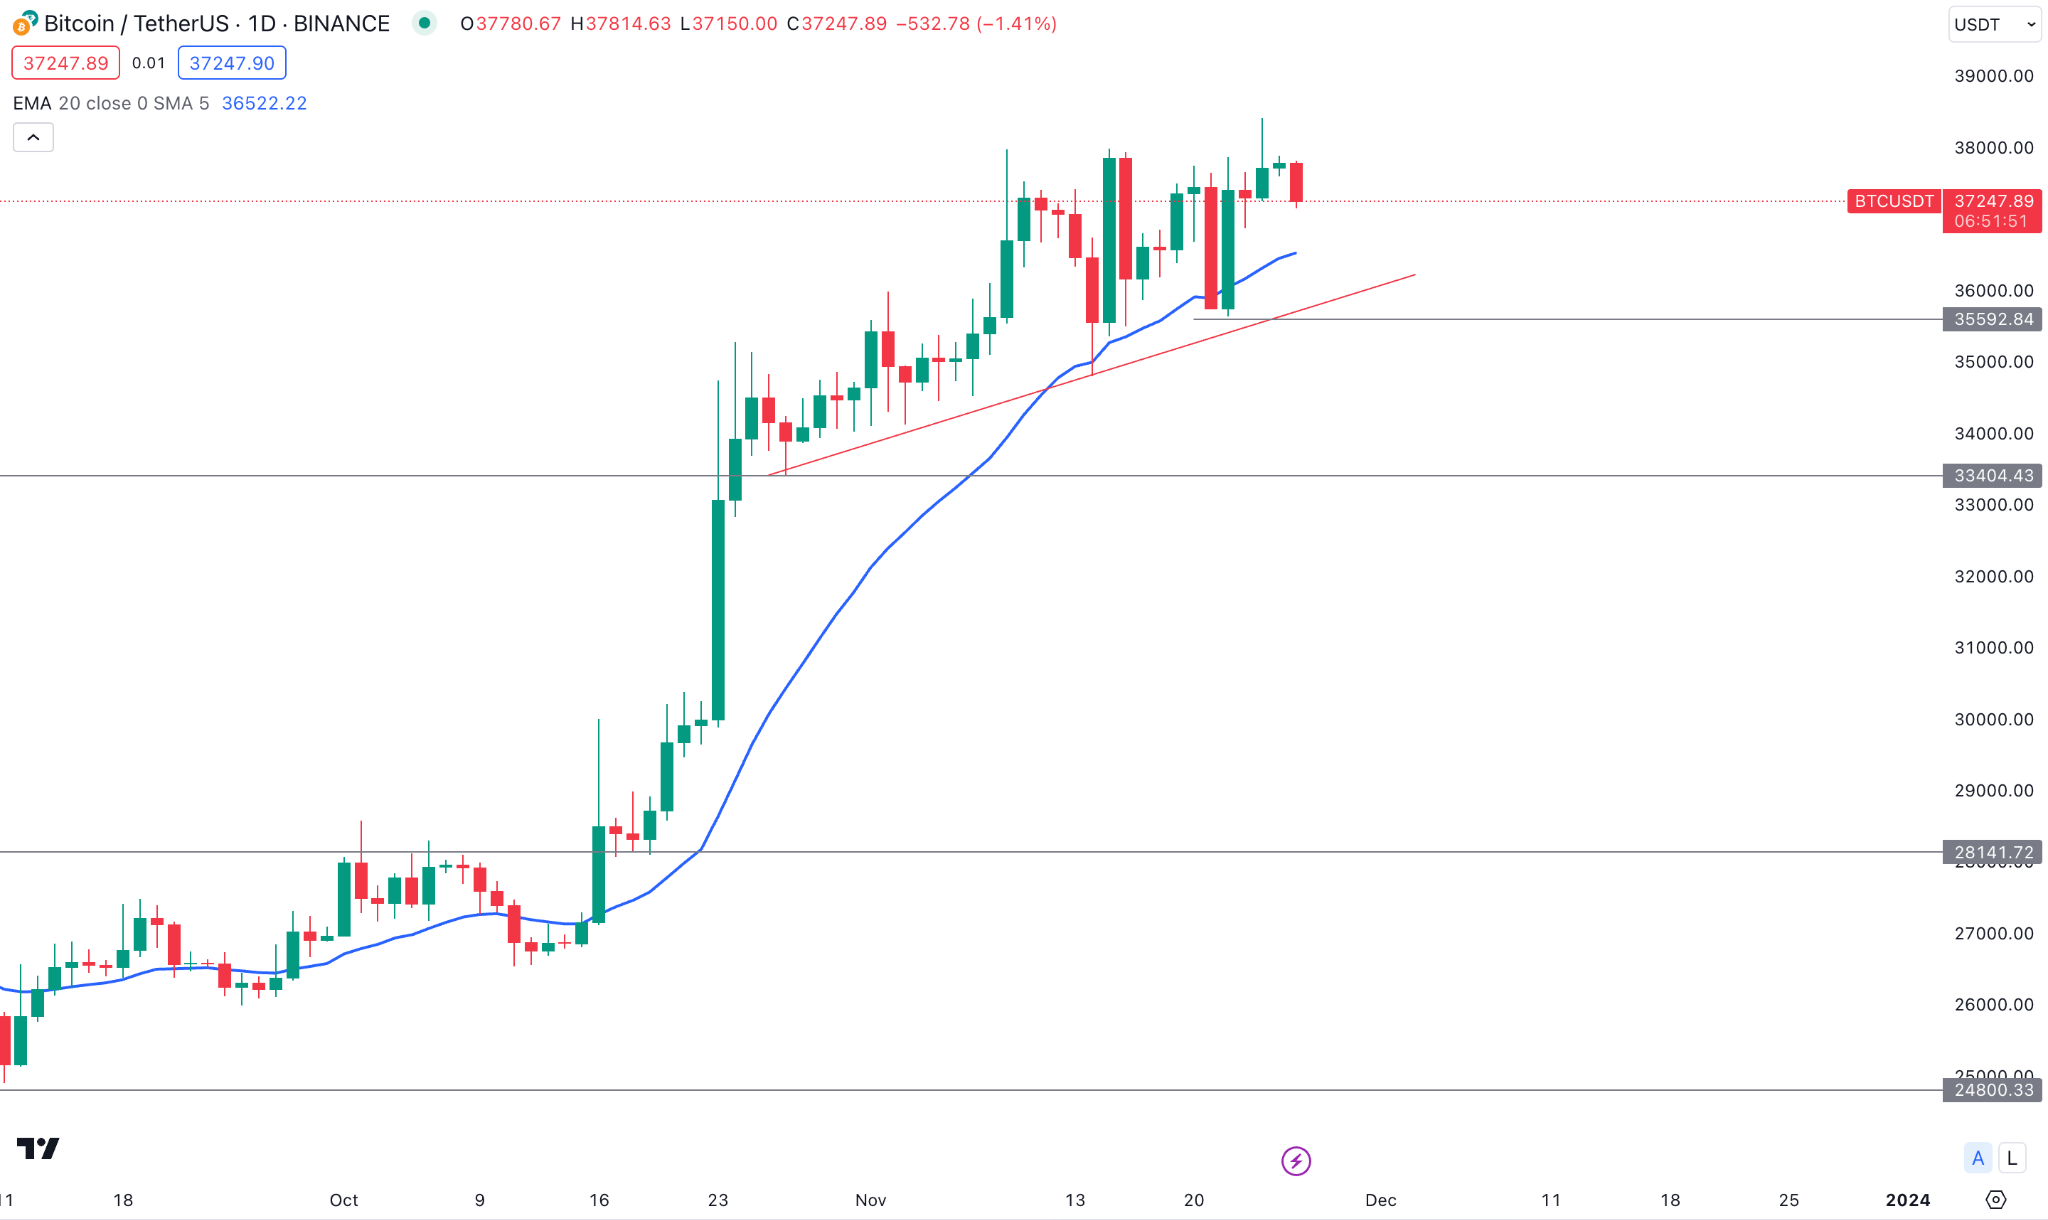
On the daily chart, the upward pressure is present above the rising trendline support, which could extend the momentum after having a solid bullish rejection from the 20 EMA.
On the bearish side, a stable bearish pressure is needed below the 35592.35 level, which could lower the price toward the 33404.00 level.
Ethereum (ETHUSD)
Fundamental Perspective
ETH price extended the upward pressure by 2.5% in the past week, with a 0.5% increase in the market capitalization. The main price driver for the price surge was the improved decentralized applications (DApps) metrics, higher protocol fees, and Ethereum Network's dominance in the NFT market.
Last week, Ethereum's DApps achieved a $26 billion total value locked (TVL), representing a 5% increase from the previous week. As a result, Ether's market cap reached $248 billion compared to Bitcoin's $728 billion.
Moreover, Ethereum also regained its position in NFT sales, reaching $12.6 million transactions in a day.
Technical Perspective
Source: TradingView
The weekly ETHUSD price went sideways, followed by a bullish impulsive candle, which could work as a continuation opportunity.
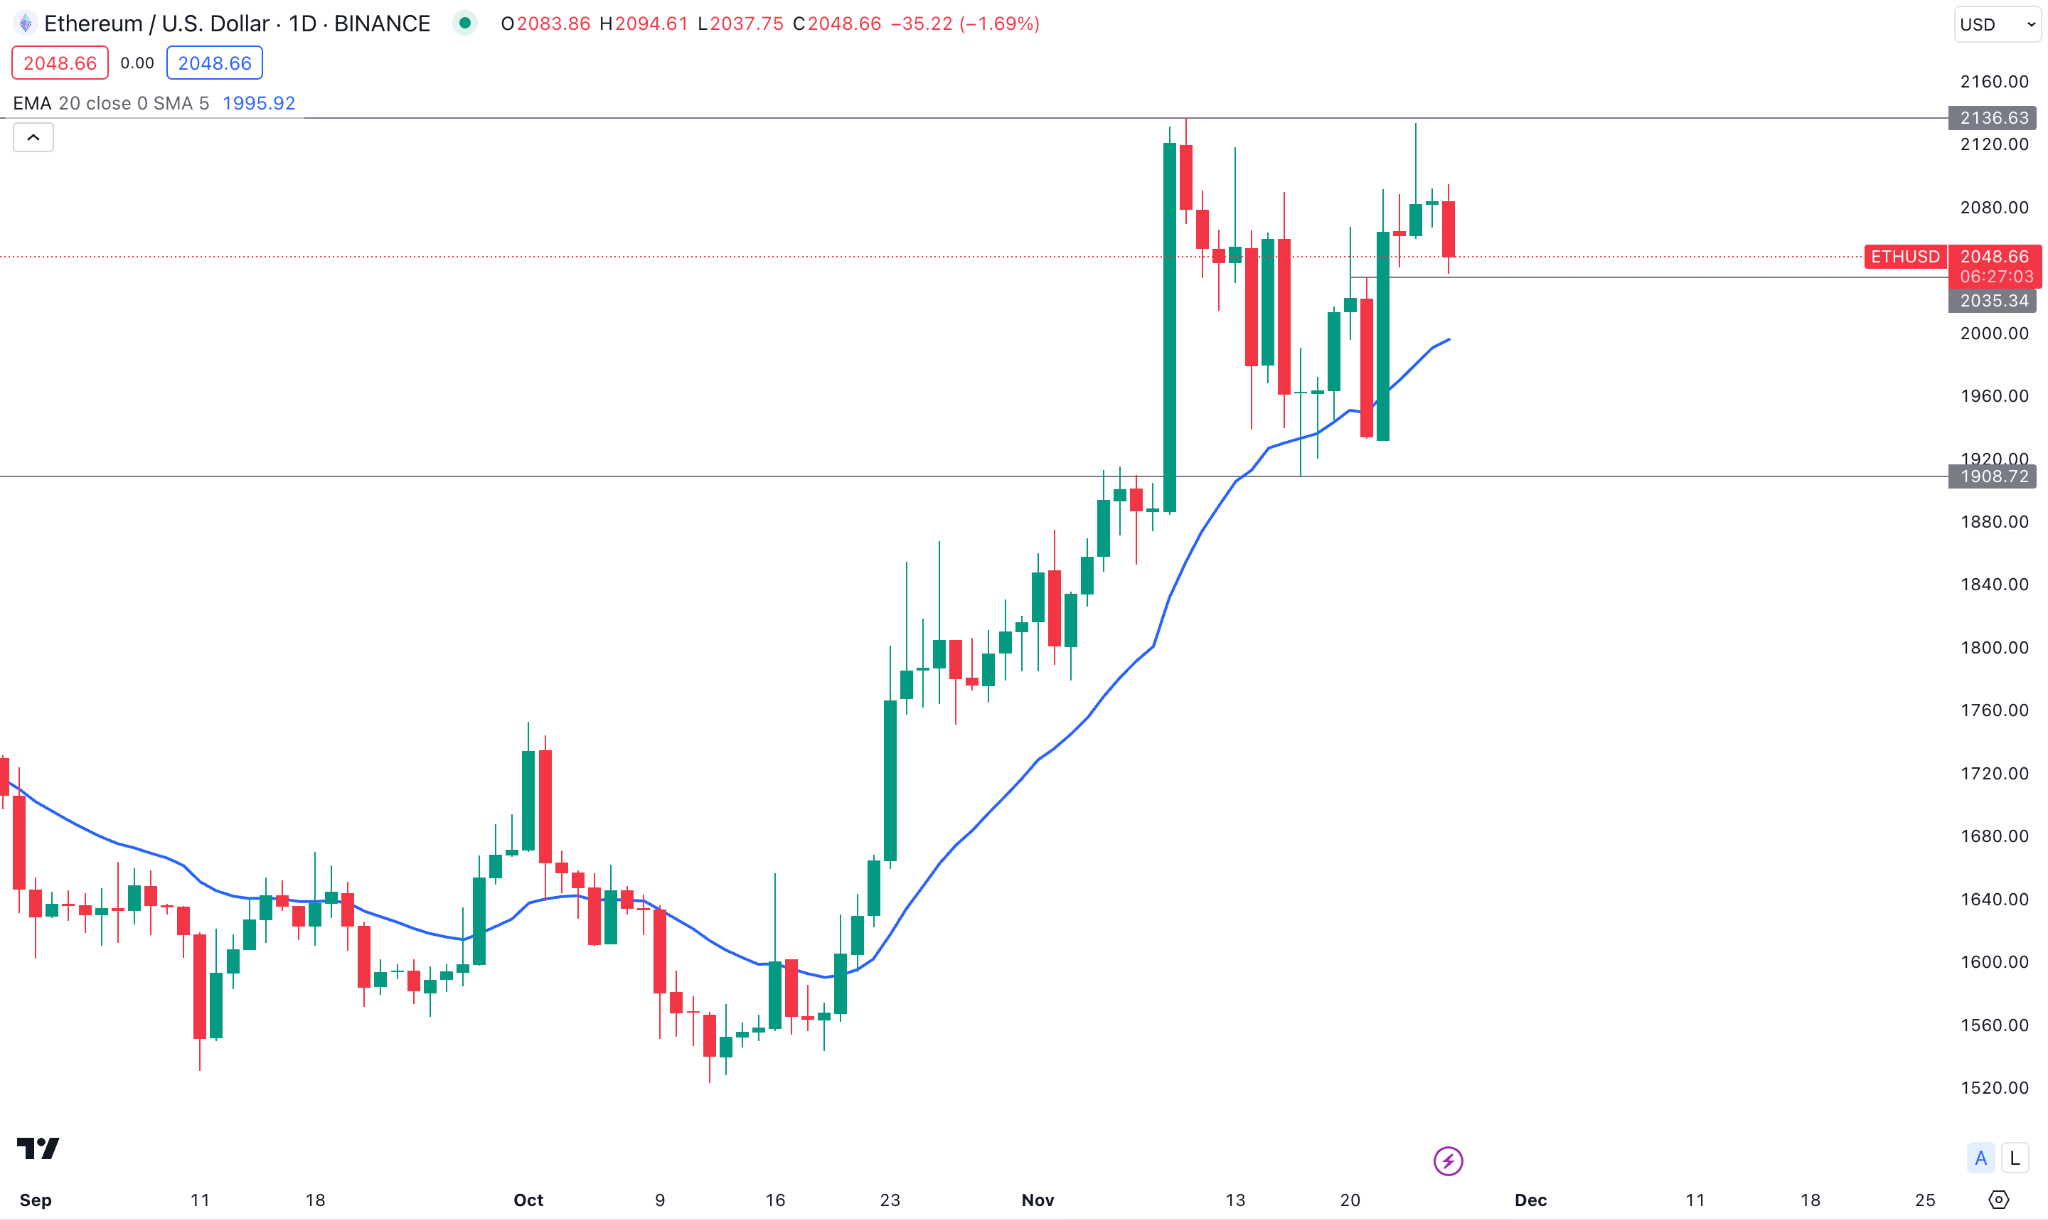
On the daily timeframe, strong volatility is seen at the resistance level, while the broader market is still above the dynamic 20 EMA. in that case, a bullish rejection from the 2000.00 to 1908.74 area could be a long opportunity.
On the bearish side, a strong bearish daily close below the dynamic 20 EMA could be the first sign of a trend reversal.
Tesla Stock (TSLA)
Fundamental Perspective
After a dip in post-third-quarter earnings, Tesla (TSLA) stock is rising ahead of the Cybertruck delivery event, although uncertainties linger about meeting the ambitious 2023 goal of delivering 1.8 million vehicles.
After the disappointing Q3 financials on Oct. 18, Tesla's near-term strategy is questionable as analysts pondered a stagnant EPS in 2024. Overall, Tesla Stock (TSLA) has gained ground in November, anticipating Cyber Truck deliveries. Investor focus remains on whether Tesla can align new vehicle launches, including the Cybertruck, with meeting consensus EPS estimates.
Technical Perspective
Source: TradingView
On the weekly chart, TSLA stock trades sideways at the 20-week resistance level, which indicates a strong bullish continuation opportunity.
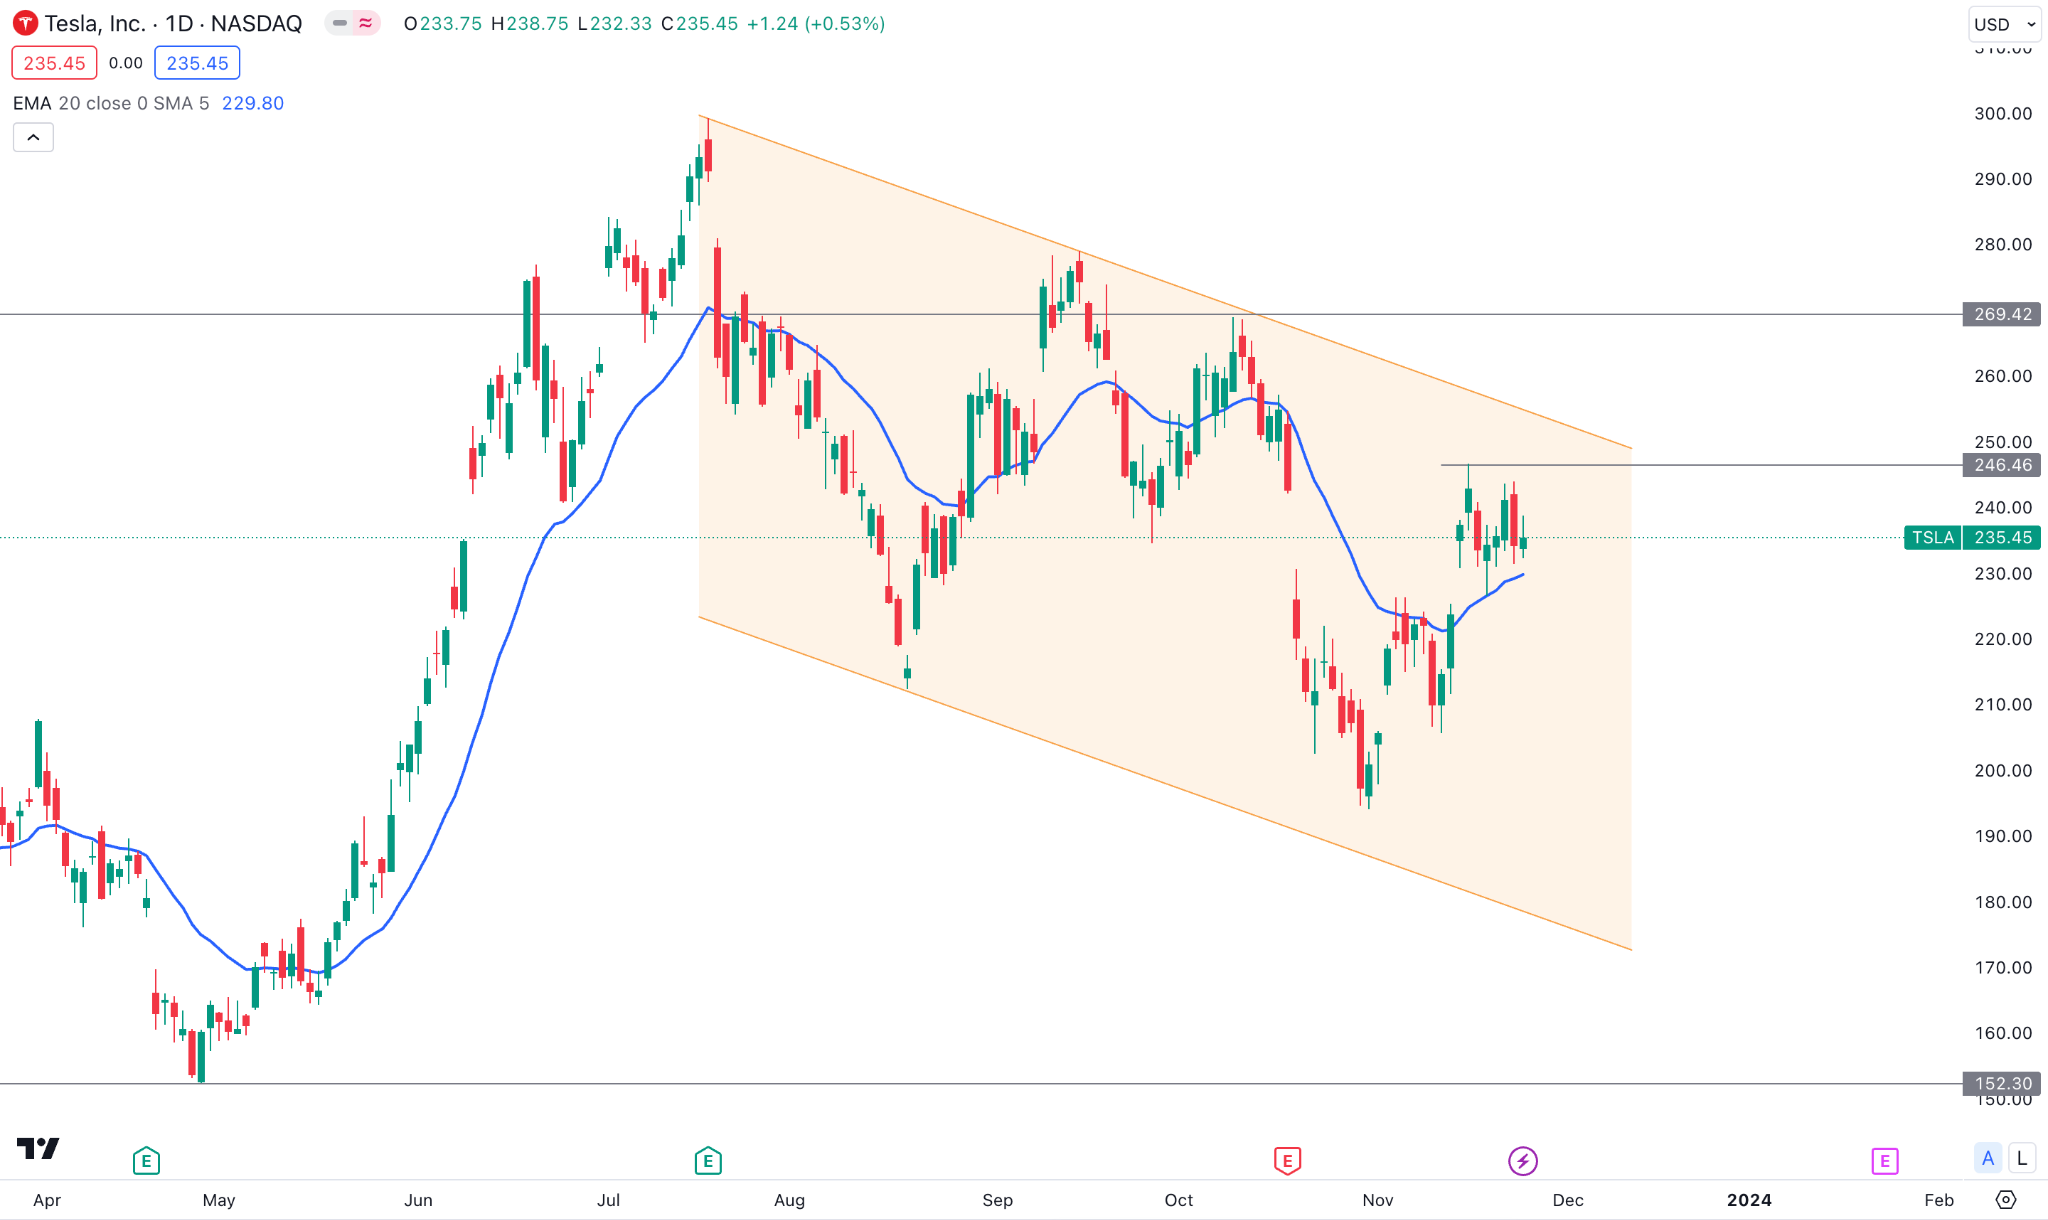
On the daily chart, the broader market is trading within an ascending channel, with a bullish continuation above the dynamic 20 EMA. in that case, a daily close above the 246.46 level could be a long opportunity, targeting the 280.00 level.
However, a deeper discount is possible, where a daily candle below the 20 EMA could be a short opportunity, targeting the 190.00 level.
GOLD (XAUUSD)
Fundamental Perspective
Gold's November highs were surpassed by $2,000, a result of lackluster demand for the US dollar notwithstanding hawkish Federal Reserve remarks. The potential tightening was alluded to in the minutes if inflation progress fails to meet expectations.
However, market anticipations for a rate cut in June remained unaltered, taking into account data that preceded a CPI softening. A decline in applications for unemployment benefits in the United States caused an increase in the yield on 10-year Treasury notes, which caused gold to fall below $2,000. Amid light trading activity over the Thanksgiving holiday, gold consolidated above $1,990.
Future revisions to the US GDP, the Chinese PMI, and the PCE Price Index may impact gold. Particularly, Chairman Powell's remarks, the USD's bullish momentum, and gold's bullish momentum could be affected by Fed remarks.
Technical Perspective
Source: TradingView
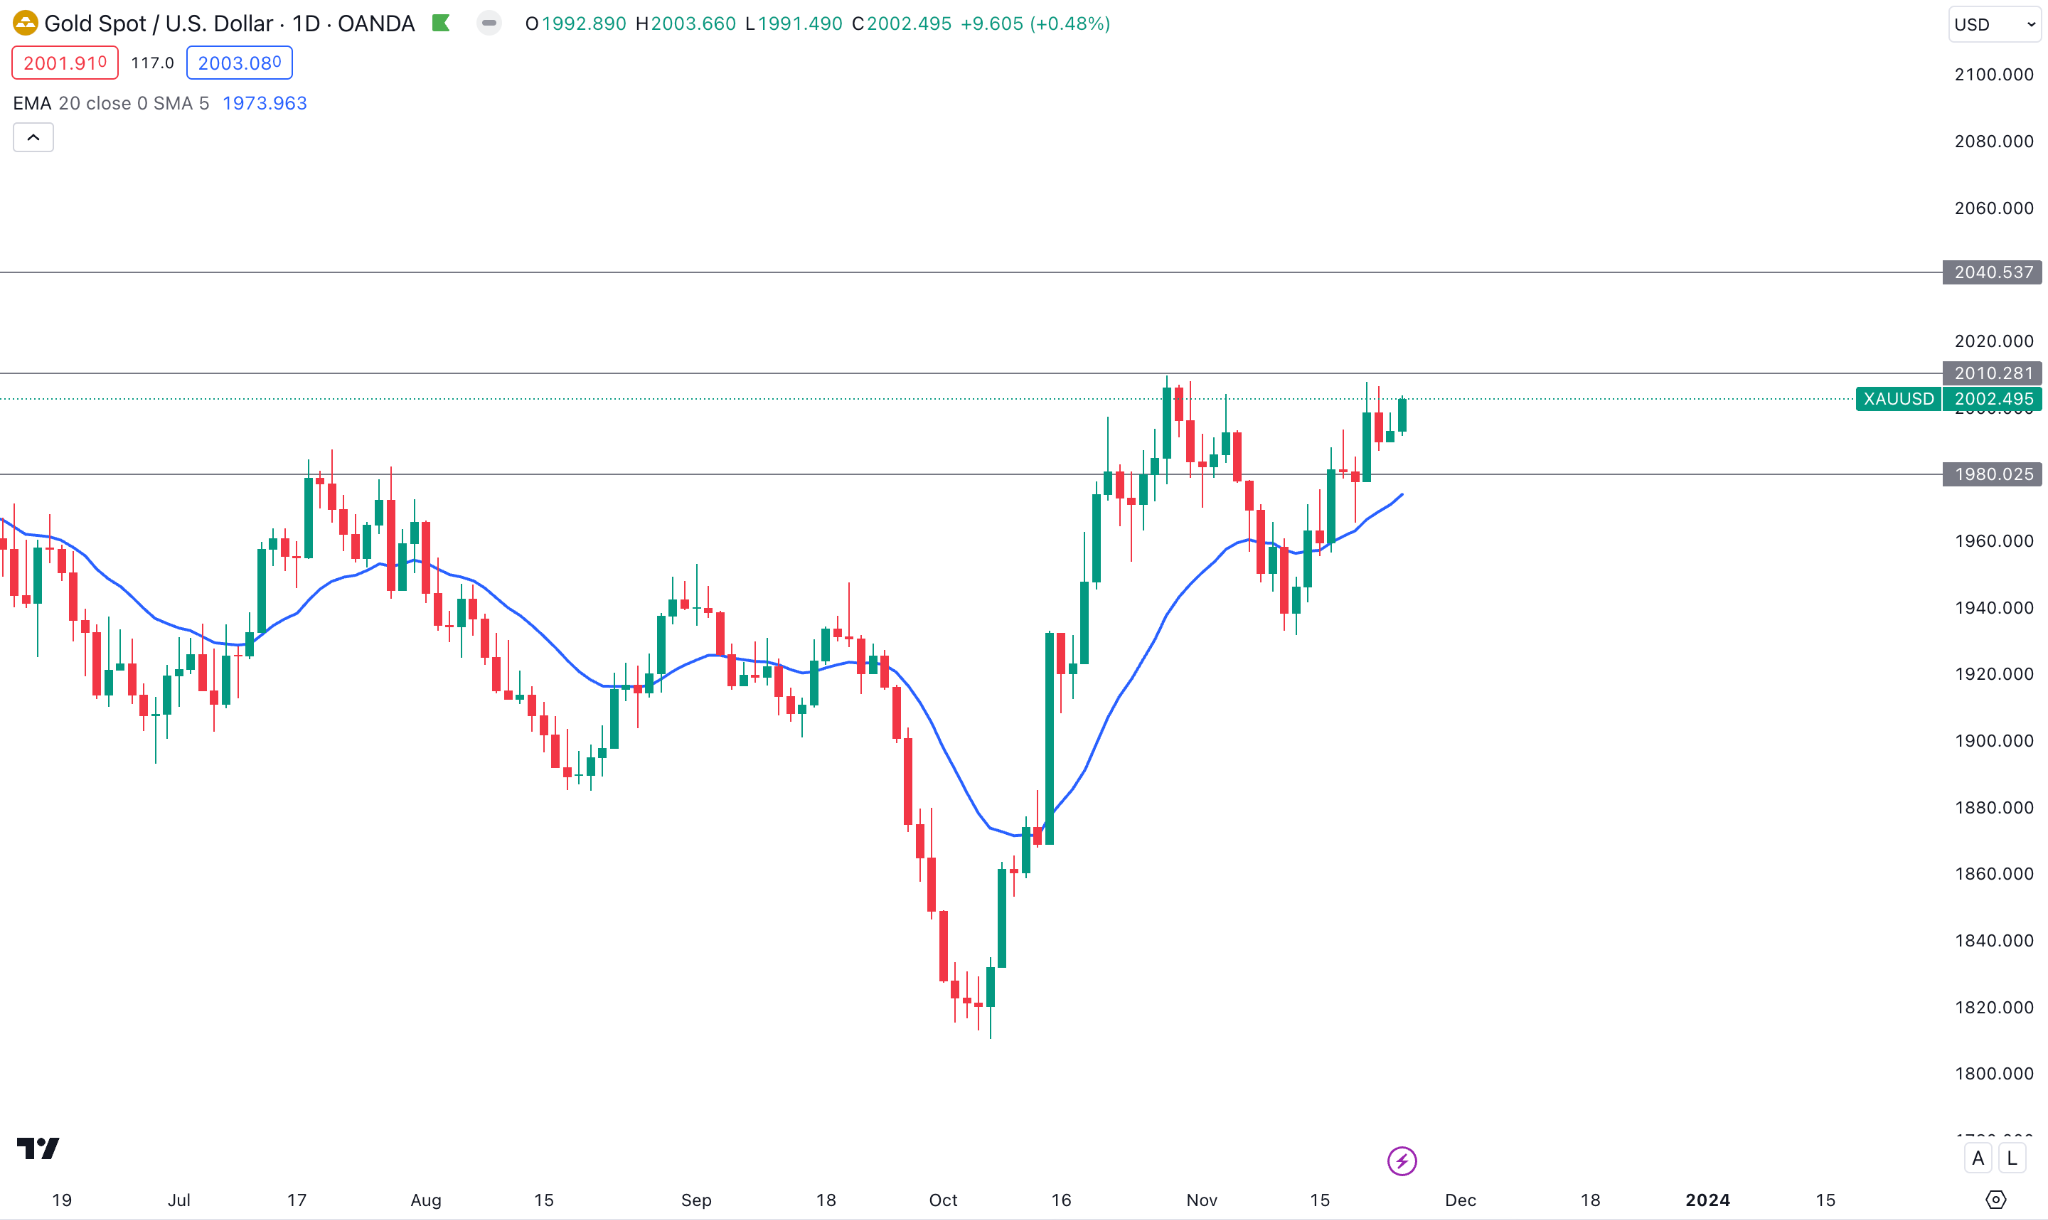
On the weekly timeframe, it continued higher and closed the week above the 2000.00 psychological level.
On the daily chart, an upward continuation is potent as the recent price trades higher above the dynamic 20-day EMA level. In that case, a bullish daily candle above the 2010.00 level could open a long opportunity above the 2040.00 area.
On the bearish side, a deeper correction is possible towards the 1980.00 level, whereas a bearish daily candle below this level could lower the price toward the 1950.00 level.
Crude Oil (WTI)
Fundamental Perspective
Amid concerns about weakening growth in major economies in 2024, the primary support for oil prices came from expectations that major oil producers would declare production cuts.
Nevertheless, this backing was undermined when OPEC unceremoniously rescheduled its meeting from Sunday, November 26th, to the subsequent Thursday, implying internal schisms. Saudi Arabia may negotiate a compromise to avert a further decline in prices; however, the extent of the production cuts may fall short of their initial expectations.
Given the increasing production levels observed in non-OPEC+ nations, most notably the United States, a sanguine assessment of oil prices appears improbable. A lack of significant reductions by OPEC+ may positively impact major currencies, including the Euro, Pound, and Yen, given that high oil prices have compelled central banks to adopt aggressive postures.
A decline in oil prices to less than $80 per barrel could allay the ECB, BoE, and BoJ's inflation concerns, potentially realigning monetary policy divergence in support of the US dollar. The greenback will be affected by US economic data due the following week, including new home sales, GDP projections, and the ISM manufacturing PMI.
Technical Perspective
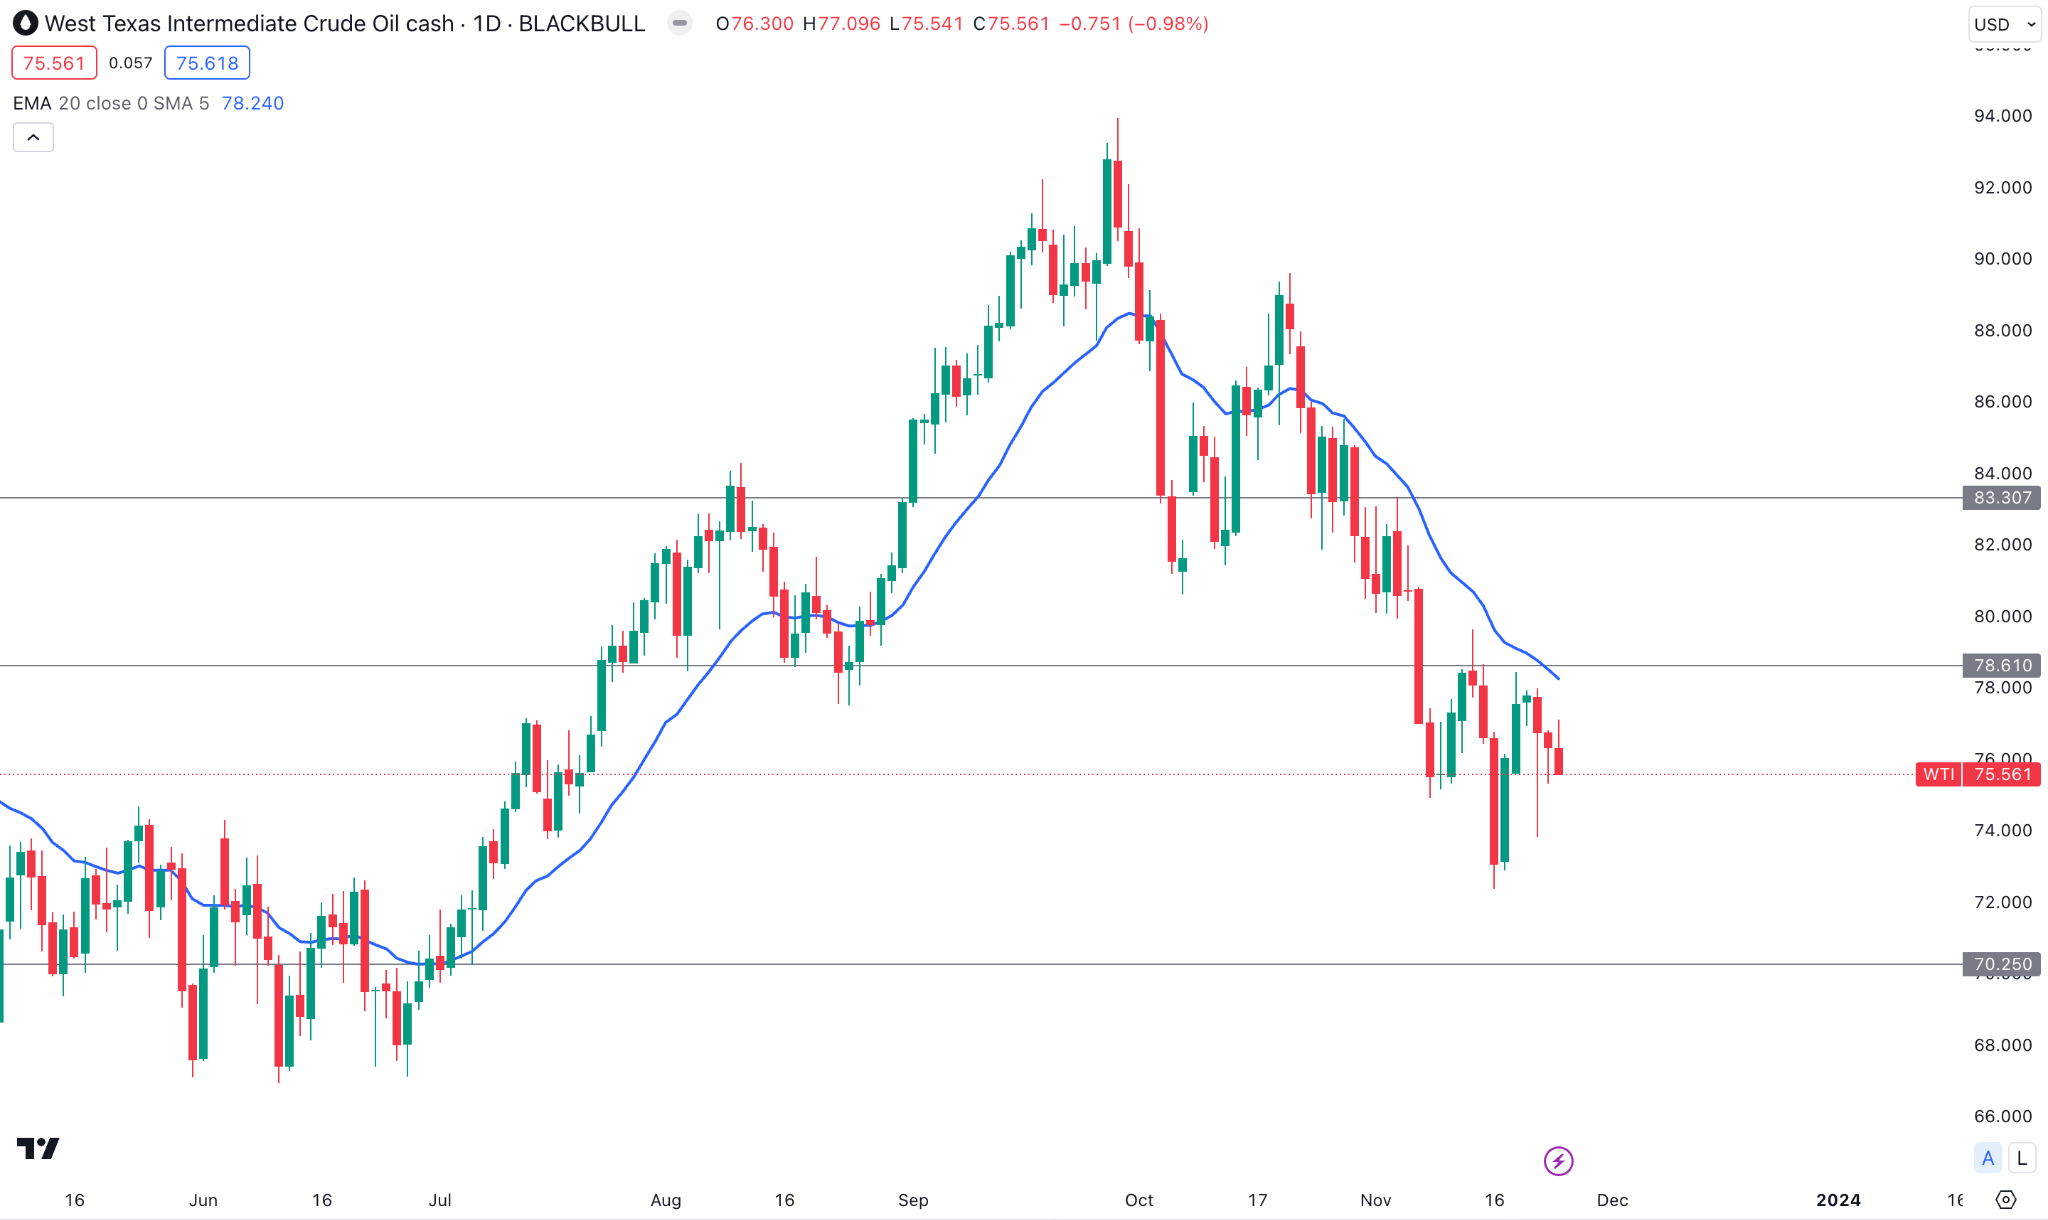
On the weekly timeframe, the Oil price pushed but failed to hold the selling pressure. As a result, the weekly candle closed with an indecisive momentum, backed by a stable bearish trend.
Source: TradingView
On the daily chart, a downside continuation is seen from the dynamic 20 EMA resistance, where the immediate bullish break and rebound from the 78.61 level could work as a confluence resistance.
On the bullish side, a stable rebound with a daily candle above the 80.00 level could be an alarming sign to bears.


