EURUSD
Fundamental Perspective
EURUSD extended its struggles, capping a dismal fourth quarter as the pair dropped nearly 8% since reaching yearly highs above 1.1200 in late September. The Euro has posted gains in only one week during this period, weighed down by a resurgent US Dollar.
The Greenback has gained momentum amid escalating geopolitical tensions, including the Russia-Ukraine conflict and the revival of the “Trump trade.” This resurgence propelled the US Dollar Index (DXY) above 108.00, its highest level since November 2022. Domestically, Germany and the broader Eurozone face a challenging economic landscape, with subdued business activity, political uncertainty, and a stagnating outlook dampening confidence in the Euro.
On 7 November, the Federal Reserve reduced its benchmark interest rate by 25 basis points, bringing the target range to 4.75%- 5.00%. While this move aligns with efforts to bring inflation closer to 2%, Fed Chair Jerome Powell emphasized caution, signaling no immediate plans for further cuts. Markets expect 75 basis points of easing from the Fed over the next year, compared to 150 basis points projected for the European Central Bank.
The divergence in monetary policy, combined with potential US tariffs on European goods under a Trump administration, suggests sustained pressure on the Euro as the Dollar continues to dominate the currency markets.
Technical Perspective
The weekly chart shows that the asset's bearish trend remains intact. A series of red candles shows the price breaking below the yearly low. No recent signs of bullish pressure keep sellers optimistic about the asset.
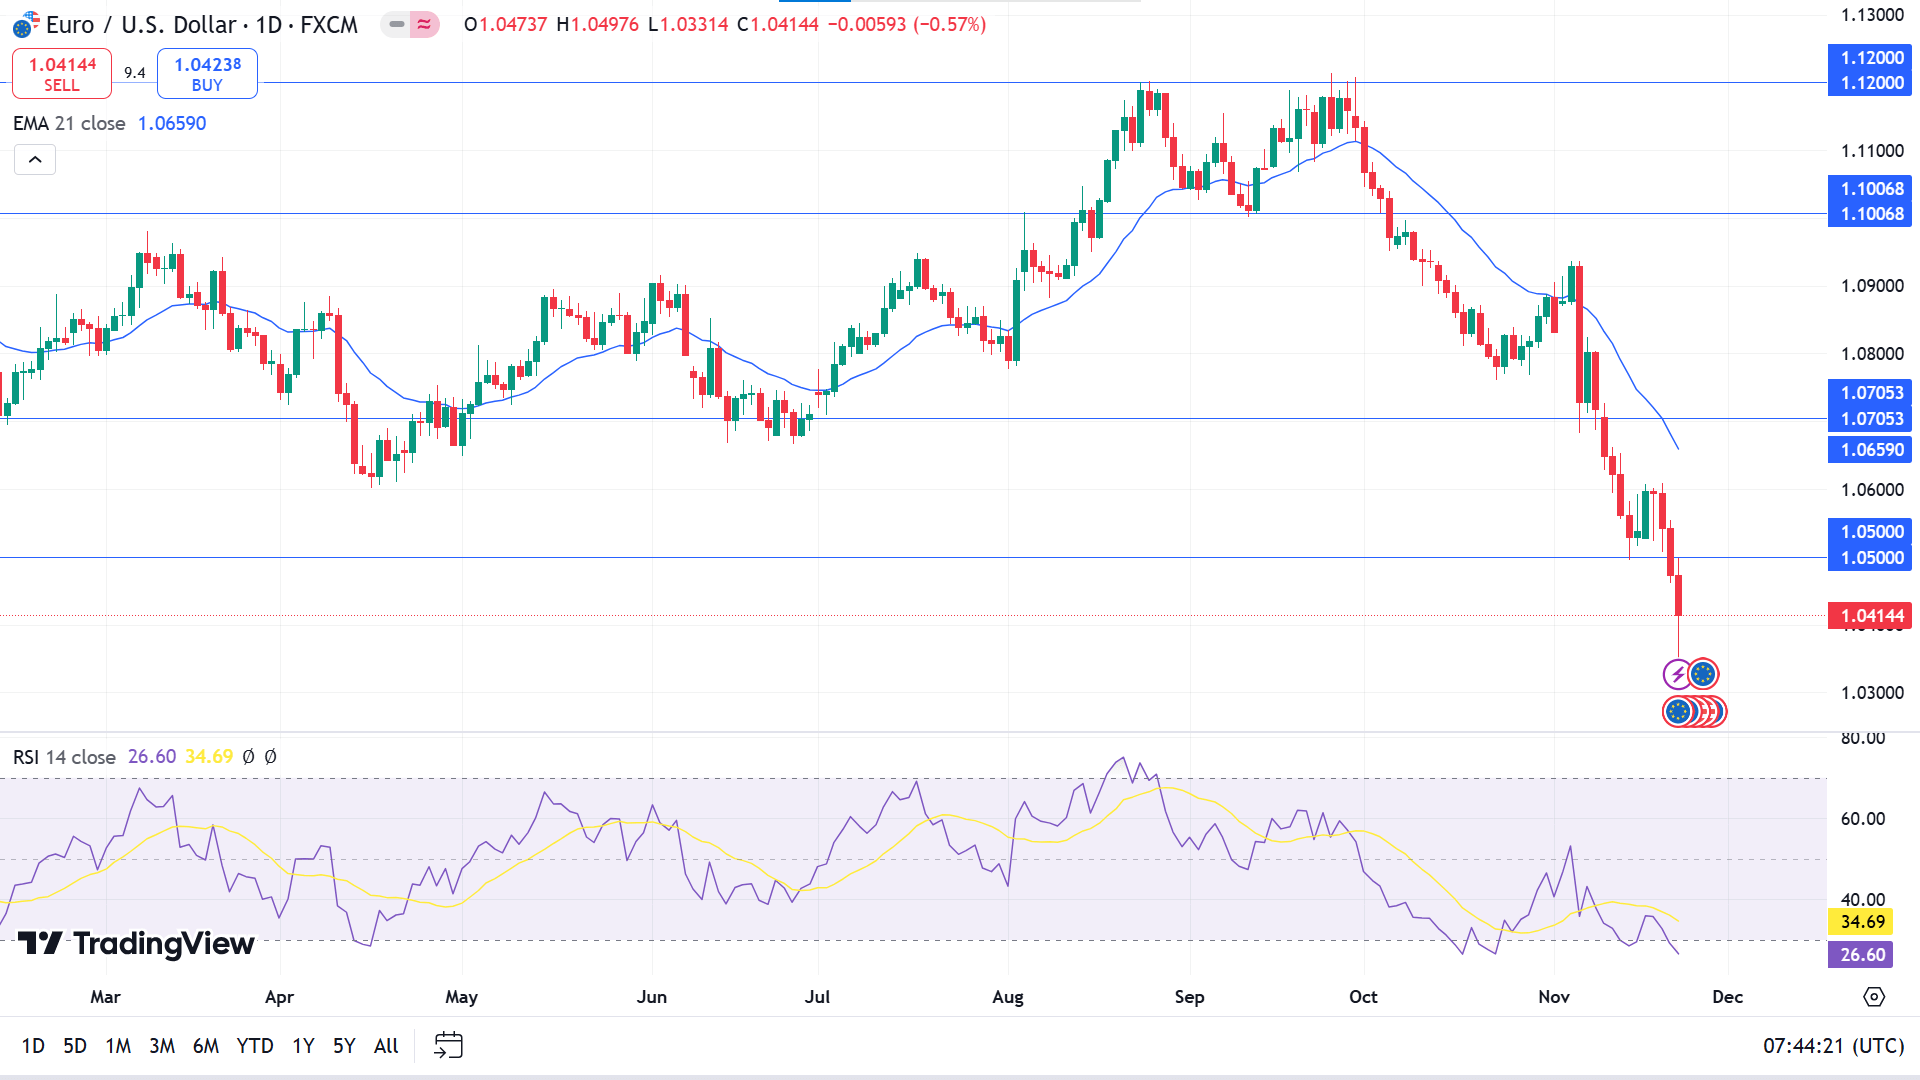
The price has been floating below the EMA 21 line since October this year, when the RSI dynamic line reached below the lower line of the indicator window overbought line. Combined, these readings indicate extreme bearish pressure and confirm the current downtrend.
Based on the EURUSD weekly outlook, expert traders may sell positions closer to the 1.0500 level, which may drive the price toward the next possible supply zone near 1.0235. However, the price needs to remain below the historically adequate 1.0500 level to dive further downside.
Meanwhile, the bearish signal will be invalid if the price bounces back and remains above the 1.0500 level, which can attract buyers toward the nearest demand zone near 1.0705.
GBPJPY
Fundamental Perspective
The Pound Sterling extended losses against the Yen for a third consecutive day, falling 0.47% after weaker-than-expected UK flash PMIs. Heightened geopolitical tensions surrounding the Russia-Ukraine conflict and unrest in the Middle East further supported the Greenback's safe-haven Appeal.
In the UK, upcoming economic events include a speech by Bank of England Deputy Governor Clare Lombardelli and releases such as the CBI Distributive Trades Survey, car production data, Nationwide Housing Prices, and the Financial Stability Report.
In Japan, October inflation data revealed persistent underlying price pressures. The CPI excluding food and energy increased to 2.3% year-on-year from 2.1%, while CPI excluding fresh food matched forecasts at 2.3%, albeit down from 2.5% previously. Capital Economics predicts robust wage increases from the annual Shunto negotiations, likely boosting household spending and potentially prompting the Bank of Japan to tighten monetary policy further.
Other Japanese data showed mixed signals. Manufacturing PMI slipped to 49.0, indicating contraction, but the Services PMI improved to 50.2, reflecting a return to expansion and resilience in service-related sectors.
Technical Perspective
The price could not reach the previous peak and started declining gradually, making short-term sellers optimistic for the upcoming weeks. Remaining below the historic support resistance level of 196.00 will enable room for the asset to get to the support zone, although the overall trend remains bullish.
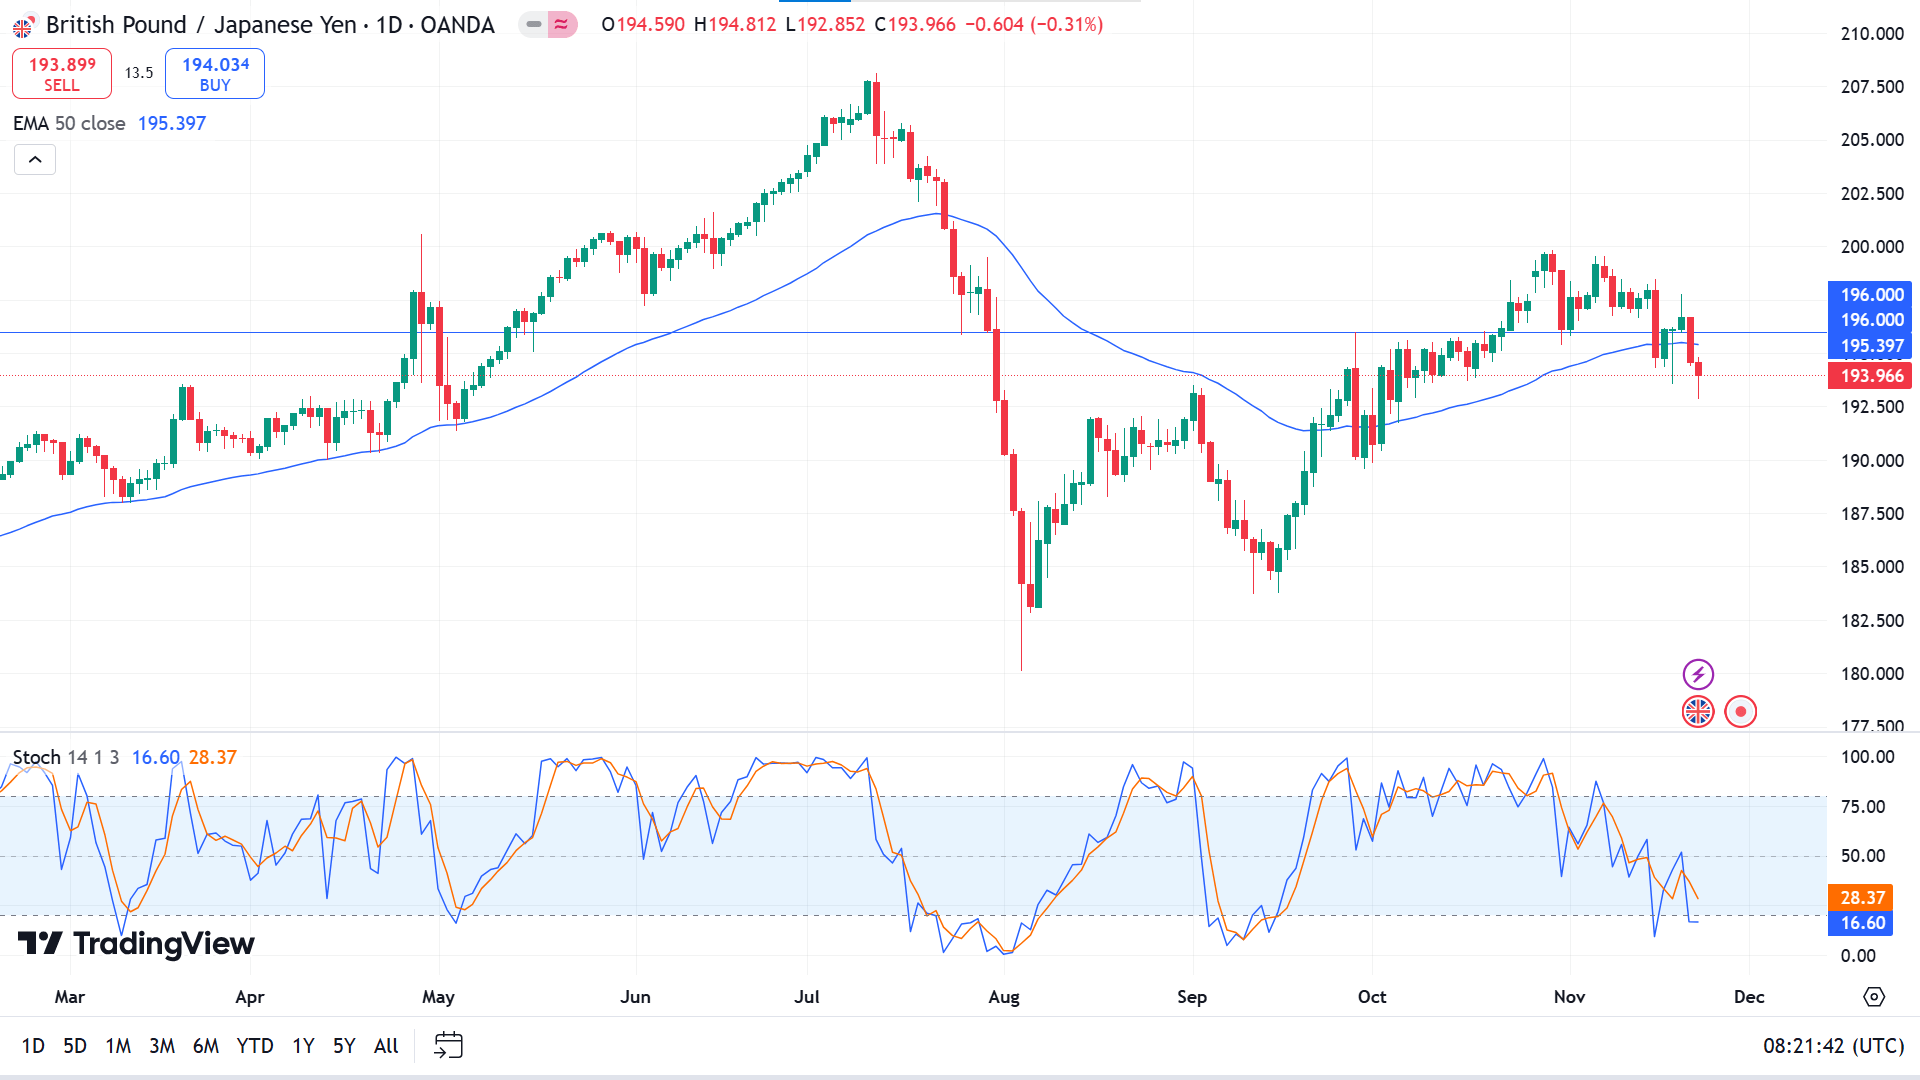
The price is moving sideways on the daily chart while reaching below the EMA 50 line. The Stochastic indicator reading remains neutral, with the dynamic signal lines floating near the lower line edging the downside of the indicator window, declaring recent bearish pressure on the asset.
When gathering the market data, it shows the price rejects the historic critical level of 196.00 and below the EMA 50 line, enabling selling opportunities for sellers toward the support zone near 184.24.
Meanwhile, the sell signal won't be valid if a green daily candle closes above the 196.00 level, which could trigger buying opportunities toward the resistance near 208.00.
Nasdaq 100 (NAS100)
Fundamental Perspective
According to S&P Global's flash PMI, US private-sector output reached its highest level since April 2022 despite ongoing weakness in manufacturing. The year-ahead outlook also climbed to a 2.5-year high. Chris Williamson, Chief Business Economist at S&P Global Market Intelligence, highlighted that November's price gauge for goods and services pointed to only marginal price increases, suggesting consumer inflation remains well below the Federal Reserve's 2% target.
Consumer sentiment continued to improve in November, while year-ahead inflation expectations fell to their lowest since December 2020, according to the University of Michigan's Surveys of Consumers. Nonetheless, Director Joanne Hsu cautioned that significant uncertainty persists around President-elect Donald Trump's economic agenda.
In bond markets, the US two-year yield rose to 4.38%, while the 10-year yield edged down to 4.41%.
Copart (CPRT) shares jumped 10%, driven by strong fiscal first-quarter results reported Thursday. These results highlighted robust year-over-year growth and ranked the stock among the week's top performers.
Technical Perspective
The price breaks above the triangle pattern on the weekly chart trigger buyers toward a new ATH as it remains on a solid bullish trend alongside the last green candle finished between the range of the previous red candles body or forming a bullish harami pattern near the peak of a bullish trend signaling a bullish continuation.
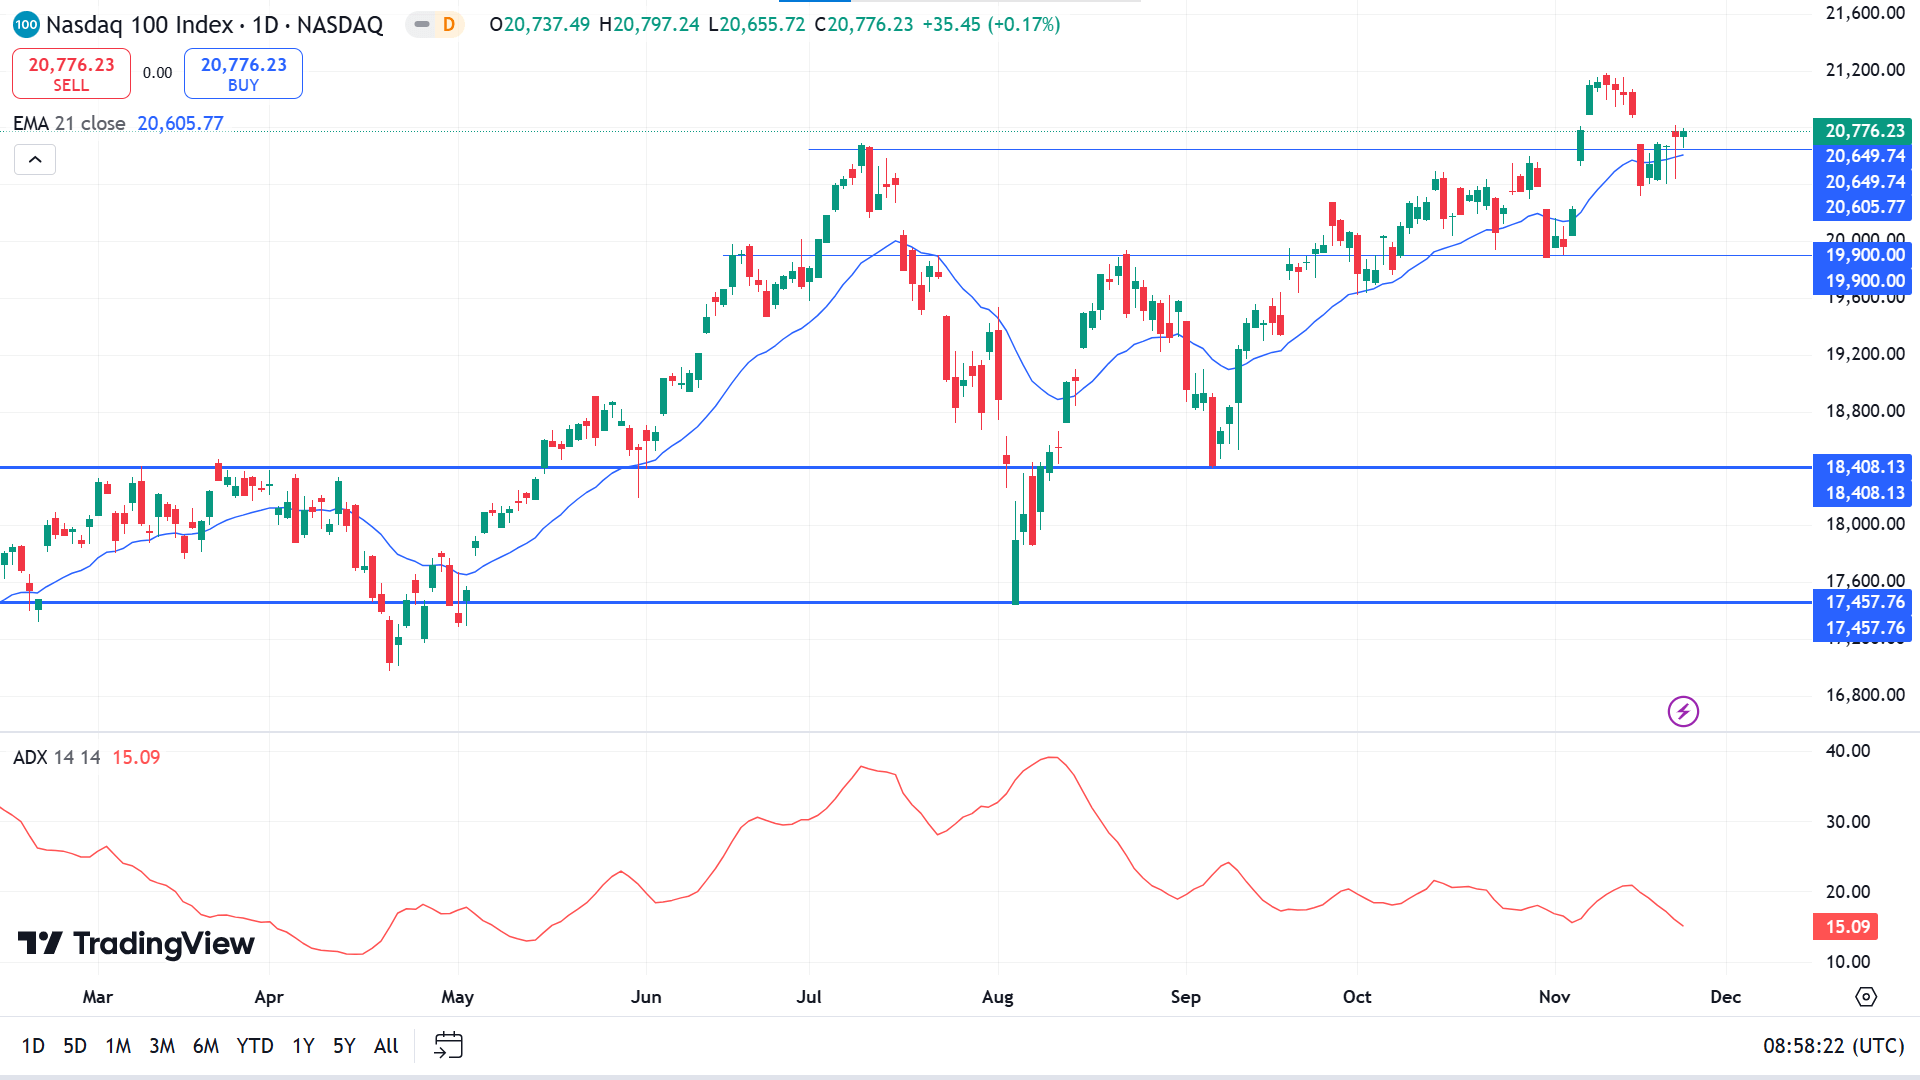
The Nasdaq 100 index price is floating above the EMA 21 line due to recent bullish pressure and reaches above the previous peak of 20649.74, declaring that the bullish trend remains intact. Meanwhile, the ADX indicator reading remains neutral, with the dynamic signal line reaching below 25, claiming that the current trend may be losing power.
Based on this structure, buyers are safe if the price remains above 20649.74, as this level may act as a barrier for sellers.
Validation of the buy signal might be invalidated if the price declines below 20,583.54; it would drive buyers to reconsider their position till the price reaches the next potential buy zone near 20605.77.
S&P 500 (SPX500)
Fundamental Perspective
Based on FactSet data, U.S. stocks have seen remarkable gains over the past year, with the S&P 500 climbing 31% through last Friday. The index closed slightly higher at 5,969.34, just 0.5% below its record close on 11 November. However, this upward momentum faces risks from potential inflationary pressures tied to tariffs under President-elect Donald Trump.
During a Thursday briefing, Solita Marcelli, chief investment officer for the Americas at UBS Global Wealth Management, warned that tariffs could significantly disrupt the market. While deregulation may provide a boost, tariff-related price increases on imports could drive inflation or dampen economic growth, depending on their implementation.
David Kostin, chief U.S. equity strategist at Goldman Sachs, forecasts the S&P 500 could rise to 6,500 by the end of 2025. However, he flagged inflationary risks tied to tariffs, fiscal changes, and immigration policies as threats to his outlook. Such pressures could drive interest rates higher, weighing on equity valuations.
Treasury yields reflect these dynamics, with the 10-year rate finishing Friday at 4.409%. Goldman strategists expect the yield to end the year slightly above 4%. Marcelli warned that universal tariffs could slow growth but suggested Trump might reconsider if market reactions, such as spiking yields or falling stocks, prove unfavorable.
Technical Perspective
Observing the last three candles of the weekly chart shows that the price floats between the half range of a long green candle for two consecutive weeks, remaining above the previous peak, which leaves buyers optimistic as the overall trend is positive.
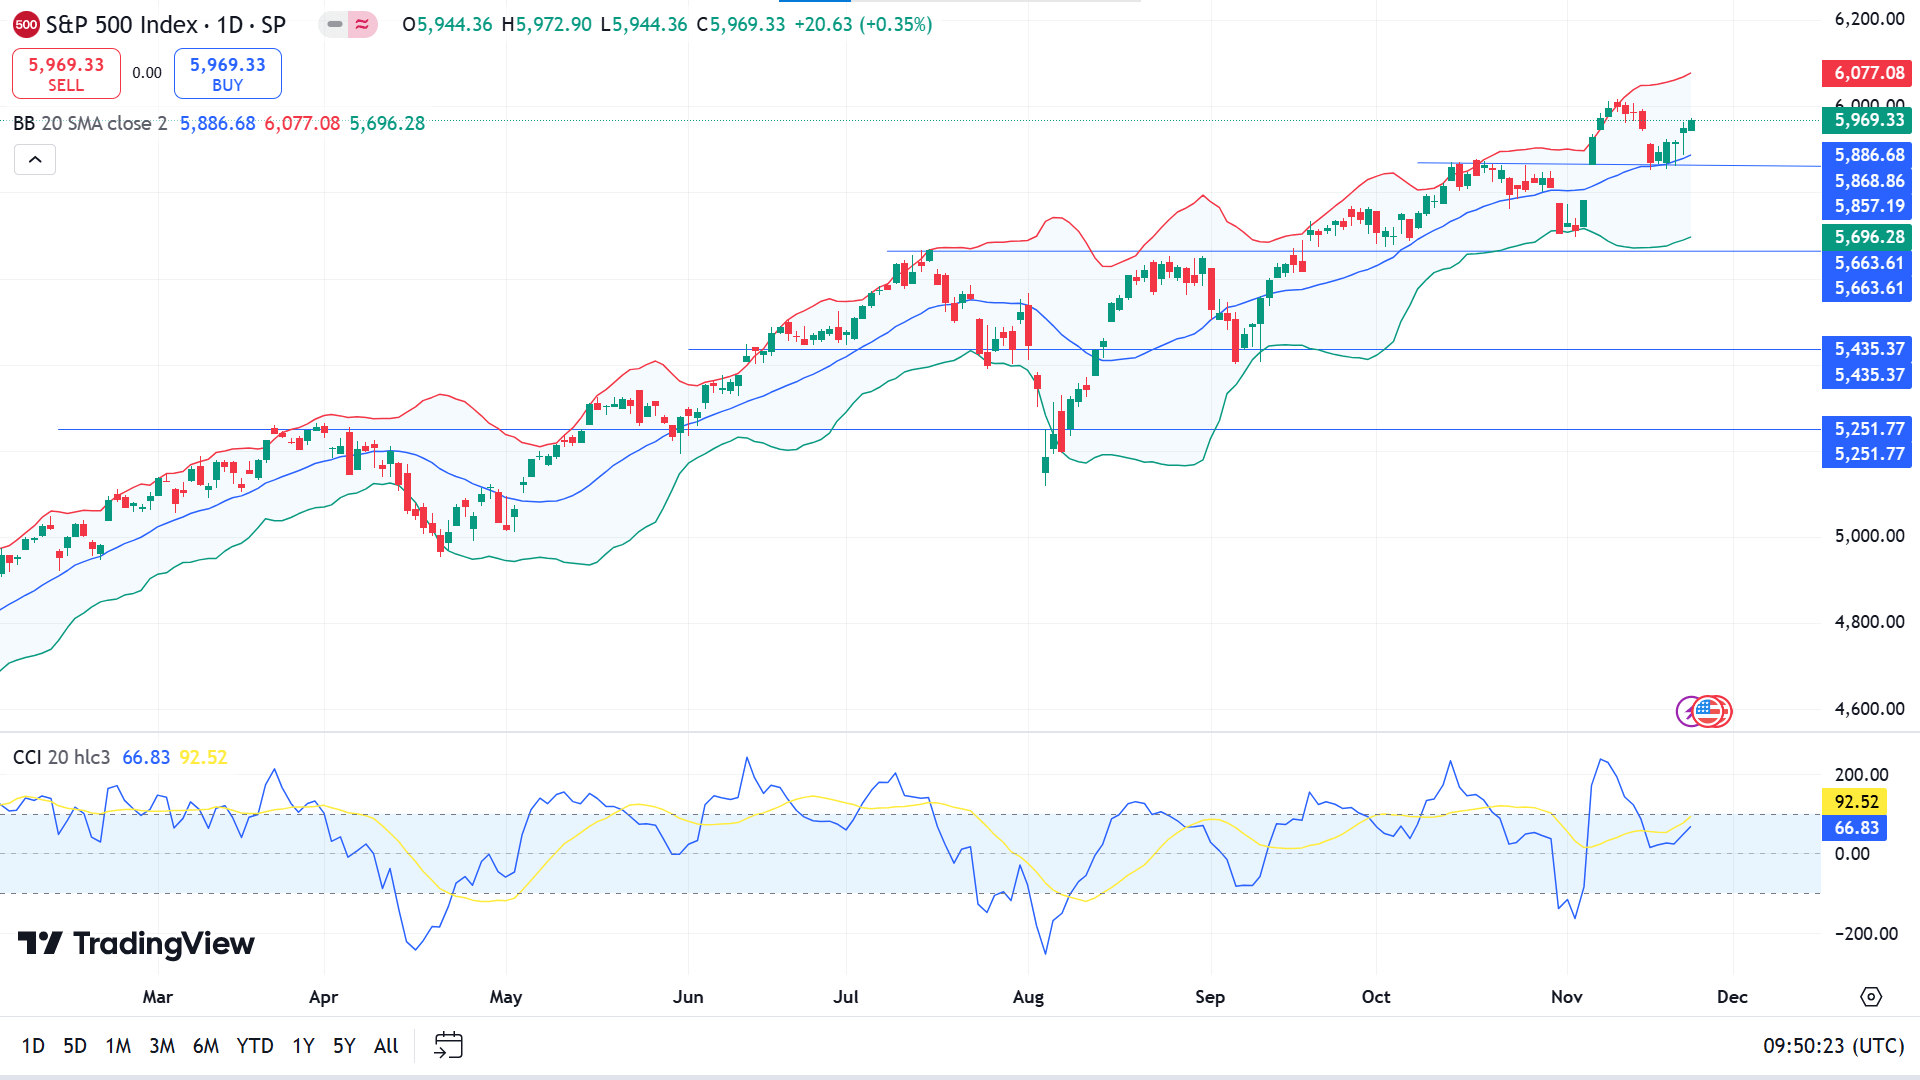
On the daily chart, the price is floating at the upper channel of the Bollinger bands indicator, and the CCl dynamic line is floating just below the upper level of the indicator window, reflecting sufficient positive force. Current bullish pressure can trigger the price, possibly leading to a new ATH.
Evaluating the current market context, the price action concept suggests that the adequate buy level is near 5868.86, which can drive the price toward a new anticipated resistance near 6161.55.
Meanwhile, buyers will be disappointed if a red daily candle closes below 5868.86; it would drive them to reconsider their positions, as in that case, expert buyers may seek to open potentially profitable long positions near 5715.59.
Bitcoin (BTCUSD)
Fundamental Perspective
Bitcoin has surged beyond $99,000, setting a new milestone for the world's largest cryptocurrency during a momentous week. While the recent U.S. presidential election provided a spark, broader forces such as regulatory progress, institutional adoption, and market optimism have powered its meteoric rise.
President-elect Donald Trump's pro-crypto stance has bolstered sentiment. His administration plans to overhaul cryptocurrency regulations, create a national Bitcoin reserve, and establish a White House “crypto czar” role. Trump's ambition to make the U.S. the “crypto capital of the planet” has amplified enthusiasm, driving Bitcoin 35% higher since his election victory.
A significant catalyst has been the launch of BlackRock's iShares Bitcoin Trust (IBIT) ETF options on Nasdaq, debuting with $1.9 billion in notional exposure on its first trading day. Analysts see this as a milestone for Bitcoin's mainstream integration, offering retail and institutional investors new tools for hedging and growth.
Institutional participation continues to expand, supported by regulatory breakthroughs like the SEC's approval of spot Bitcoin ETFs. Even cautious investors, including pension funds, are increasing allocations to Bitcoin products.
Further emphasizing the administration's crypto focus, Trump's nominee for Commerce Secretary, Howard Lutnick, has called Bitcoin a transformative financial tool. Additionally, Trump Media & Technology Group is reportedly pursuing the acquisition of Bakkt, a central cryptocurrency trading platform, signaling deeper investment in digital finance.
With several U.S. states and cities now accepting Bitcoin for taxes, cryptocurrency's integration into mainstream finance aligns with Trump's goal to position the U.S. as a global leader in the digital economy.
Technical Perspective
Bitcoin breaks above the rectangle pattern and posts three consecutive solid green candles, reflecting significant bullish pressure. Bears have no footprints in the weekly chart, which reflects buyers' domination at the asset price.
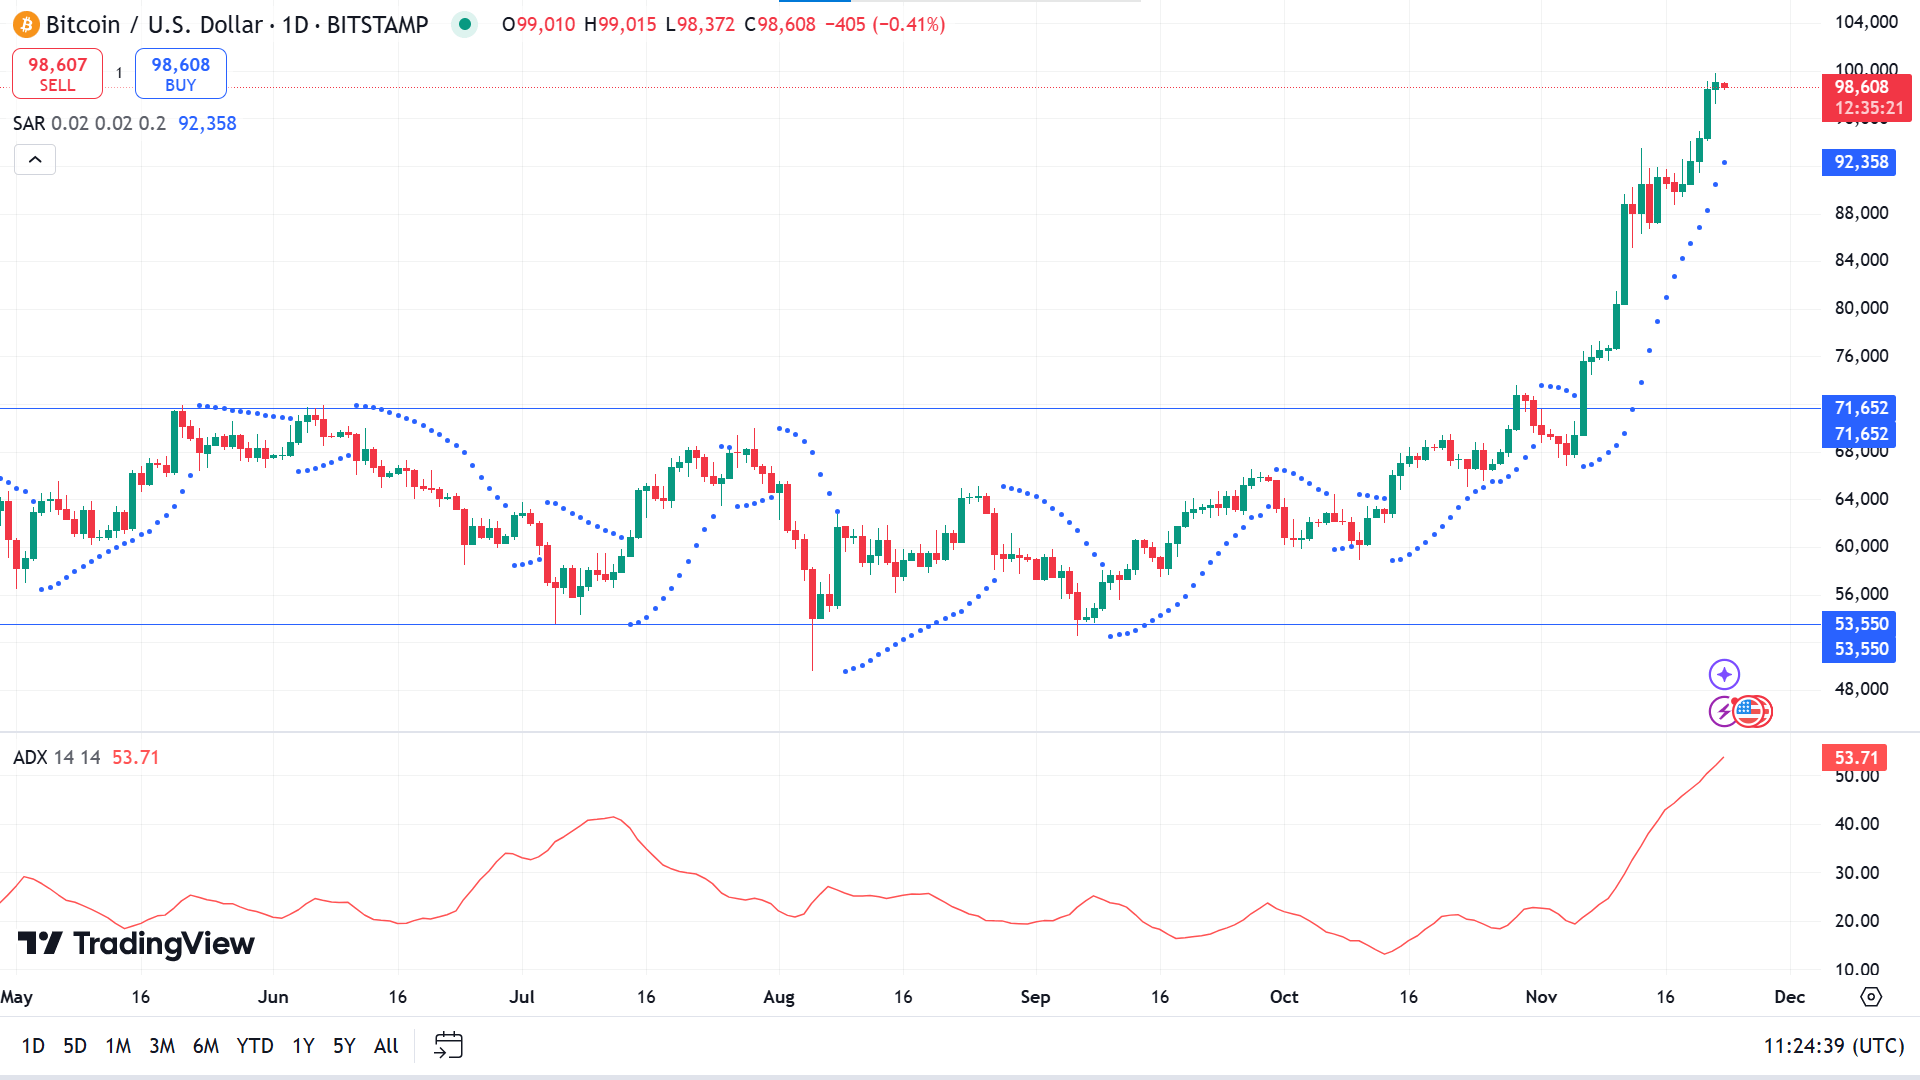
The price is floating just below the anticipated 100k mark and utterly bullish on the daily chart as the parabolic SAR continues reading dots below the price candles. At the same time, the ADX dynamic line reaches near the 53.71 level, reflecting substantial bullish pressure on the asset price.
The price action concept suggests that the price might hit the desired 100K mark, which can trigger a short-term liquidity decrease as the distribution will occur at that level. So, it won't be surprising if the price dives a few thousand during the distribution phase, and buyers may wait for hints of accumulations to determine adequate long positions.
Otherwise, the price may continue to move positively even after hitting the 100k Mark and create new ATH with increasing bullish pressure until significant distribution occurs.
Ethereum (ETHUSD)
Fundamental Perspective
Ethereum (ETH) moved beyond the $3400.00 level, driven by strong bullish sentiment in the derivatives market. Open interest (OI) in Ethereum futures surged 11%, reaching a new high of $20.27 billion, signaling renewed investor confidence following a period of consolidation.
This optimism is further reflected in Ethereum options trading, particularly on the Deribit exchange. With contracts set to expire on 29 November, the volume is heavily concentrated at the $3,400 and $3,500 strike prices, indicating that traders expect ETH to surpass these levels by the end of the month as calls dominate puts.
According to onchain data, a notable technical development is the average blob count per block exceeding the critical threshold of three. This increase, driven by higher transaction volumes from Layer 2 networks on the Ethereum Mainnet, raises transaction fees and could intensify ETH's burn mechanism. Ethereum's supply may turn deflationary if this trend continues, potentially driving prices higher.
However, institutional sentiment remains cautious. Ethereum exchange-traded funds (ETFs) experienced $30.3 million in net outflows on Wednesday, marking five consecutive days of withdrawals totalling $213.7 million, according to Coinglass.
While derivatives markets highlight strong retail and technical momentum, persistent institutional outflows may temper Ethereum's near-term growth potential.
Technical Perspective
The price resumes on a bullish track after the correction phase, as the candlestick pattern on the weekly chart reveals through the last green candle after a red hammer confirms buyers' domination on the asset price.
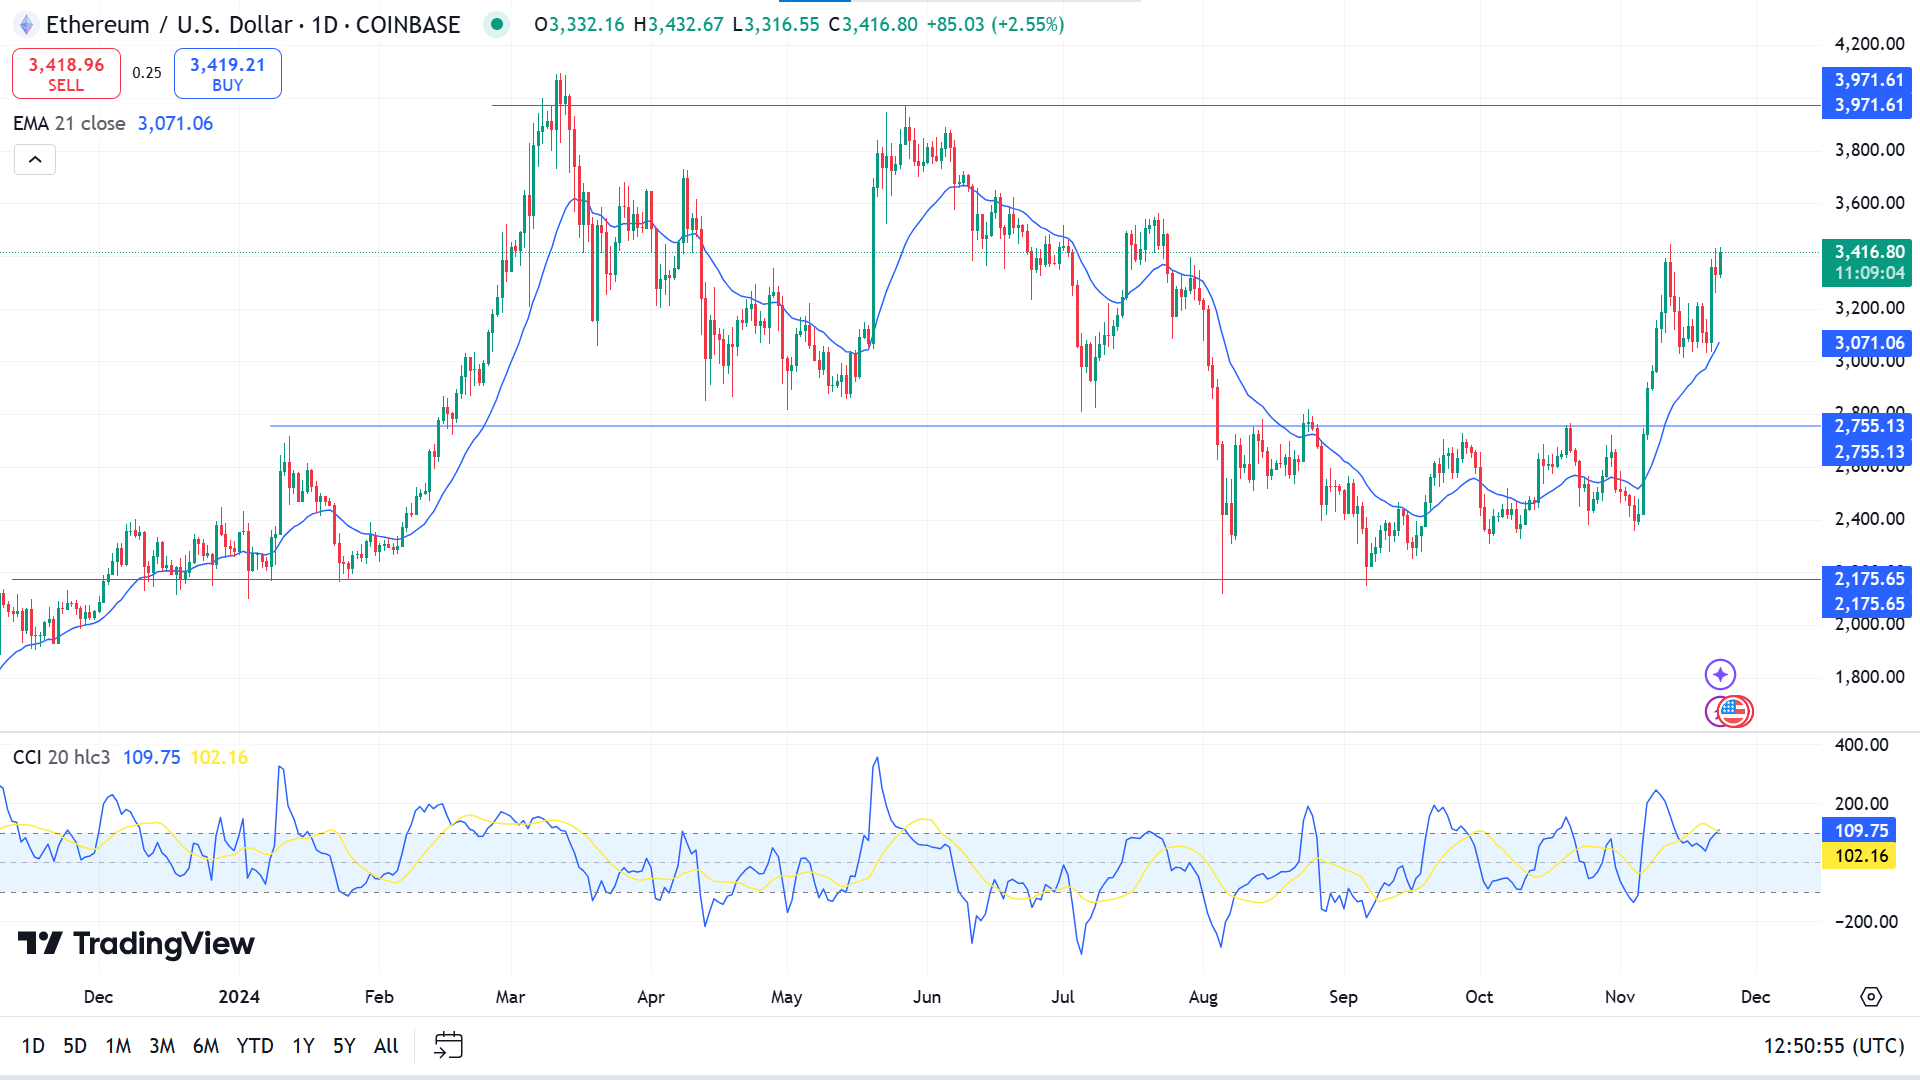
The price is on a bullish trend on the daily chart as it remains above the EMA 21 line, while the CCI dynamic line moves above the upper line of the indicator window, declaring a positive force on the asset price.
Price action traders may see the primary resistance near 3971.61 as a substantial positive force driving the price toward that level. Meanwhile, decreasing bullish pressure from this level can drive the price toward the range of 2884.62 to 2755.13, as the demand zone can attract buyers to trigger the price surge toward the anticipated resistance level.
Gold (XAUUSD)
Fundamental Perspective
Gold (XAU/USD) rallied last week, reclaiming $2,700 after consecutive losses, as heightened geopolitical tensions bolstered safe-haven demand. Key developments in the Russia-Ukraine conflict and upcoming US economic data are set to shape Gold's performance next week.
The metal began the week with a 2% gain, ending a six-day losing streak. News that US President Joe Biden authorized Ukraine to deploy long-range weapons against Russia spurred risk-off sentiment. Reports of North Korean troops aiding Russian forces further alarmed markets. Russia's revised nuclear doctrine, viewing non-nuclear state attacks supported by nuclear powers as joint aggressions, intensified concerns, supporting Gold midweek.
On Thursday, Ukrainian President Volodymyr Zelenskiy reported Russia's deployment of a suspected intercontinental ballistic missile, elevating tensions and pushing Gold to a 10-day high of $2,670. By Friday, Russia identified a US missile base in Poland as a priority target, deepening fears of a broader conflict. While upbeat US PMI data briefly strengthened the USD by signaling expanding private-sector activity, Gold ended the week at a two-week high above $2,700.
This week, the focus will shift to US economic releases, including the Fed minutes, Q3 GDP revisions, and October's PCE Price Index. Dovish signals or weaker inflation data could support Gold, while easing geopolitical tensions may trigger a pullback.
Technical Perspective
The last long green candle on the weekly chart erases the maximum loss of the previous weeks, making buyers optimistic as the bullish trend resumes.
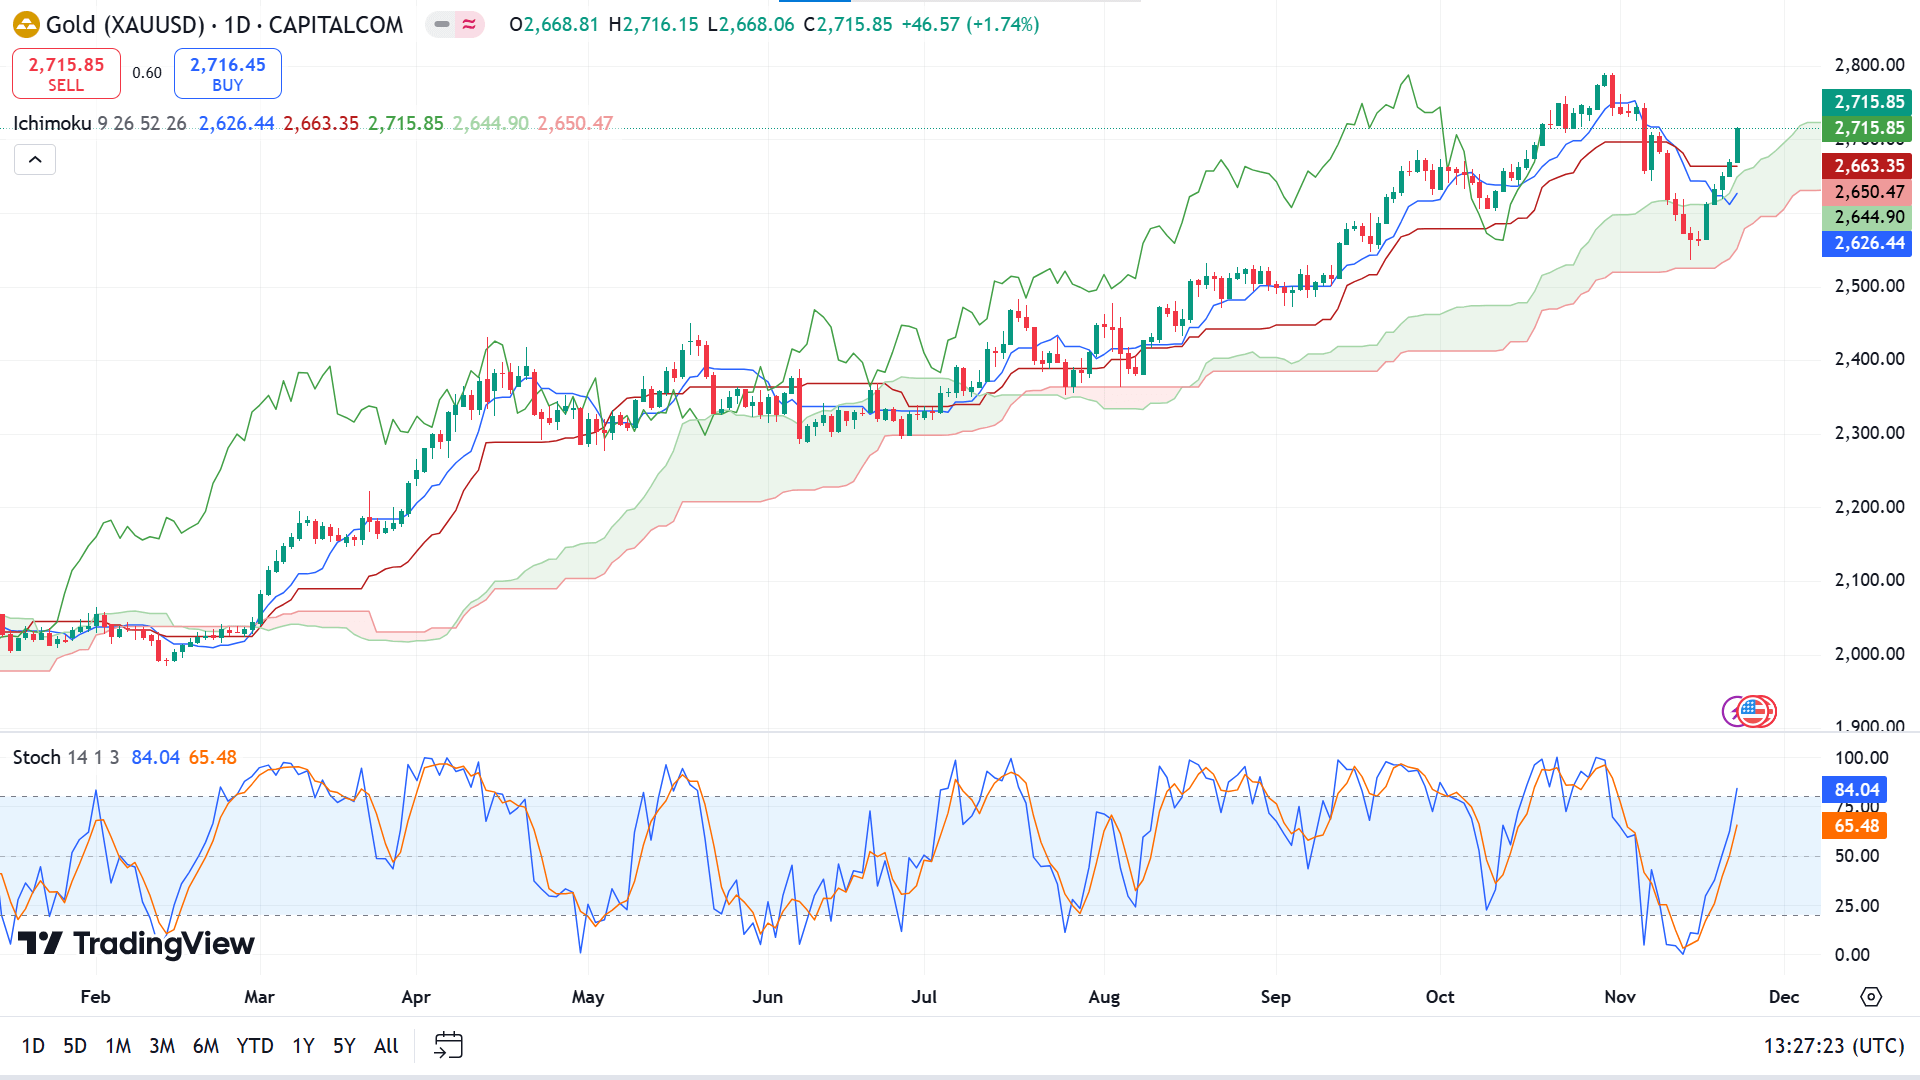
The price hovers above the green cloud of the Ichimoku Cloud indicator, declaring a positive force on the asset price. The Stochastic indicator reading remains neutral, with the indicator window's dynamic signal lines edging upside. Combining both indicator readings, the solid uptrend is visible and leaves buyers optimistic.
The broader market context suggests traders might find it a strong bullish opportunity as long as the price hovers above the 2680.50 level.
The bullish signal might be invalidated if a red daily candle closes below 2663.35; it will spark a selling opportunity for short-term sellers toward the primary support near 2536.73.
Tesla Stock (TSLA)
Fundamental Perspective
Tesla shares reached a 52-week high last Friday, closing around $338 level. This strong performance was supported by optimism surrounding EV tax credits and regulatory prospects.
The Alliance for Automotive Innovation, representing traditional automakers, is lobbying to preserve the $7,500 EV tax credit, which President-elect Donald Trump may cut. While Tesla directly benefits from such incentives, legacy automakers also prefer the stability of these credits despite relying primarily on conventional vehicles for profits. Automakers value policy consistency due to the significant, long-term investments required for product planning. Although BEV adoption is progressing slower than many anticipated, penetration in new car sales continues to rise, with credits helping lower consumer costs and supporting profitability.
Regardless of the credit's fate, Tesla stands to gain from Musk's alignment with Trump. The incoming administration is expected to set federal standards for self-driving car regulations, potentially accelerating Tesla's autonomous vehicle initiatives.
Tesla's stock has surged by over $100 since the 5 November election, adding $325 billion to its market cap. The week's 10% gain was highlighted by an early-week 8% rally following news of autonomous vehicle policy plans. Trading volatility remains high, with Tesla now valued at over 100 times estimated 2025 earnings, the highest since early 2022.
Technical Perspective
TSLA stock rallied in the weekly chart, leaving consecutive gaining candles, indicating increasing bullish pressure on the asset price, driving it upward.
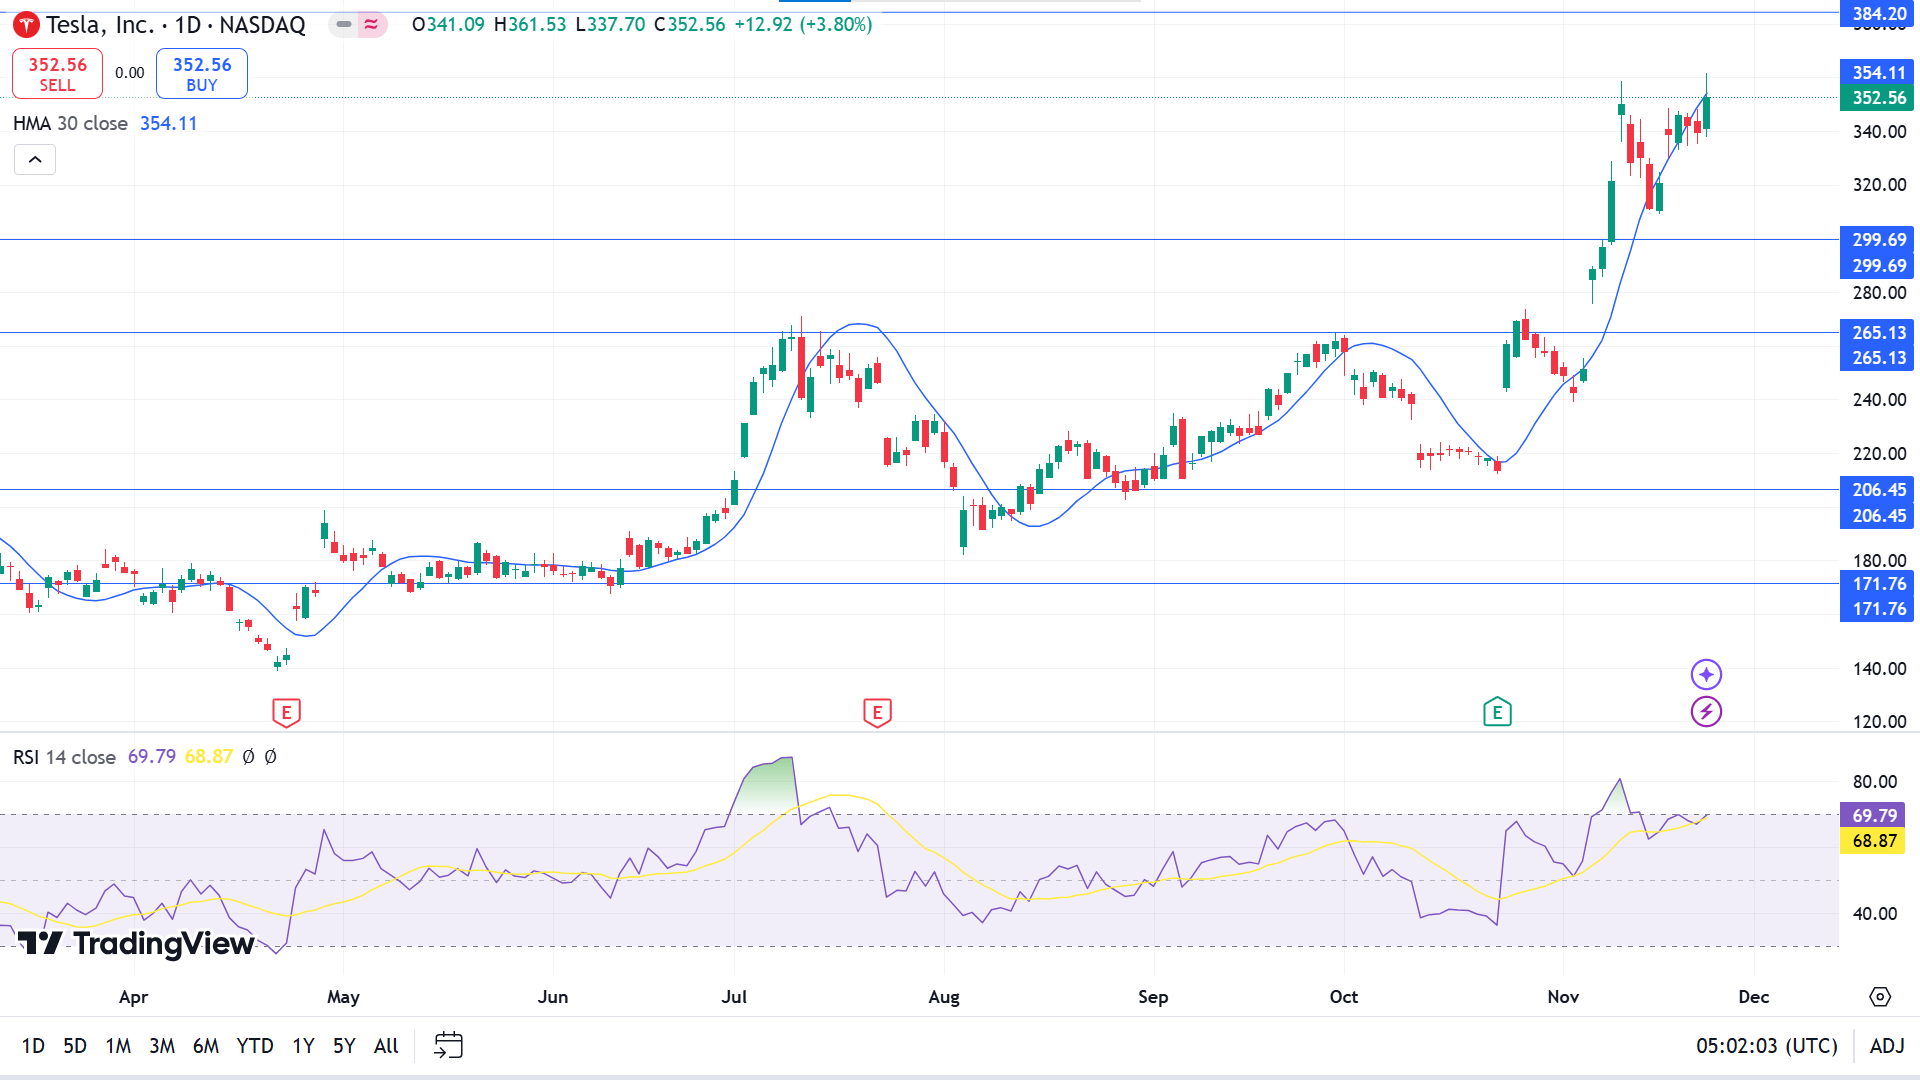
TSLA stock price reaches a yearly high at the daily chart due to a recent positive force on the asset price at the HMA 30 line, while the RSI dynamic line floats at the upper line of the indicator window. These indicator readings suggest sufficient pump on the asset price to get resistance as it currently remains on an uptrend.
The broader market context hints that traders may seek adequate long positions near 299.69, while sellers may primarily keep an eye on the 384.20 level.
Meanwhile, the buy signal might be invalidated if the price keeps declining below the 299.69 level; it will trigger buyers to wait till 265.13 to open more adequate long positions.
Nvidia Stock (NVDA)
Fundamental Perspective
Nvidia, the dominant GPU supplier for AI and data centers, delivered exceptional fiscal Q3 2025 results (ended 27 October), exceeding Wall Street expectations. The debut of its Blackwell GPU architecture has sparked overwhelming demand, significantly outpacing supply. Despite this, Nvidia's stock fell 2.5% in after-hours trading, presenting a potential buying opportunity given its growth potential.
GPUs have become essential in AI development, surpassing CPUs in data centers due to their parallel processing capabilities, which are crucial for handling the vast data required for AI training and inference. Nvidia's Hopper-based GPUs, such as the H100, are highly sought after, with single units priced as high as $40,000, and widely used by companies like Microsoft and Amazon to power scalable AI infrastructure.
The Blackwell architecture marks a transformative advancement. Its GB200 NVL72 systems achieve 30 times the AI inference speed of H100 systems, offering unparalleled efficiency at only double the cost. This breakthrough makes cutting-edge AI model deployment more affordable and accessible.
During Q3, Nvidia shipped 13,000 Blackwell GPU samples, with adoption underway at Microsoft, Dell, and CoreWeave. Oracle will soon offer clusters featuring 131,000 Blackwell GPUs. CEO Jensen Huang described demand as “staggering,” forecasting GPU shipments to soar over 20-fold soon.
Technical Perspective
The share price of NVDA hit ATH last week but finished below the previous candle range with a small body and long upper wick, reflecting buyers are still active on the asset price but failed to move more upside last week.
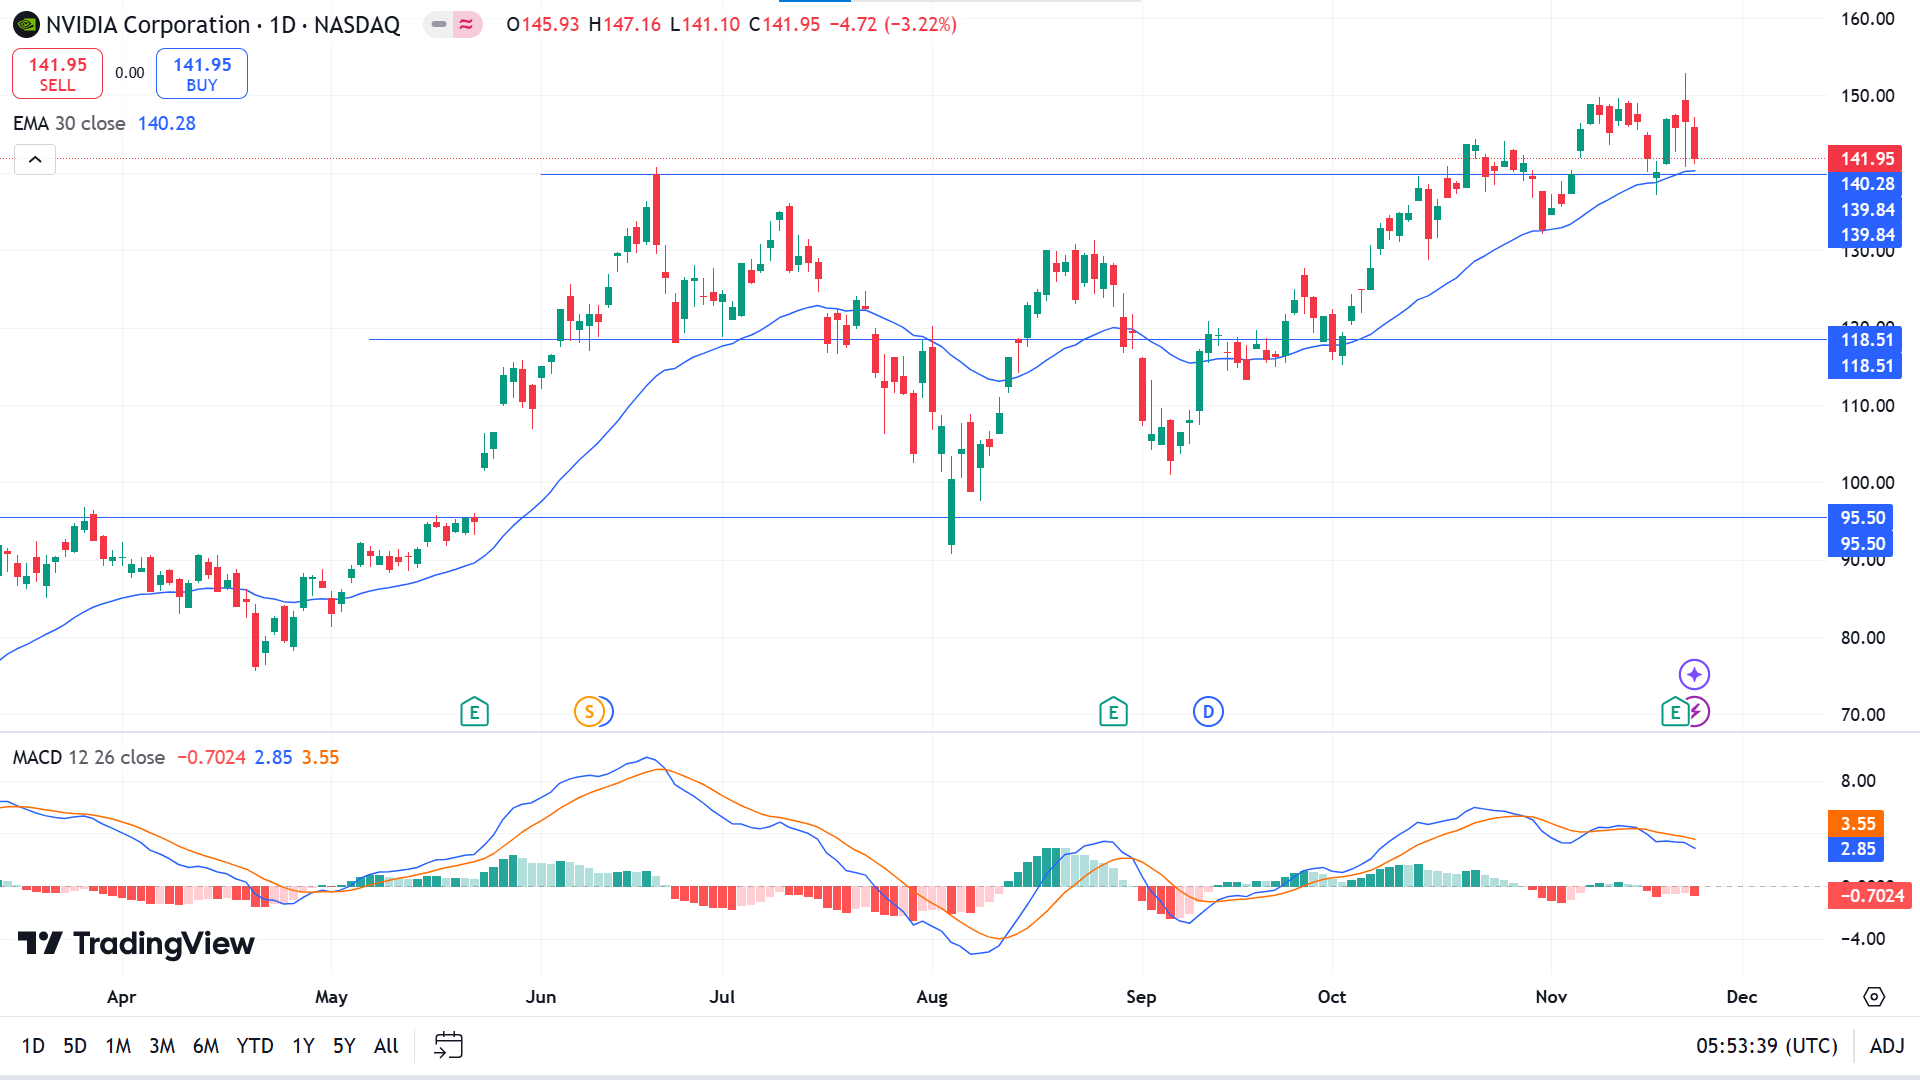
The uptrend is visible on the daily chart as the price floats above the EMA 30 line, while the MACD reading is different, indicating a mixed signal to investors. The MACD reading suggests a sell signal through a dynamic signal line sloping downside and red histogram bars below the midline.
Based on this structure, the price remaining above 139.84 is suitable for opening long positions that might drive the price toward the ATH 152.89 or beyond that level.
Meanwhile, a red daily candle closing below 139.84 will disappoint buyers, which could spark short-term selling opportunities toward 130.43, but the overall trend remains bullish.
WTI Crude Oil (USOUSD)
Fundamental Perspective
Crude oil prices are poised to close the week above $70, supported by escalating tensions between Russia and Ukraine. Both nations are maneuvering for strategic advantage ahead of potential peace discussions, and they are expected to gain momentum after President-elect Donald Trump assumes office in January 2025. Yahoo News reports that Russia has identified a Polish military base—a NATO site—as a primary target for retaliation should Ukraine conduct further attacks.
The U.S. Dollar Index (DXY) also strengthened, driven by disappointing preliminary PMI data from the Eurozone, which highlighted a deeper-than-expected contraction in manufacturing and services activity. In contrast, robust U.S. PMI figures exceeded forecasts, underscoring the resilience of the U.S. economy and fueling increased demand for the dollar.
In oil-related news, Russia plans a high-level security meeting today, though Bloomberg notes the agenda still needs to be confirmed. Additionally, OPEC+ appears poised to postpone plans to increase oil production. Reuters reports the upcoming 1 December meeting will likely occur online rather than in Vienna, with Bloomberg suggesting production hikes may be delayed until the second quarter of 2025.
The combination of geopolitical uncertainty and economic data has heightened market volatility, leaving oil prices and the dollar at the forefront of investor focus heading into next week.
Technical Perspective
Crude oil has continued downward since hitting a yearly high in March. The last weekly candle closed green, surpassing the previous candle's range and bounced back from an adequate support level near 66.95, confirming fresh bullish pressure on the asset.
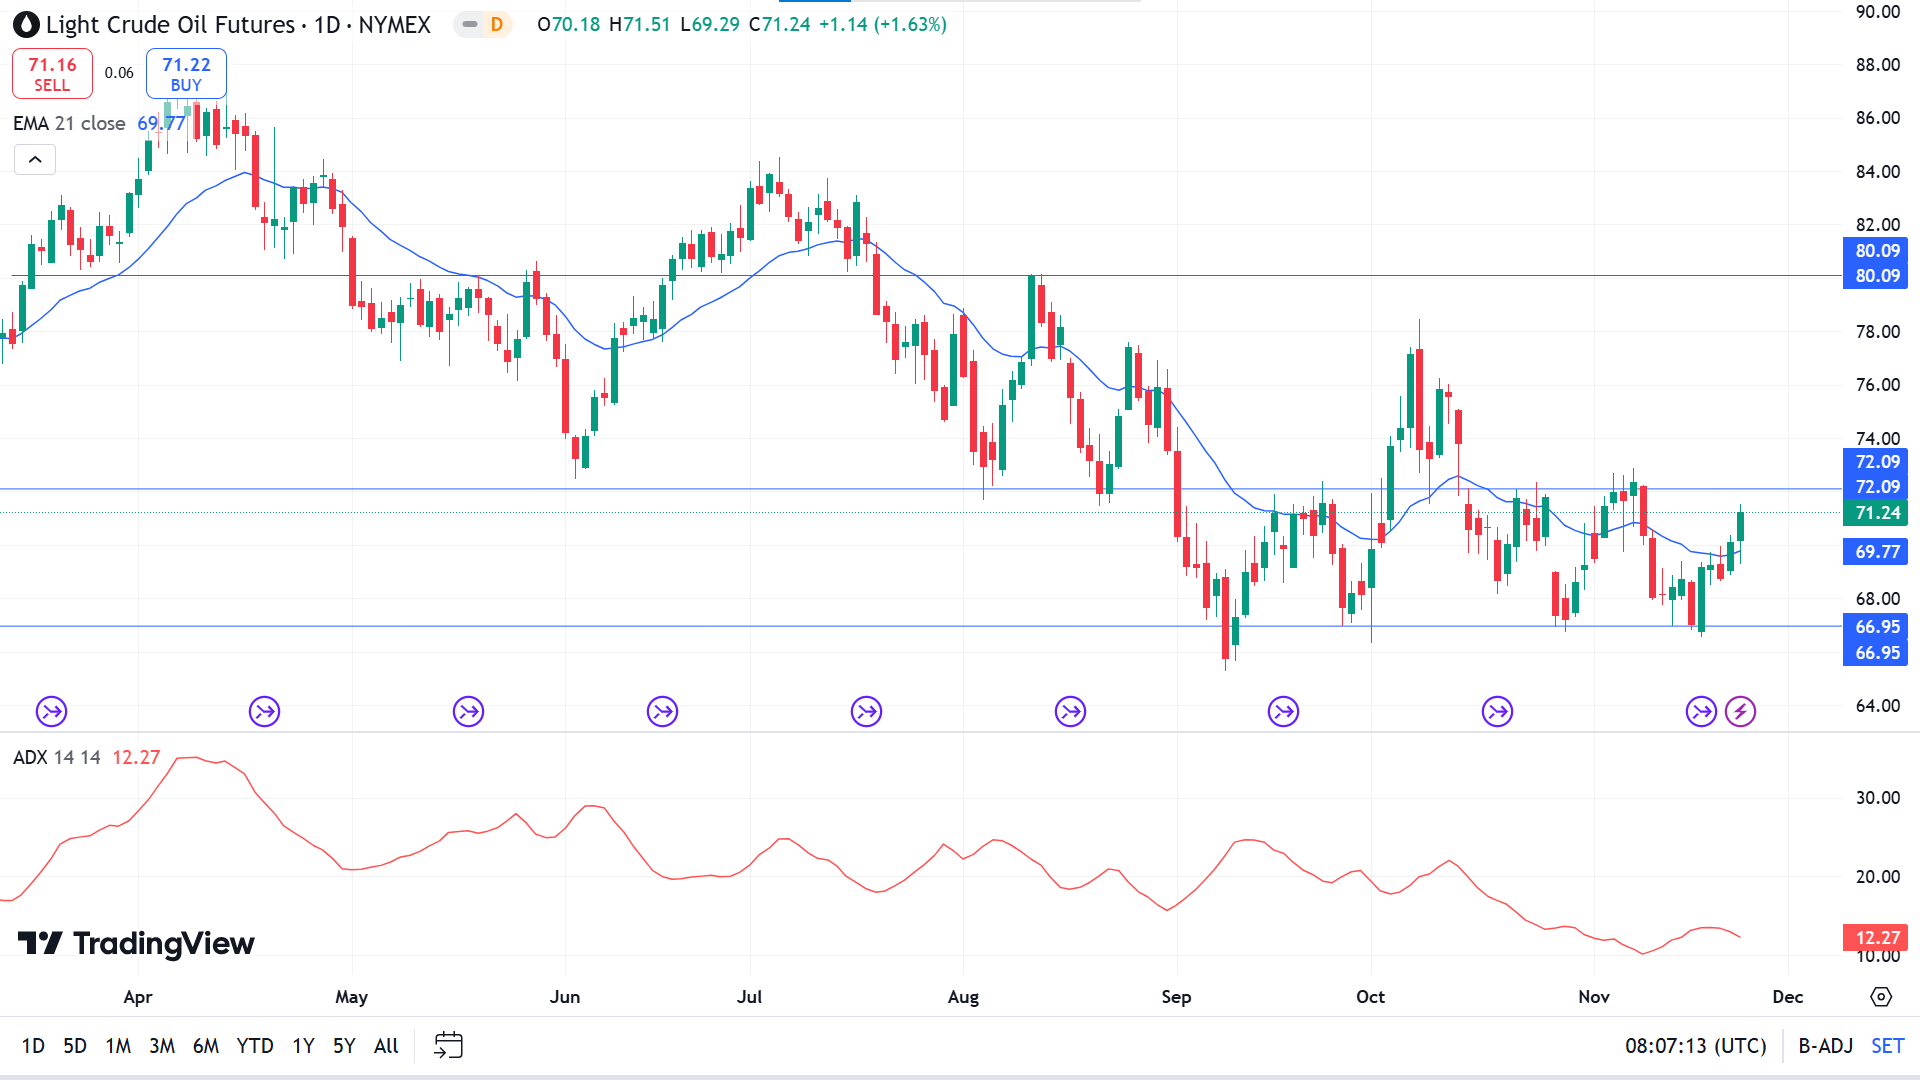
On the daily chart, the price is heading on the range top after reaching the range support, as it has remained between 66.95 and 72.09 since mid-October. Recently, it reached above the EMA 21 line as the asset got sufficient positive force. At the same time, the ADX reading declined below 25, suggesting the current trend may be losing power, declaring a mixed signal to investors.
According to current price action, sellers primarily look at the 72.09 level to open short positions as the level previously worked as an essential support-resistance level, so the price bounces back from that level several times.
Meanwhile, the sellers might be disappointed after having a daily close above the 72.09 level. It will attract buyers toward the next resistance near 80.09.


