
EURUSD
Fundamental Perspective
On Friday, the EUR/USD experienced a modest recovery, with the US Dollar (USD) taking a breather after a week of consistent gains that pushed the Euro (EUR) down by nearly a full percentage point from Monday's high of 1.0756.
This week witnessed limited EU data, with much attention directed towards central bank indicators. During a public appearance on Friday, European Central Bank (ECB) President Christine Lagarde opted for a cautious approach, refraining from causing any significant market ripples. Meanwhile, market participants are still digesting the aftermath of Federal Reserve (Fed) Chairman Jerome Powell's unexpectedly hawkish comments on Thursday. Powell expressed the Fed's uncertainty about having done enough to control inflation, triggering a significant market reaction.
Looking ahead to next week, the focus will shift to EU Gross Domestic Product (GDP) figures on Tuesday, followed by US Consumer Price Index (CPI) inflation figures. Projections indicate that the EU's third-quarter GDP is expected to remain stable for both monthly and annualized figures, with forecasts at -0.1% and 0.1%, respectively. On the US front, October's headline CPI is anticipated to retreat from 0.4% to 0.1%, while Core CPI for the year leading into October is expected to hold steady at 4.1%.
Given the Fed's assertive stance and the renewed emphasis on central bank communications, next week's growth and inflation figures are poised to carry heightened significance, especially if the actual numbers deviate from the forecasts.
Technical Perspective
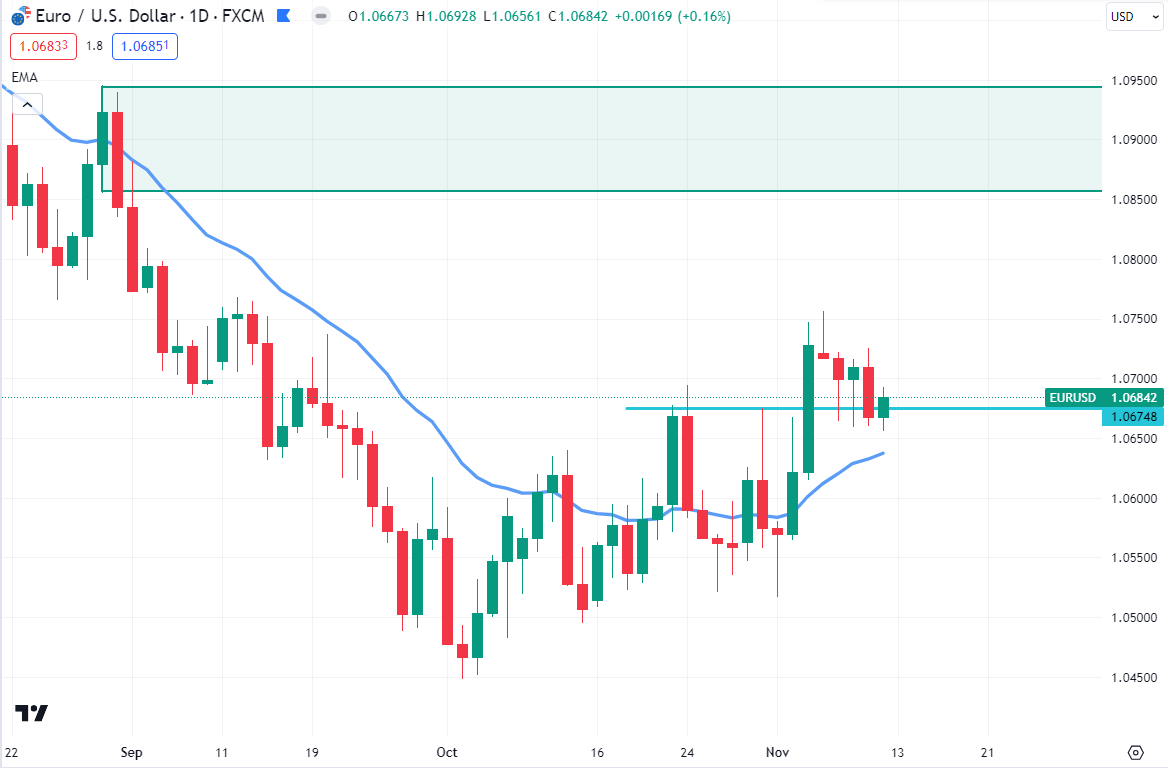
Source: TradingView
In the weekly chart, the EURUSD price retraced to the dynamic level of the 20-week EMA after a strong bearish momentum and had a weekly bearish candle close. As the latest weekly candle appeared as an inside bar, bulls might regain momentum after making a new higher high.
However, in the daily timeframe, the momentum is also bullish. Therefore, if the price can have a daily bullish candle close above the 1.0725 price area, EURUSD may recover further upward toward the 1.0860 daily order block area in the coming days.
On the bearish side, the weekly 20 SMA is a strong barrier from where a stable bearish D1 candle below 1.0640 could be a short opportunity.
GBPJPY
Fundamental Perspective
On Friday, the GBP/JPY cross attracted dip-buying interest near the 184.80 region, demonstrating a temporary halt to the overnight retracement slide from the weekly peak. Spot prices maintained modest intraday gains during the first half of the European session and are currently hovering around the 185.20 region, reflecting a 0.15% increase for the day.
The Japanese Yen (JPY) persists in its relative underperformance, driven by the Bank of Japan's (BoJ) dovish stance, serving as a significant tailwind for the GBP/JPY cross. Conversely, the British Pound (GBP) receives a marginal boost from a slightly stronger-than-expected UK GDP print. However, the anticipation of impending interest rate cuts by the Bank of England (BoE) restricts any substantial upward movement. According to the UK Office for National Statistics, the economy stagnated in the third quarter of 2023.
While this reading was marginally better than the projected 0.1% contraction, the annual growth rate stood at 0.6%, surpassing the expected 0.5%. This development alleviates concerns about an imminent recession and, to a larger extent, overshadows the disappointing releases of UK Manufacturing and Industrial Production figures.
Technical Perspective
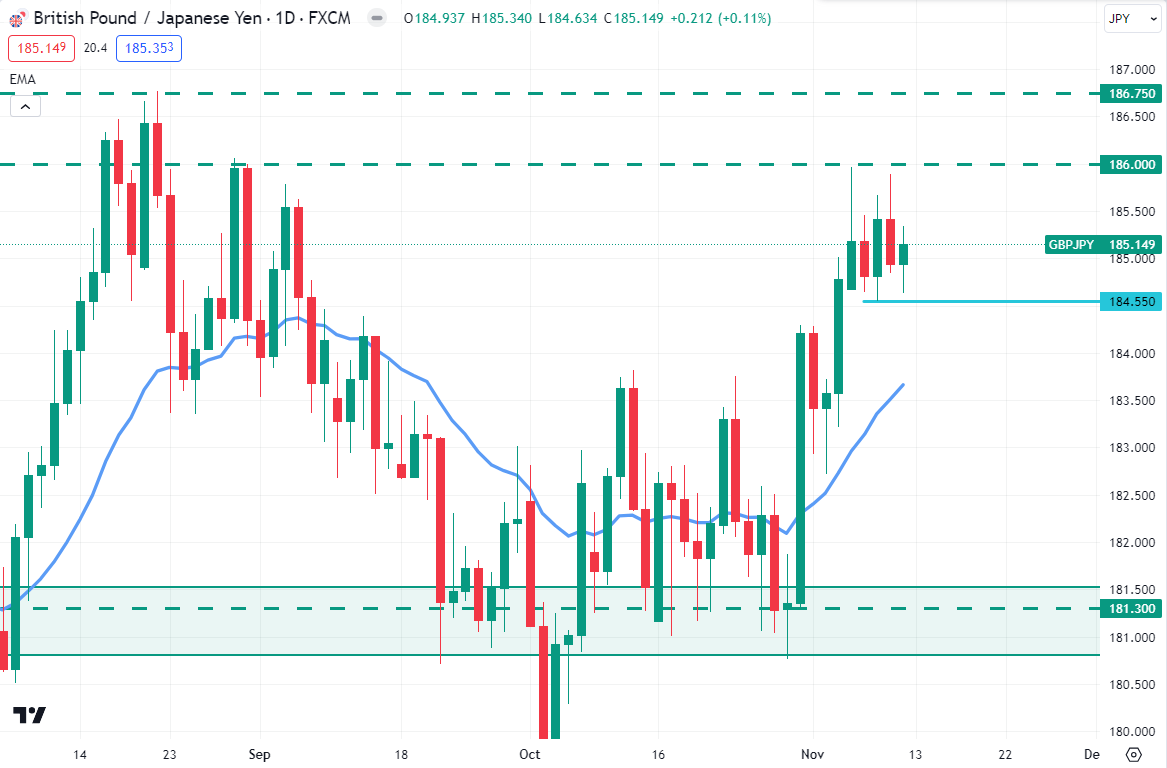
Source: TradingView
In the weekly chart, GBPJPY experienced a bullish continuation after bouncing from the dynamic level of 20 EMA. However, the recent daily candle suggests a corrective pressure, which indicates a pending bearish correction.
In the GBPJPY weekly bearish forecast, if the price can break below the 184.55 support level with a daily bearish candle close, bears may regain momentum and push the price down to the 181.30 price area in the days ahead.
On the upside, a simple trend following strategy from the lower timeframe price action could reach the price towards the 188.00 area.
NAS100
Fundamental Perspective
In the upcoming week of November 12th to 17th, 2023, the NAS100 index is poised for dynamic movements. Recent data indicates a bullish sentiment as technology stocks rally. Positive developments in major tech companies, driven by robust earnings reports and favorable economic indicators, are expected to influence the NAS100 positively. Market participants closely monitor the impact of inflation data and the Federal Reserve's monetary policy on the index.
Furthermore, the resilience of key tech players in navigating global supply chain challenges contributes to the overall positive outlook. Traders should remain vigilant for potential catalysts, including geopolitical events and macroeconomic shifts, that may influence the NAS100's weekly trajectory.
Technical Perspective
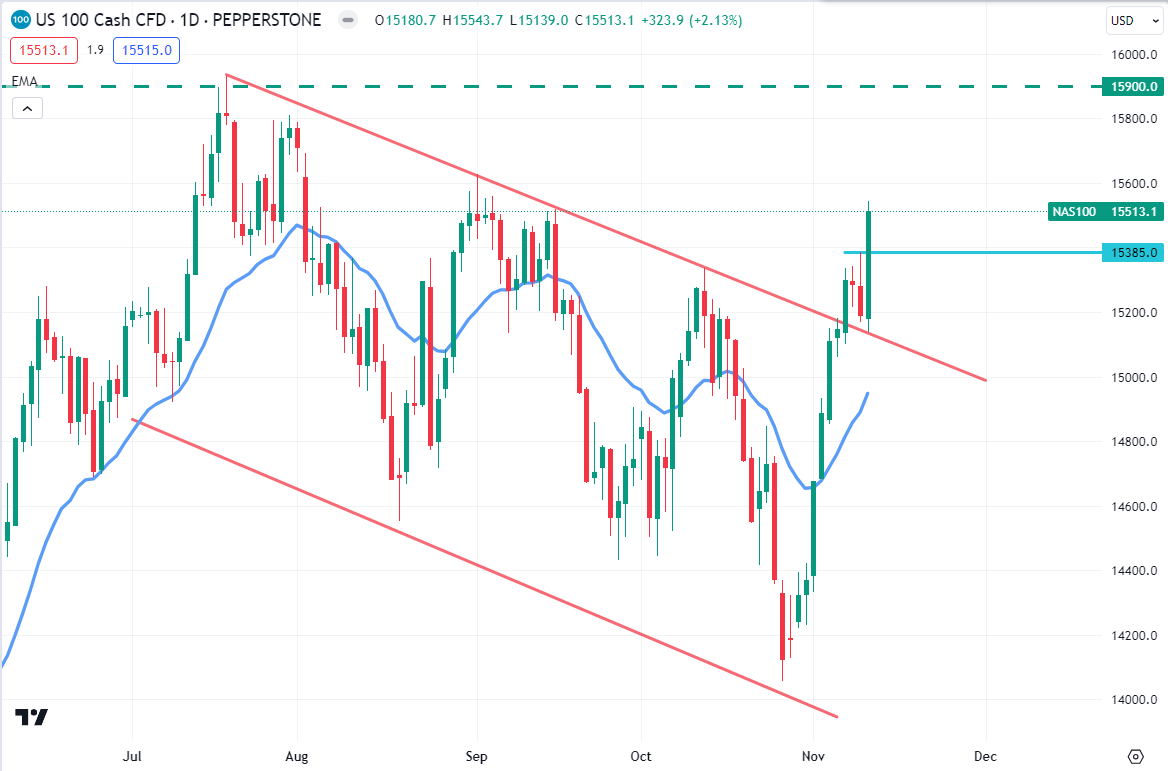
Source: TradingView
NAS100 broke above the weekly bearish channel’s resistance with a bullish candle close, which is supported by a bullish engulfing pattern from the 14066.43 bottom.
However, the daily price suggests a bearish correction towards the $15385.0 price area. Later on, if we find any strong daily bullish candle close from the $15385.0 price area, NAS100 may recover higher towards the $15900.0 key resistance area in the coming days.
S&P500 (SPX500)
Fundamental Perspective
In the approaching week of November 12th to 17th, 2023, the S&P 500 index is positioned for strategic movements, guided by recent market dynamics. Evidenced by robust corporate earnings and resilient economic indicators, the index showcases a bullish trajectory, bolstered by the positive performance of key sectors.
Investors should closely monitor developments related to inflation and Federal Reserve announcements, as they will significantly impact the S&P500's performance. Amidst global economic shifts, the S&P500's resilience lies in the adaptability of major corporations to prevailing market conditions.
Market participants are advised to stay attuned to geopolitical events and macroeconomic trends, acknowledging their potential influence on the S&P 500 during the upcoming trading week.
Technical Perspective
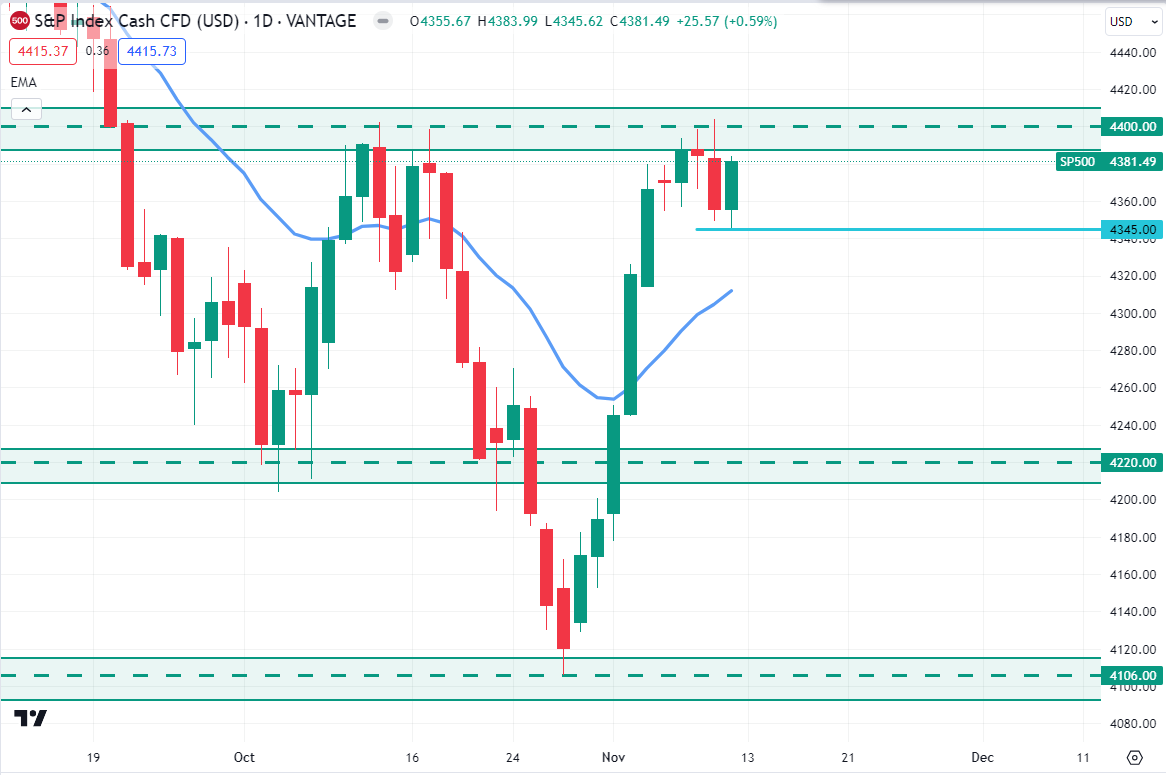
Source: TradingView
In the weekly chart, the S&P 500 is still on a strong bullish rally. After bouncing from the $4106.00 weekly support level, the bulls pushed the price upside quite impulsively but failed to break the $4400.00 resistance level.
Therefore, if the price can break below the $4345.00 support level with a daily bearish candle close, bears may push the price down to the $4220.00 support level in the coming days. On the bullish side, a stable market above the 4400.00 level could see the 4610.00 level, followed by a trend line breakout.
HK50
Fundamental Perspective
In the week spanning November 12th to 17th, 2023, the Hang Seng Index (HK50) anticipates nuanced movements shaped by recent market dynamics. Recent data reveals a cautious optimism, with the index navigating uncertainties influenced by global trade tensions and economic shifts. Key sectors, notably technology and finance, are poised to influence the HK50 as investors react to the latest corporate earnings reports and economic indicators. Geopolitical considerations, especially developments in the Asia-Pacific region, may introduce volatility to the index.
Market participants should remain vigilant to fluctuations in global commodity prices and central bank communications, as these factors will play a pivotal role in shaping the HK50's trajectory throughout the upcoming week. Traders are advised to adopt a comprehensive risk management strategy in response to the evolving landscape.
Technical Perspective
Source: TradingView
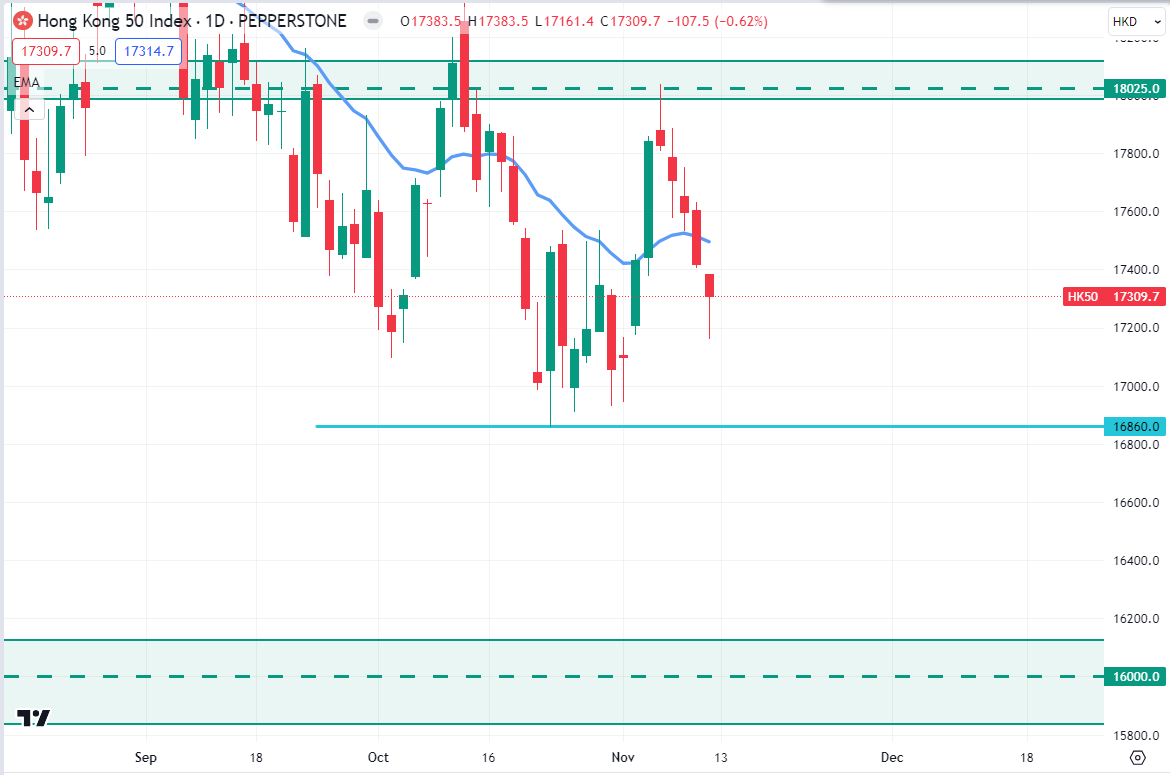
HK50 had an impulsive weekly bearish candle close after rejecting the $18025.0 resistance area last week. However, the price is still residing above the $16860.0 psychological price level.
As per the daily timeframe, HK50 may continue downward toward the $16860.0 price area in the days ahead. So, if the price can break below the $16860.0 price area with a daily bearish candle, bears may sustain the bearish momentum toward the $16000.0 price area.
Bitcoin (BTCUSD)
Fundamental Perspective
The price of Bitcoin surged to $38,000, reaching a level not seen in a year and a half, propelled by growing expectations of regulatory approval for a spot Bitcoin exchange-traded fund (ETF) in the United States. The positive sentiment among BTC traders is fueled by the scrutiny of 12 Bitcoin ETF applications by the US Securities and Exchange Commission (SEC). Remarkably, Bitcoin's ascent beyond $37,900 occurred despite an uptick in whale transactions exceeding $100,000.
The current Bitcoin rally, initiated in mid-October, has resulted in an impressive gain of almost 35% in the cryptocurrency's price. Analysts from Bloomberg, Eric Balchunas, and James Seyffart, suggest that the US SEC might greenlight some Bitcoin ETF applications before the January 10 deadline, especially considering the completion of the comment period for several applicants on Wednesday. They anticipate potential approval orders between November 9 and November 17.
Technical Perspective
Source: TradingView
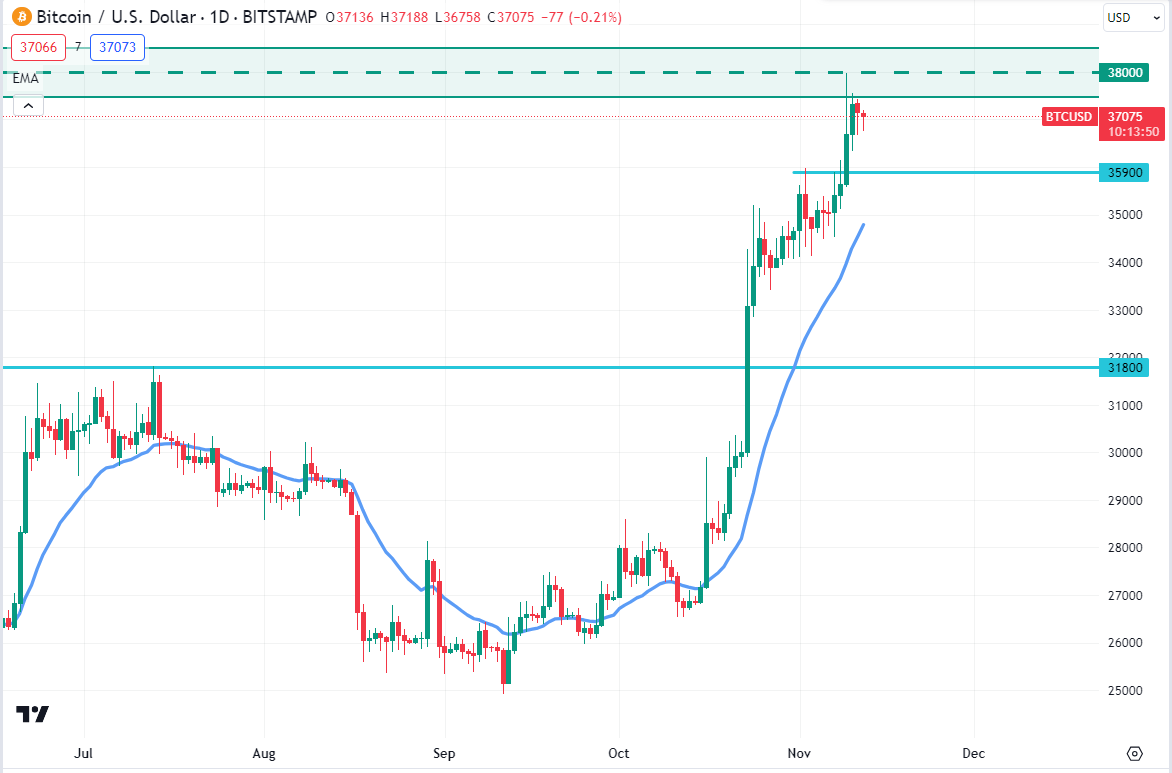
BTC price climbed higher and hit the $38,000 psychological event level. After breaking the dynamic level of 20 EMA on the weekly chart, the bulls pushed the price upside quite impulsively.
As per the daily scenario, if the price can break below the $35,900 price area with an impulsive daily bearish candle close, the BTC price may retrace the downside toward the $31,800 neckline level in the coming days.
Ethereum (ETHUSD)
Fundamental Perspective
Over the past eighteen months, the price of Ethereum has undergone a consolidation phase, adhering to an ascending trendline, with the $2,035 level presenting a formidable resistance point.
The optimistic outlook remains intact as long as Ethereum sustains its bullish momentum on both lower and higher time frames. Token holders are currently riding the wave, indicating the early stages of a potential bull market. However, a critical juncture lies in the altcoin's ability to remain above the ascending trendline, particularly at the psychologically significant $1,500 level. A breach and subsequent close below this level would invalidate the bullish thesis.
Technical Perspective
Source: TradingView
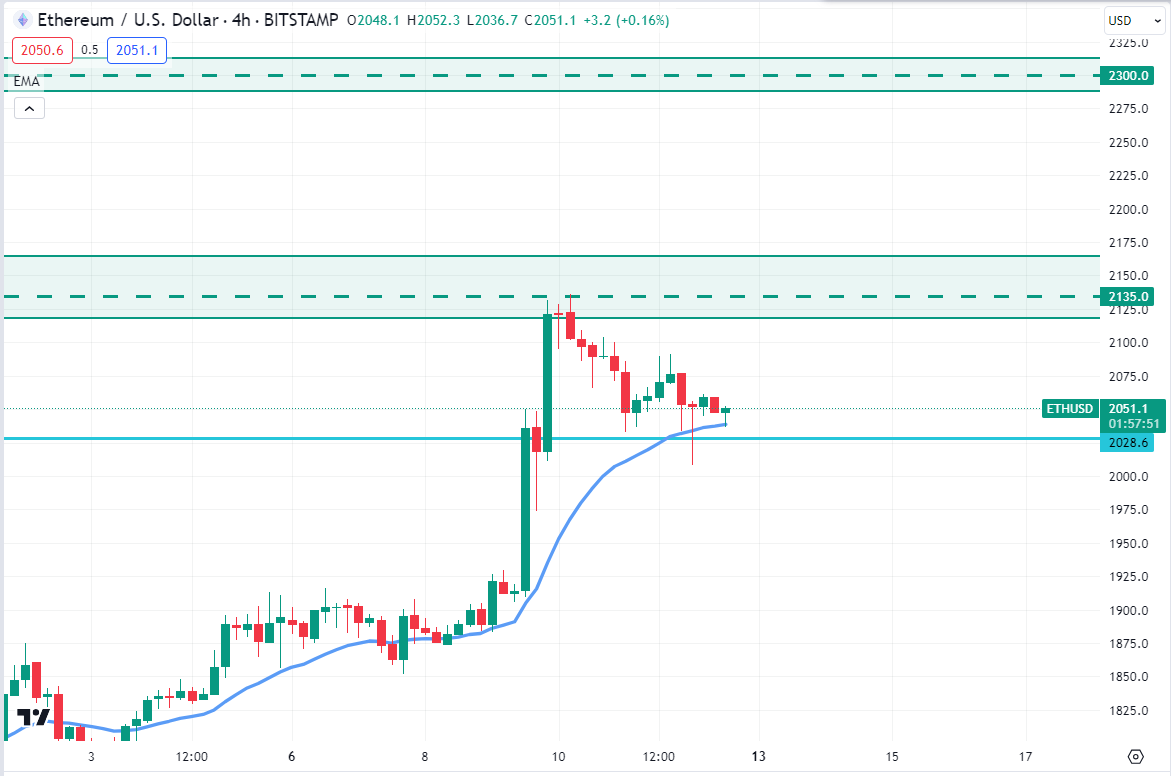
On the daily chart, ETH faced strong resistance around the $2135.0 psychological event level. After an impulsive bullish pressure last week, the bears regained momentum and pushed the price down to $2008.0 price area.
As per the H4 timeframe, if the price can have an impulsive bullish candle close above the $2060.0 price area, the bulls may sustain the bullish pressure toward the $2300.0 key level in the coming days.
Tesla Stock (TSLA)
Fundamental Perspective
HSBC has assigned Tesla (TSLA) stock a "Reduce" rating with a price target of $146. Currently, Tesla stock is in a consolidation phase, positioned directly above the $210 support level. According to HSBC analysts, a significant portion of Tesla's growth narrative is anticipated towards the end of the decade. Concurrently, President Joe Biden expresses support for the United Auto Workers (UAW) in their endeavor to unionize Tesla factories.
As Friday afternoon draws to a close, Tesla stock maintains a 2.3% gain, outperforming the NASDAQ Composite, which has seen a 1.9% rally. The stock hovers precariously just above a crucial support zone at $210. A breach of this level could potentially lead to a 24% decline in a long-term support level. The negative impact of an analyst report on Thursday has notably impacted the leading electric vehicle (EV) provider, exacerbated by President Biden's endorsement of the unionization efforts within Elon Musk's company.
In the broader context, the US equity market is experiencing a late Friday surge, with both the S&P 500 and NASDAQ Composite aiming for a closing gain between 1% and 2%.
Technical Perspective
Source: TradingView
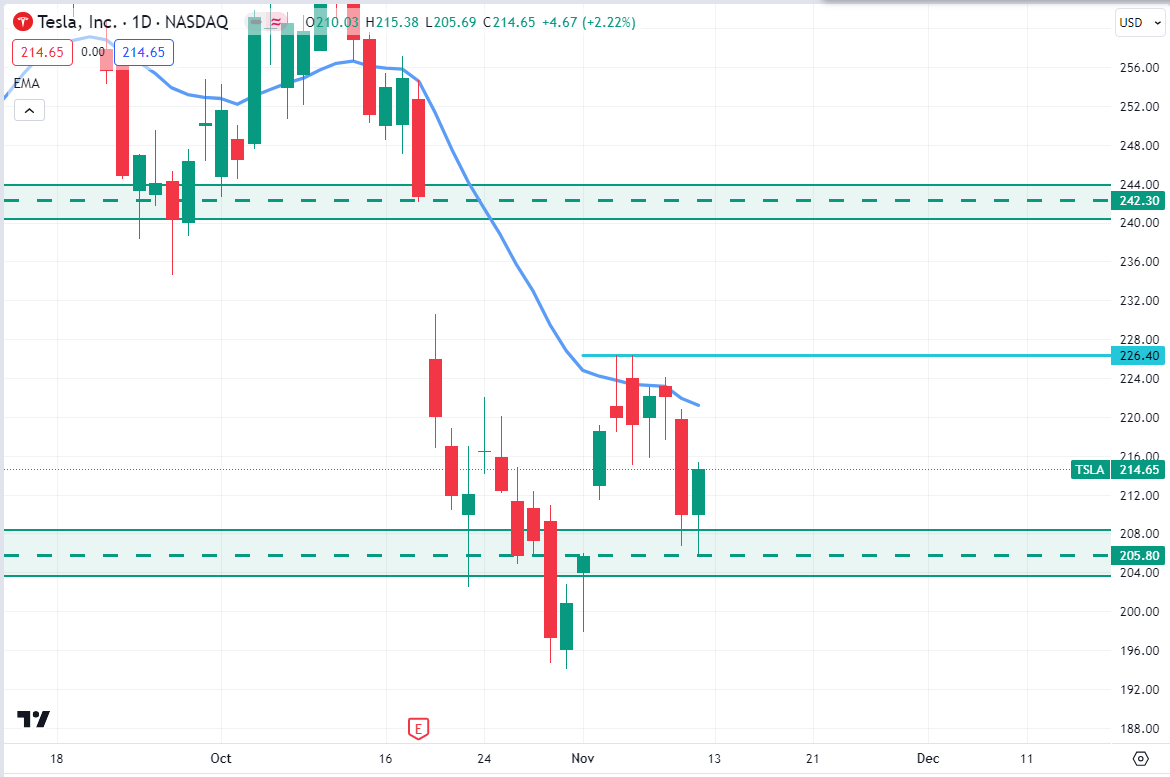
In the weekly chat, the TSLA stock price still resides below the dynamic level of 20 EMA. However, the price failed to break below the $205.80 psychological event level and had a weekly bullish candle close above it.
As per the daily chart, if the price can break above the $226.40 neckline with an impulsive daily bullish candle close, the price may recover higher toward the $242.30 price area in the days ahead.
Gold (XAUUSD)
Fundamental Perspective
On Friday, XAU/USD prices are undergoing downward testing, approaching the $1,930 mark. This follows yesterday's remarks from Federal Reserve (Fed) Chairman Jerome Powell, adopting a hawkish stance by suggesting that the Fed might not have implemented a sufficiently restrictive monetary policy to curb inflation effectively.
In addition to Chairman Powell, various Fed policymakers have made statements throughout the week, indicating that interest rates may not be elevated enough to adequately contain inflation within the Fed's 2% target in the foreseeable future. This hawkish shift has dismantled the prevailing market narrative, dispelling the notion that the Fed had concluded its cycle of rate hikes and was potentially entering a phase of rate cuts.
Despite investors anticipating the conclusion of the Fed's rate hike cycle last week, prompted by a disappointing US Nonfarm Payrolls (NFP) report, Fed officials have emphasized this week that a single unfavorable labor data reading is insufficient to alter the dot plot.
Technical Perspective
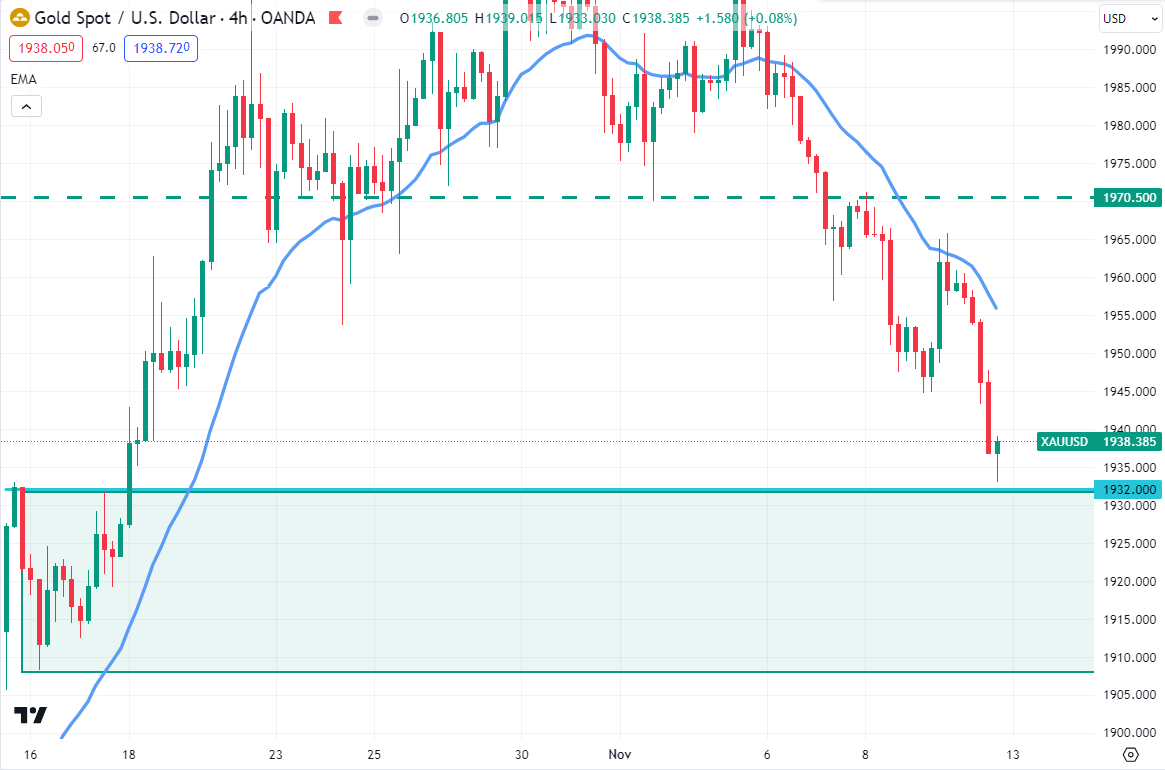
Source: TradingView
On the daily chart, Gold price is approaching the demand zone area which is around the $1932.50 - $1908.70 area, while the higher timeframe’s market trend is still bullish.
So, if the price comes down to the daily demand zone area and has a strong H4 bullish candle close above the $1932.00 price level, it would be a strong long opportunity. However, a deeper correction is possible towards the 1900.00 psychological level. However, a bearish D1 candle below the 1900.00 level could be a short opportunity, targeting the 1870.00 level.
Crude Oil (WTI)
Fundamental Perspective
On Friday, West Texas Intermediate (WTI) Crude Oil prices staged a 2.8% rebound, recovering from a daily low of $75.35 and testing the $77.50 mark as the market concluded a challenging week marked by an 8.61% peak-to-trough decline.
Widespread apprehensions about heightened tensions and potential geopolitical spill outs from the Gaza Strip conflict have subsided, giving way to fresh investor concerns regarding the sluggish growth of global Crude Oil demand. The prevailing assumption that global oil production would fall short of demand, initially propelling WTI to year-long highs around $94.00 per barrel, is now being reevaluated.
Technical Perspective
On the weekly chart, Oil price remains below the dynamic level of 20 EMA. However, the price bounced from the $75.00 weekly event area and had a daily bullish candle close on Friday last week.
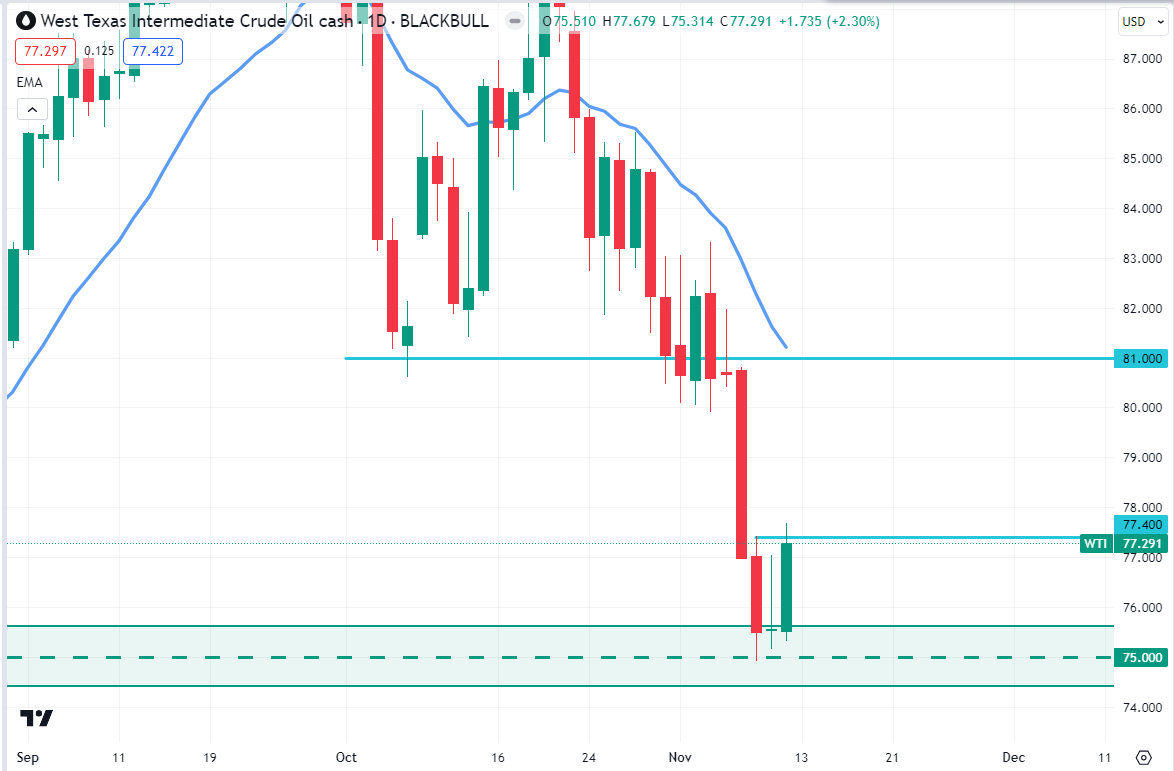
Source: TradingView
As per the daily chart, if the price can have a daily bullish candle close above the $77.40 neckline area, the price may recover higher toward the $81.00 price area.
On the bearish side, the 74.12 level would act as strong support, whereas a selling pressure below this level could lower the price towards the 67.86 level.


