EURUSD
Fundamental Perspective
The U.S. election results point to a significant economic shift as Donald Trump returns to the presidency with Republican control of the Senate and potentially the House. His platform—focused on tax cuts, deregulation, and protectionist trade policies—promises to impact both the U.S. and global economies.
Anticipated fiscal expansion and tariffs have stirred inflation concerns, leading investors to expect a shift in the Federal Reserve's strategy. Markets foresee fewer rate cuts or even hikes to curb inflation if it rises, which has already boosted bond yields and strengthened the dollar, causing the EUR/USD to dip as low as 1.0681.
In Europe, already grappling with economic stagnation, Trump's trade stance poses additional challenges. European Central Bank officials are concerned that U.S. policies could hamper the EU's recovery, especially in vulnerable economies like Germany and France. This concern adds weight to upcoming European inflation and GDP data, watched closely by investors gauging the Eurozone's resilience.
This week, the U.S. and German inflation releases will be pivotal, likely influencing central bank decisions and shaping market responses as global economic uncertainty grows. Markets brace for a new phase as Trump's policies begin to take effect.
Technical Perspective
The EURUSD pair continues to decline after a pause as the weekly chart shows after creating a valid double-top pattern.
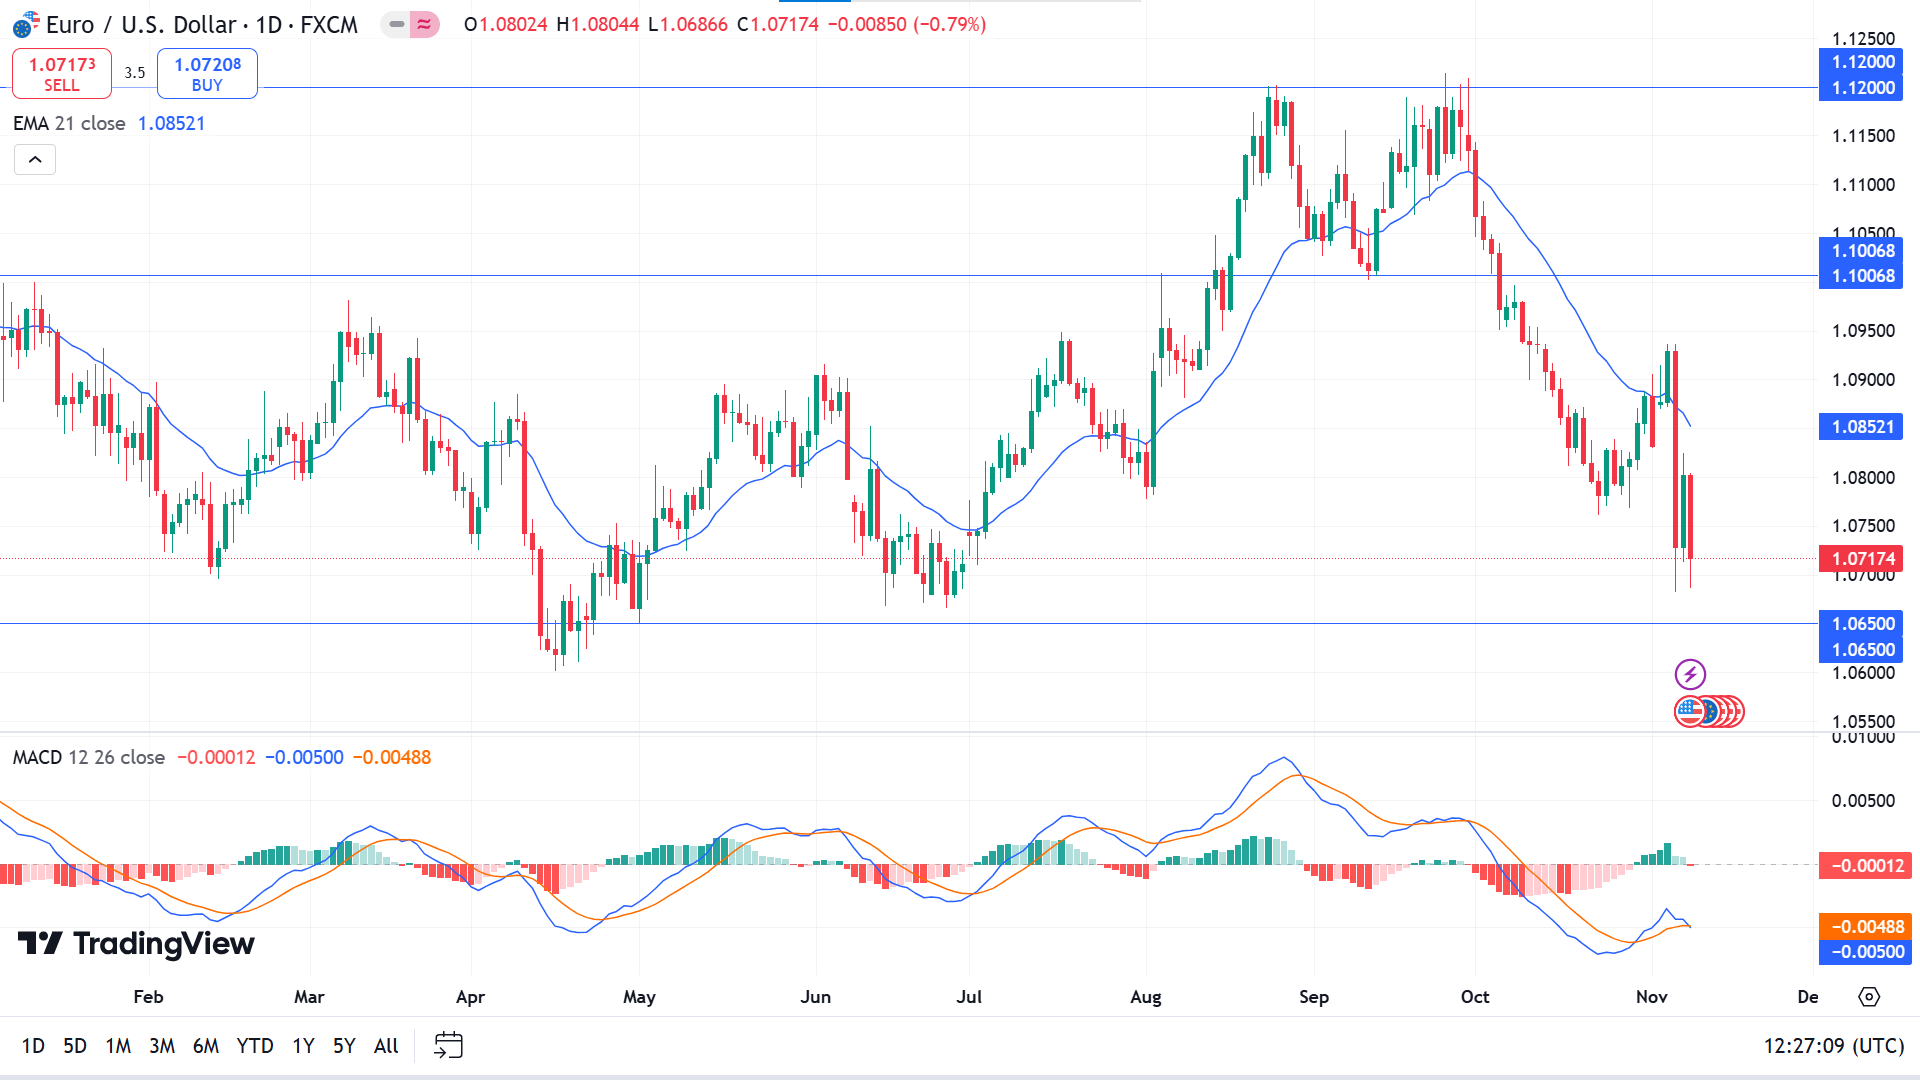
The pair erases the slight gain from the previous week and continues to decline as it started from 1.1200. The MACD indicator window confirms the bearish pressure as the dynamic signal lines create a fresh bearish crossover and reach below the midline of the indicator window. While the price also remains below the EMA 21 line, confirming the recent bearish pressure.
The current market context suggests that the price may continue to decline and find support from the 1.0650 level before bouncing back to the upside.
On the other hand, a bullish recovery is possible at the 1.0650 level, from where the price may bounce back toward the resistance near the 1.1000 level.
GBPJPY
Fundamental Perspective
The yen's recent decline, extending since mid-September, worsened after the U.S. election as the dollar reached a three-month peak at 154.71 yen. This slide primarily reflects uncertainty around the Bank of Japan's timing for a rate hike. Currently, markets assign a 40% chance of a 25-basis-point increase in December, though the BoJ may hold off until after next year's spring wage negotiations.
To solidify expectations for an earlier hike, Japan would likely need stronger growth and inflation figures. Thus, Friday's Q3 GDP report could provide slight relief for the yen if results exceed forecasts.
In the UK, 10-year gilt yields have also risen over 20 basis points since the Labour government's recent budget announcement. Although it includes £40 billion in tax hikes, planned spending increases are expected to push up borrowing needs and potentially boost GDP growth in the near term.
The Bank of England, accounting for budget effects in its projections, has indicated caution on easing amid ongoing wage growth concerns. Key UK economic indicators are due this week, including wage and employment data, followed by Q3 GDP figures on Friday, with growth expected to slow to 0.2% from the prior quarter's 0.5%.
Technical Perspective
The last weekly candle closed red but did not reach the previous red candle low, which is a sign that there is more confirmation needed for the price to turn completely bearish.
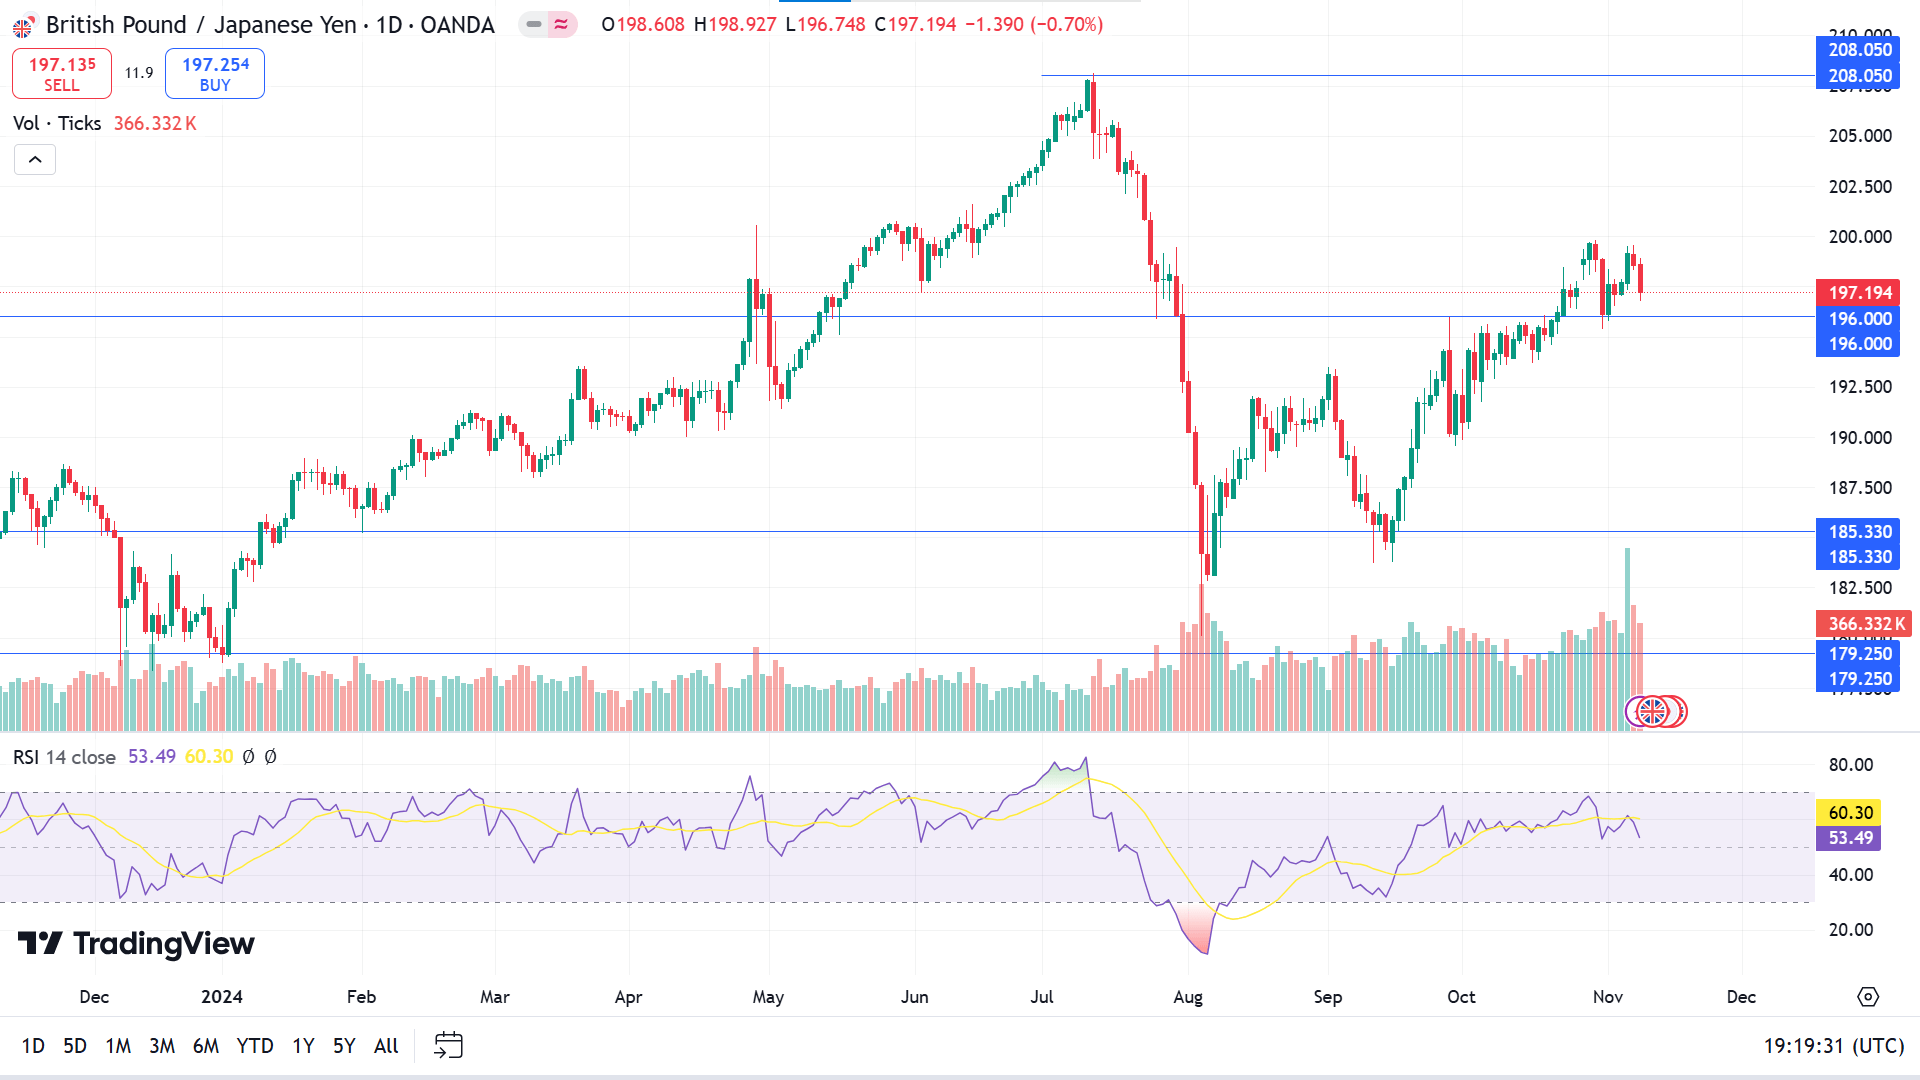
The price validates the 196.00 level by retesting and bouncing back and the level is an acceptable support level working as a barrier for bulls. The RSI indicator reading remains neutral, the dynamic signal line floats above the midline of the indicator window and the volume indicator confirms bears may be losing power at this level.
As long as the price remains above the 196.00 level, the bullish outlook remains intact as it can hit the 208.05 in the upcoming days. Meanwhile, the bullish setup will be invalid if a daily candle closes red below the 196.00 level. If it occurs, buyers may wait till the price gets to the next support near 185.33.
NASDAQ 100 (NAS100)
Fundamental Perspective
U.S. equity indexes closed at record highs Friday, capping a strong week as Donald Trump secured the 2024 presidential election. The Dow Jones Industrial Average rose 0.6% to 43,989, the S&P 500 gained 0.4% to 5,995.5, and the Nasdaq Composite inched up 0.1% to 19,286.8. Utilities and real estate led sector advances, while materials, communication services, and technology saw slight declines.
For this week, the Nasdaq surged 5.7%, the S&P 500 climbed 4.7%, and the Dow added 4.6% as investor sentiment strengthened with Trump's return to the White House.
The Federal Reserve cut its benchmark rate by 25 basis points on Thursday, following a September reduction. Treasury yields were mixed Friday, with the two-year rate up to 4.25% and the 10-year down slightly to 4.31%.
November's preliminary consumer sentiment, as measured by the University of Michigan, reached a six-month high, with year-ahead inflation expectations at their lowest since December 2020.
In corporate news, Axon Enterprise jumped nearly 29% after exceeding earnings expectations. Fortinet and Tesla also gained, while Airbnb and Akamai saw sharp declines due to disappointing quarterly results. Meanwhile, crude oil prices fell 2.6% to $70.45 as supply concerns eased.
Technical Perspective
The last weekly candle finished as a solid long green candle reflecting recent bullish pressure on the asset price, which leaves buyers optimistic about holding on to the asset.
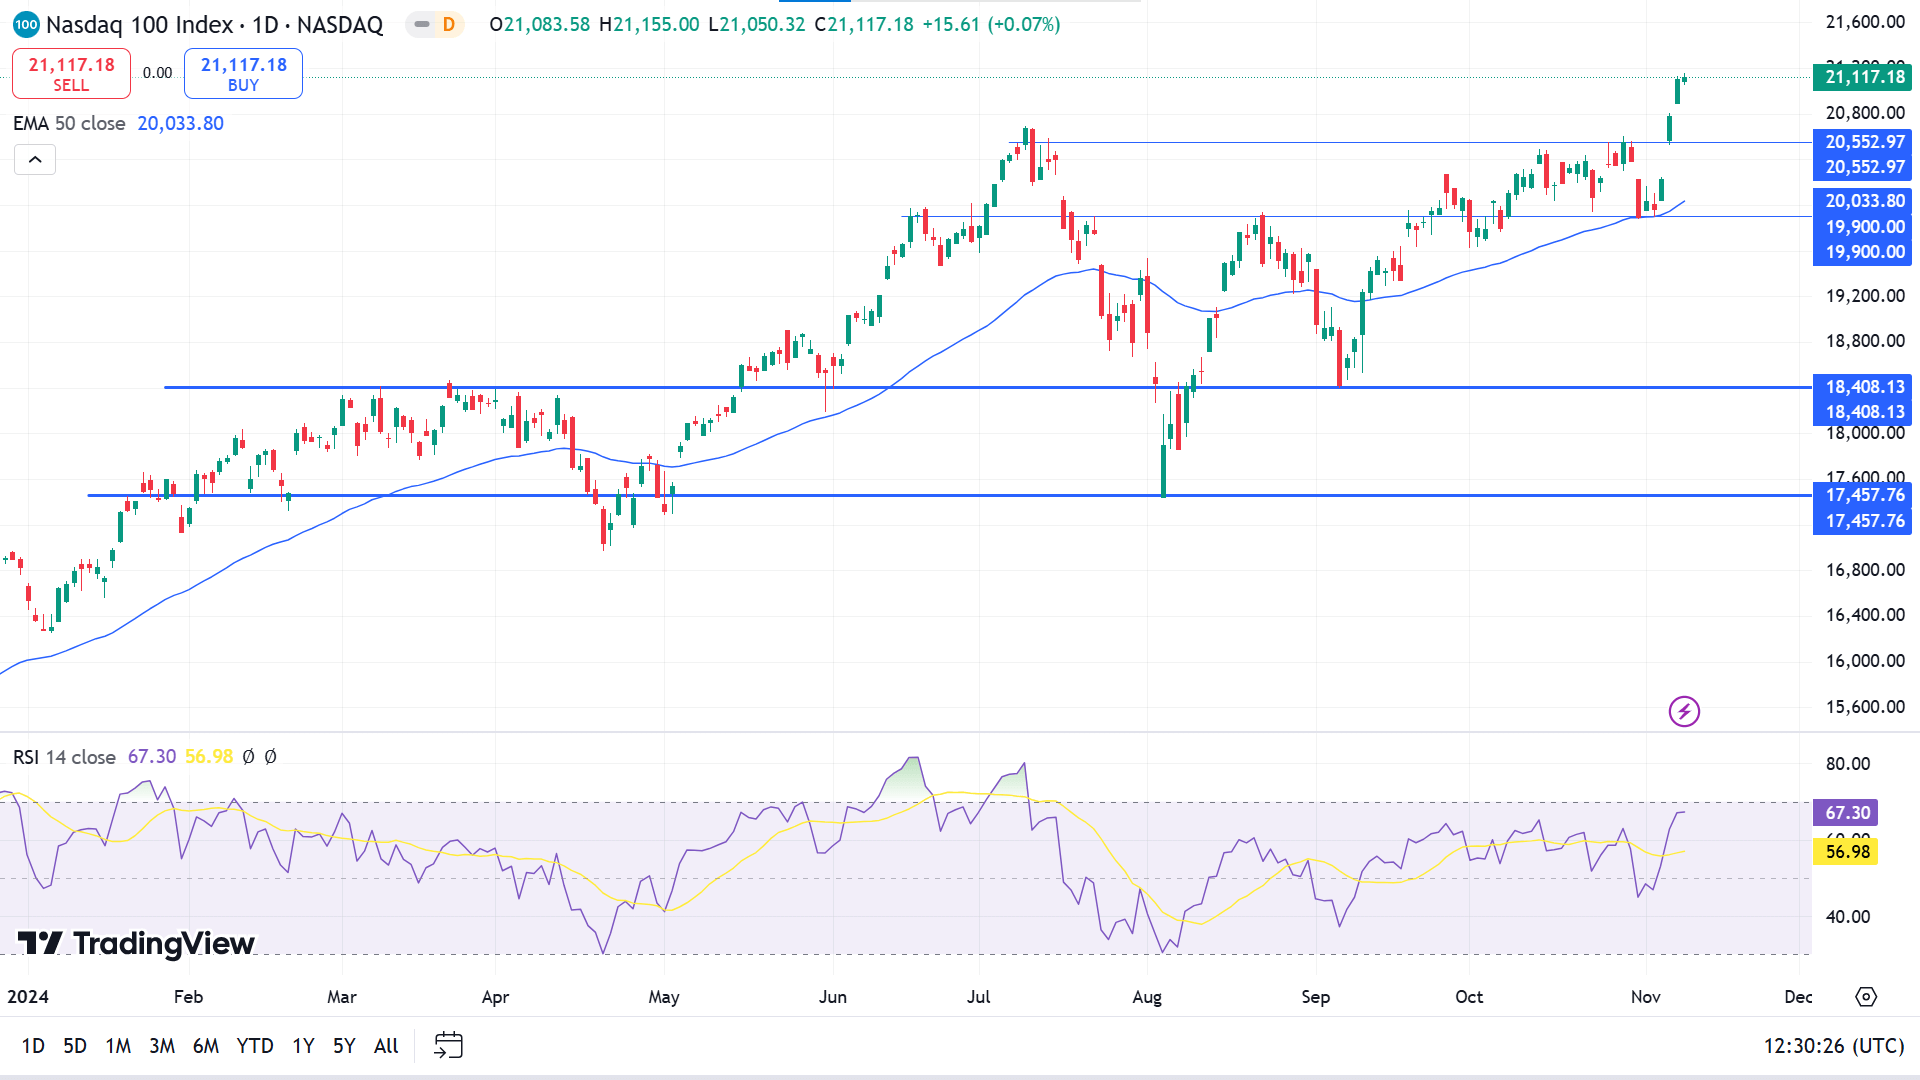
A valid breakout occurred at the triangle pattern on the daily chart, which indicates the price may head to create a new ATH. In the meantime, the RSI indicator reading remains neutral as the dynamic signal line floats below the upper line of the indicator window and the price moves above the EMA 50 line, supporting the recent bullish pressure.
However, the bullish signal will be invalid if any daily candle closes red and below the 20,552.97 level. It will enable the price to get to the support near 19900.00 to generate more buy pressure to regain the peak.
S&P 500 (SPX500)
Fundamental Perspective
The S&P 500 closed just under the 6,000 mark on Friday, delivering strong weekly gains after Donald Trump won the U.S. presidential election and the Federal Reserve implemented a 25-basis-point rate cut. The index finished at 5,995.54, up from 5,728.80, marking a rebound after two consecutive weeks of losses. All sectors advanced, with consumer discretionary leading the way with a 7.6% rise, while energy, industrials, financials, and technology also outpaced the index's 4.7% weekly gain.
Trump's victory over Kamala Harris has turned investor focus toward potential policy shifts, including new tariffs, immigration changes, and benefits to major tech companies. The Fed reduced rates to a 4.50%-4.75% range, following a 50-basis-point cut in September. Fed Chair Jerome Powell noted that the election results are not expected to affect short-term monetary policy decisions, including at the FOMC's December meeting.
The services sector showed continued growth in October, though manufacturing remained in contraction. The consumer discretionary rally was led by a 29% surge in Tesla shares, pushing the automaker's market cap past $1 trillion. The tech sector benefited from Palantir's 39% rise following strong earnings and an upward revision in guidance amid AI platform growth.
Technical Perspective
The weekly chart confirms the price is in a solid bullish trend as it reached a new ATH last week and ended as a long green candle.
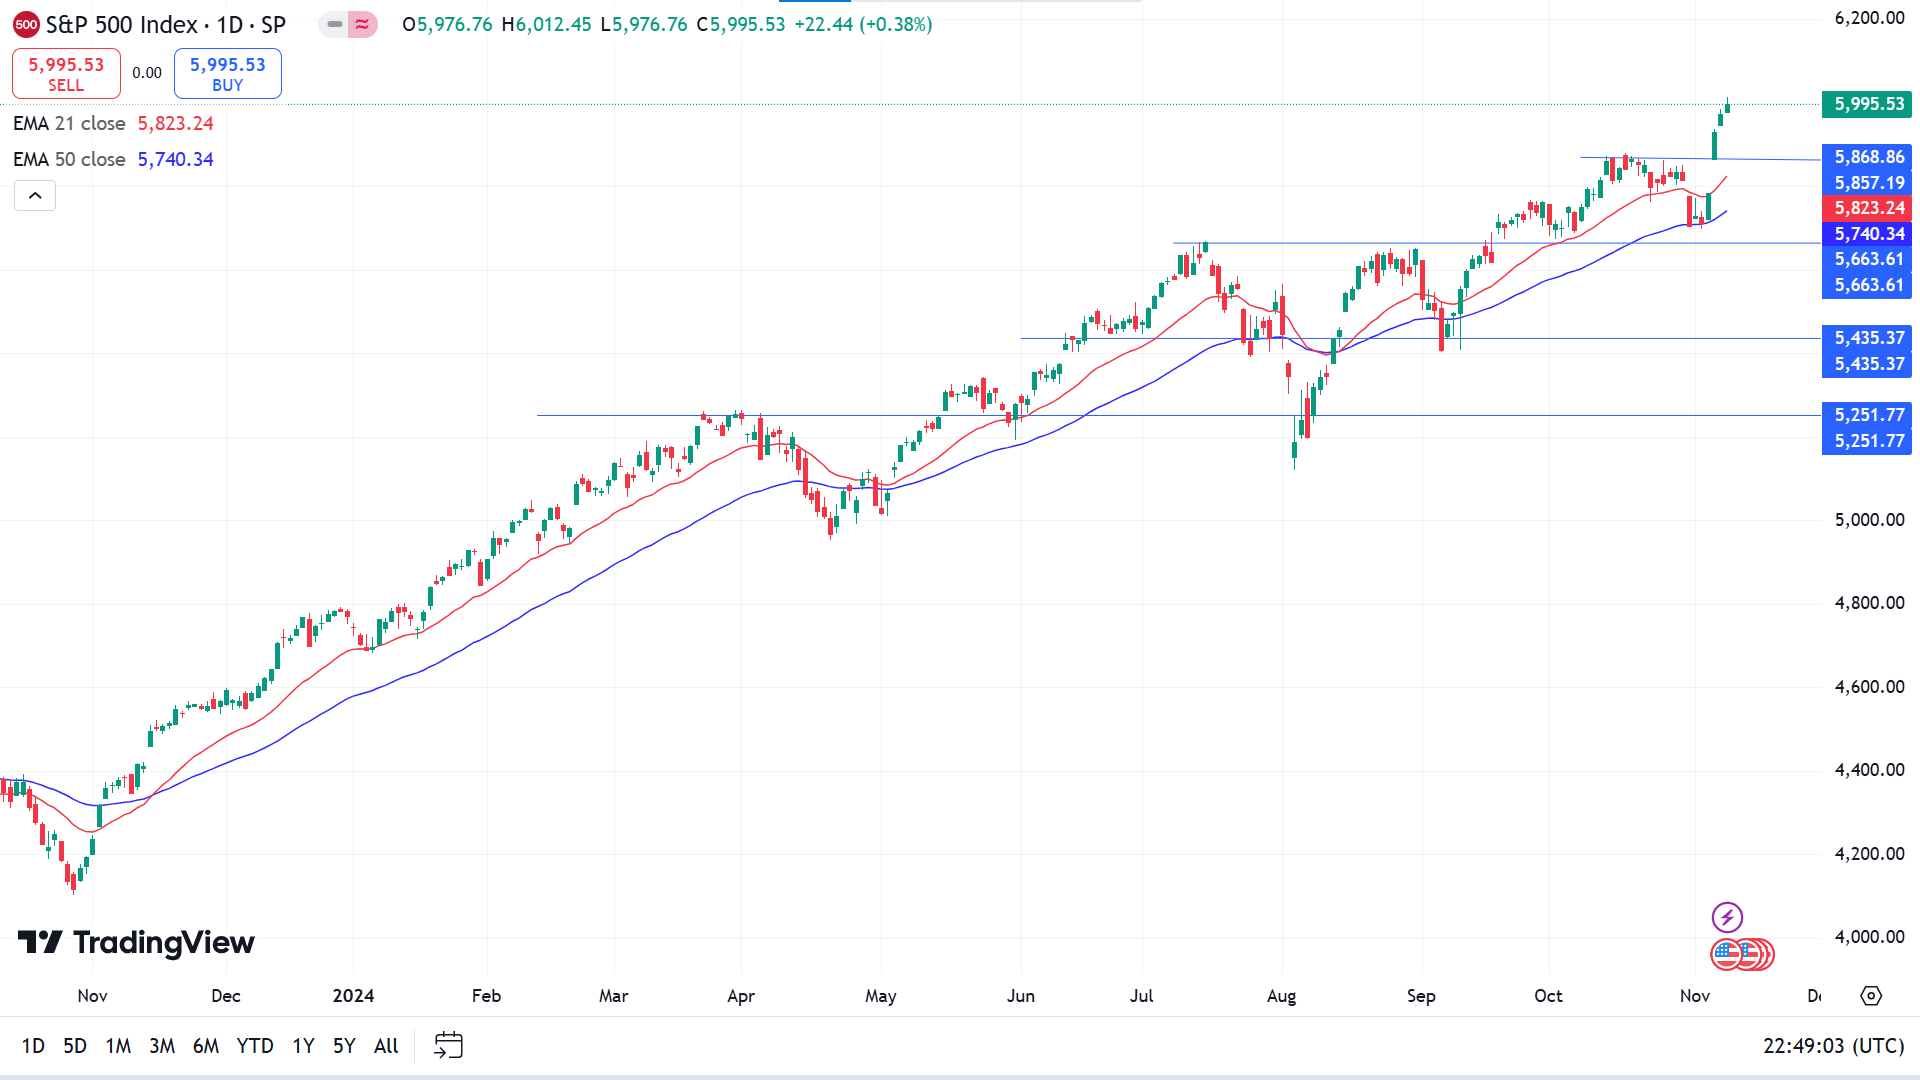
The daily S&P chart shows the price continues to have a bullish trend due to strong buy pressure in recent days. The EMA 21 line continues to float above the EMA 50 line confirming the bullish pressure.
The market sentiment confirms that buyers may seek long positions from the 5868.86 zone. A proper validation from the support may enable investors to the current ATH of 6012.45 or above.
At the same time, if the bulls continue to lose pressure and the price reaches below 5868.86, it will enable bears to lead toward the next support near 5740.33. In addition, if the EMA 21 line reaches below the EMA 50 line it will indicate solid bearish pressure on the asset price.
Gold (XAUUSD)
Fundamental Perspective
Gold prices edged lower on Friday as the U.S. Dollar recovered despite declining Treasury yields. Following Donald Trump's election win, traders trimmed positions in the so-called “Trump trade,” driven by lingering uncertainties around his potential tariff policies.
U.S. equities rallied, setting aside election-related concerns that had earlier supported gold's rise. With political risk now easing, investors are focusing on Trump's economic agenda. The dollar strengthened despite forecasts of a less dovish Federal Reserve, as some of Trump's proposed policies are seen as inflationary, potentially prompting a more cautious stance from the Fed.
The Federal Reserve reduced interest rates on Thursday, highlighting a strong economy, a cooling labor market, and disinflationary trends, although officials noted that inflation remains somewhat above the 2% target. Fed Chair Jerome Powell did not offer forward guidance, saying current economic strength gives the Fed flexibility on rate cuts, while noting policy is still restrictive.
The University of Michigan's Consumer Sentiment for November exceeded October's level, reflecting mixed inflation expectations among Americans. Next week, gold traders will closely watch comments from Fed officials and data releases on consumer and producer inflation, along with retail sales, all of which could impact gold's direction.
Technical Perspective
The last weekly candle closed red after a gravestone doji candle, leaving sellers optimistic for the next weeks as the price continues to decline, although the long wick on the downside still reflects bulls' presence.
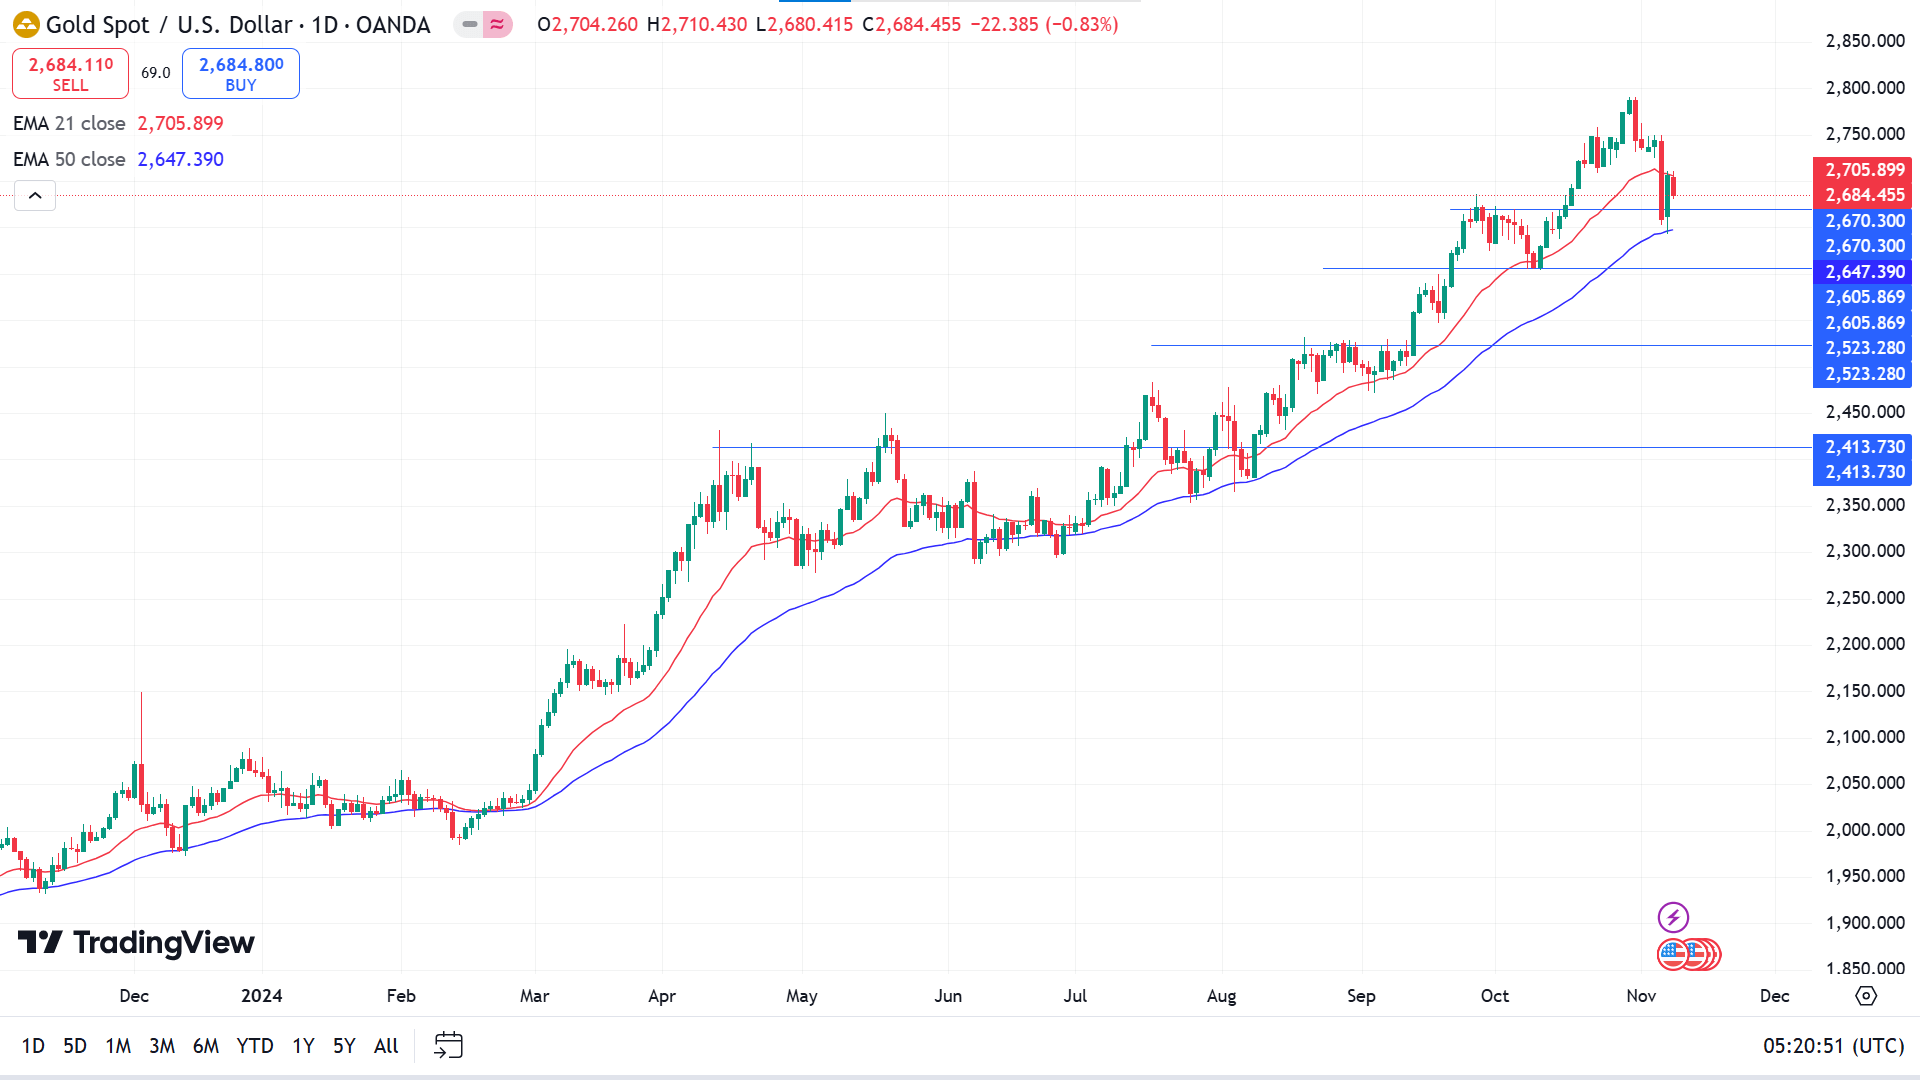
The price floats between the EMA 21 and EMA 50 lines, which act as a dynamic support resistance level. Where the price gets above the EMA 21 signaling full bullish and reaching below the EMA 50 line, will declare significant bearish pressure on the asset price.
Bulls give a break in the daily chart, decline back to the 2670.300 support level, and bounce above to make a potential upside move toward the ATH near 2790.17 or further upside.
In contrast, the sellers may be interested if a red daily candle closes below 2650.00, it may guide the price toward the next support near 2605.86.
Bitcoin (BTCUSD)
Fundamental Perspective
Bitcoin hit a record high of $76,825 on November 7 and has since held firm above $76,000. On-chain data reveals a surge in demand for BTC, particularly from U.S.-based traders on Coinbase over the last two weeks.
The Federal Reserve's recent 25-basis-point rate cut added fuel to Bitcoin's bullish momentum, sparking speculation that BTC could soon test the $80,000 mark. Bitcoin's current uptrend began after Donald Trump's November 5 election victory, with momentum intensifying after the Fed's dovish move on November 7.
As of November 8, Bitcoin trades around $76,250, marking a 13% increase from its November 5 opening of $67,866. With nearly all current BTC holders in profit, many are reluctant to sell, anticipating further gains as the Fed's dovish outlook may attract more capital into riskier assets through Q4 2024.
The increased demand is reflected in CryptoQuant's Coinbase Premium Index (CP Index), which tracks price differences between Coinbase and Binance. Positive values on the CP Index signal higher BTC prices on Coinbase, reflecting strong demand from U.S.-based investors who prefer the regulated environment of Coinbase over global trading on Binance.
Technical Perspective
BTCUSD reached a record high this week, breaking above the range where it has been floating since Q1 and the long green candle declares significant bullish pressure which may drive the price toward the anticipated $100,000 level, as many crypto experts predict.
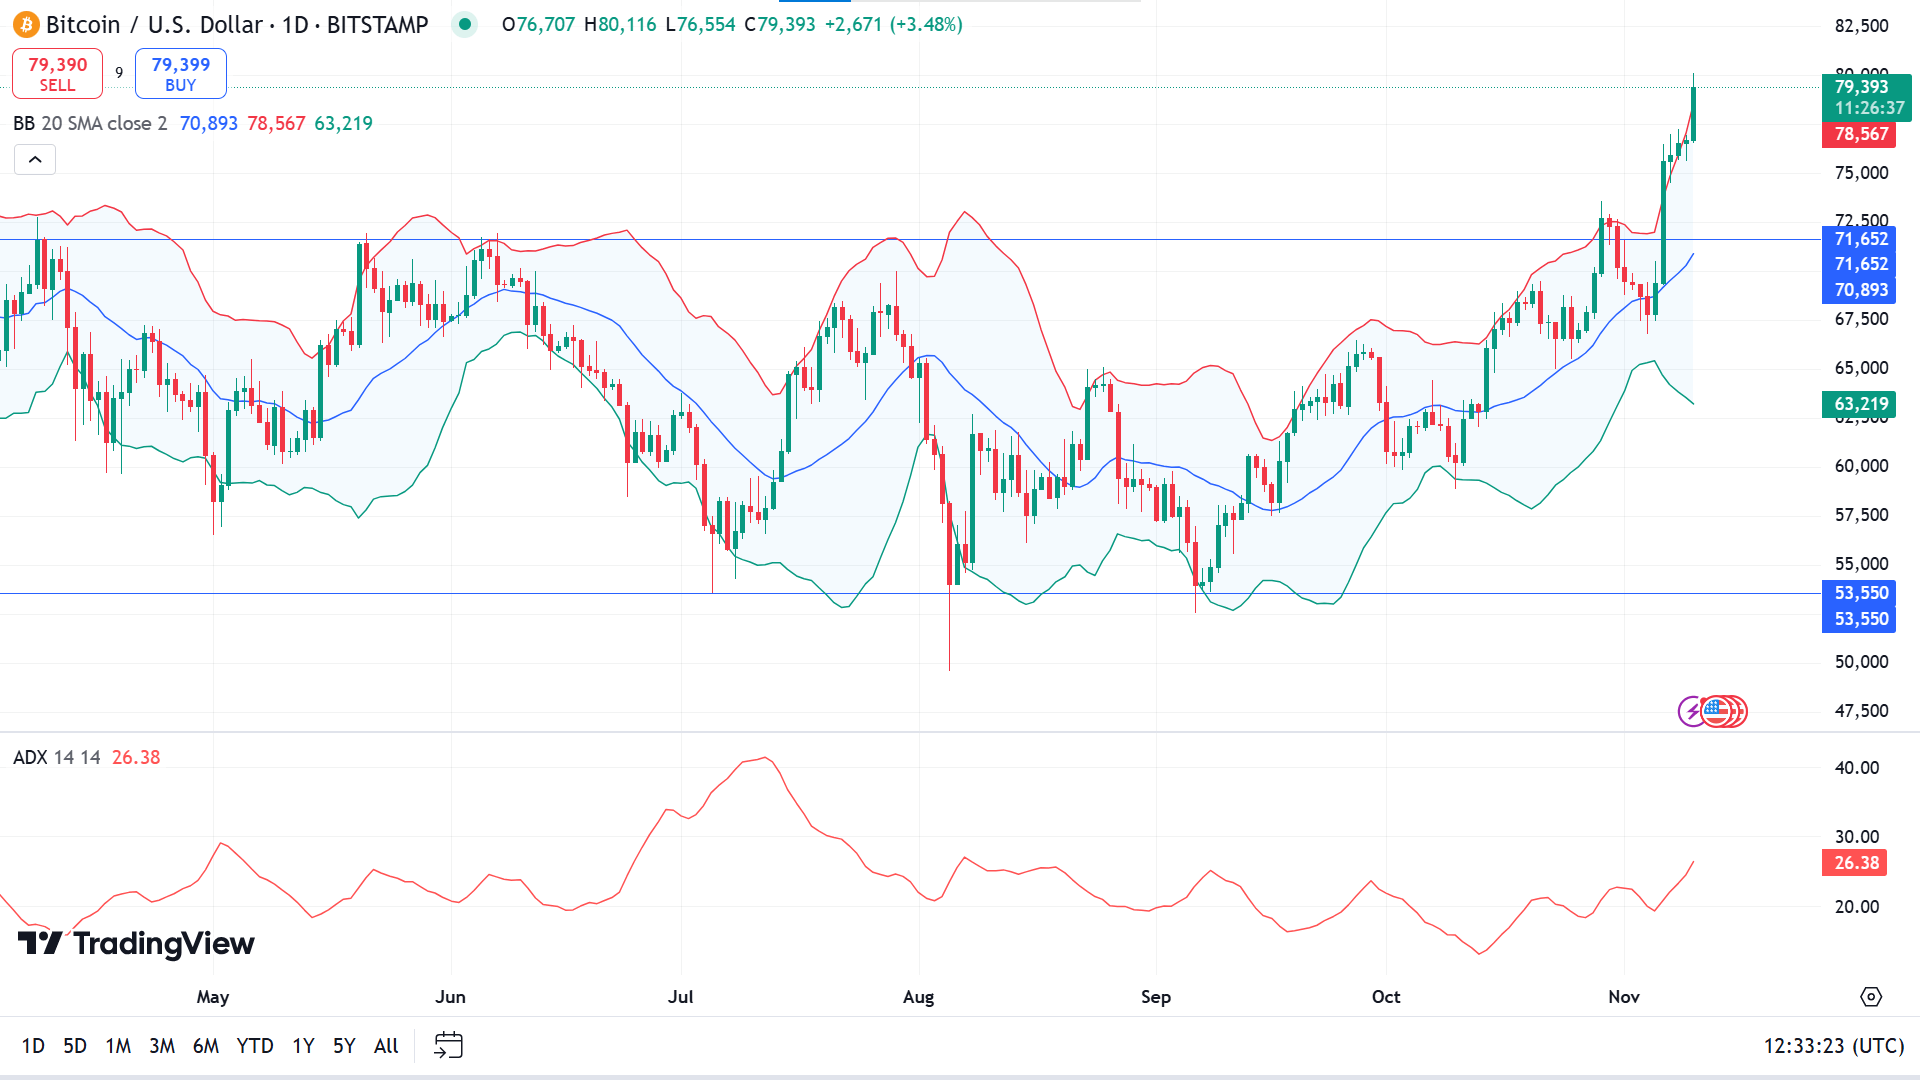
The price is moving along with the upper band of the Bollinger band indicator at the daily chart, declaring full bullish pressure on the asset. According to price action suggestions, more adequate long positions will be open if the price retouches the 72988-71652 zone. As the price is at the upper band of the Bollinger bands confirms the price is overbought and a correction is expected, but the ADX indicator reading confirms sufficient strength for the current bullish trend.
Meanwhile, the buy setup will be invalid if the price continues to decline below the 71652.00 level. It will indicate the price at least gets to the primary support near the 63282.00 level.
Ethereum (ETHUSD)
Fundamental Perspective
The Ethereum Foundation (EF) unveiled its 2024 annual report, aiming to increase transparency and address recent scrutiny over its treasury management. Executive Director Aya Miyaguchi provided insights into EF's $970 million reserves and clarified an August transaction that saw 35,000 ETH (worth $94 million) moved to Kraken, explaining it was part of a routine treasury strategy rather than an immediate sale. Due to regulatory limitations, EF cannot disclose specific transaction plans, but Miyaguchi assured that any future sales would be deliberate and strategic.
EF's report shows 81.3% of its treasury in cryptocurrency, with 99.45% of those assets in Ether (ETH). It also revealed that EF contributed $240.3 million, nearly half of the $497 million spent on ecosystem projects, with additional funding from collaborators like MakerDAO, Optimism, and Gitcoin, reflecting a cooperative environment within Ethereum.
Additionally, the Ethereum ecosystem collectively holds over $22 billion in reserves across various DAOs and organizations, including Optimism and Uniswap. EF also introduced a conflict-of-interest policy requiring members to disclose any investments exceeding $500,000 (excluding ETH) to maintain impartial decision-making in treasury management.
Technical Perspective
The weekly chart confirms the price of ETHUSD successfully broke out from the range of 2175.65 to 2755.13, which it remained since Aug. The last solid green candle reveals excessive bullish pressure on the asset which may drive the price toward the resistance levels.
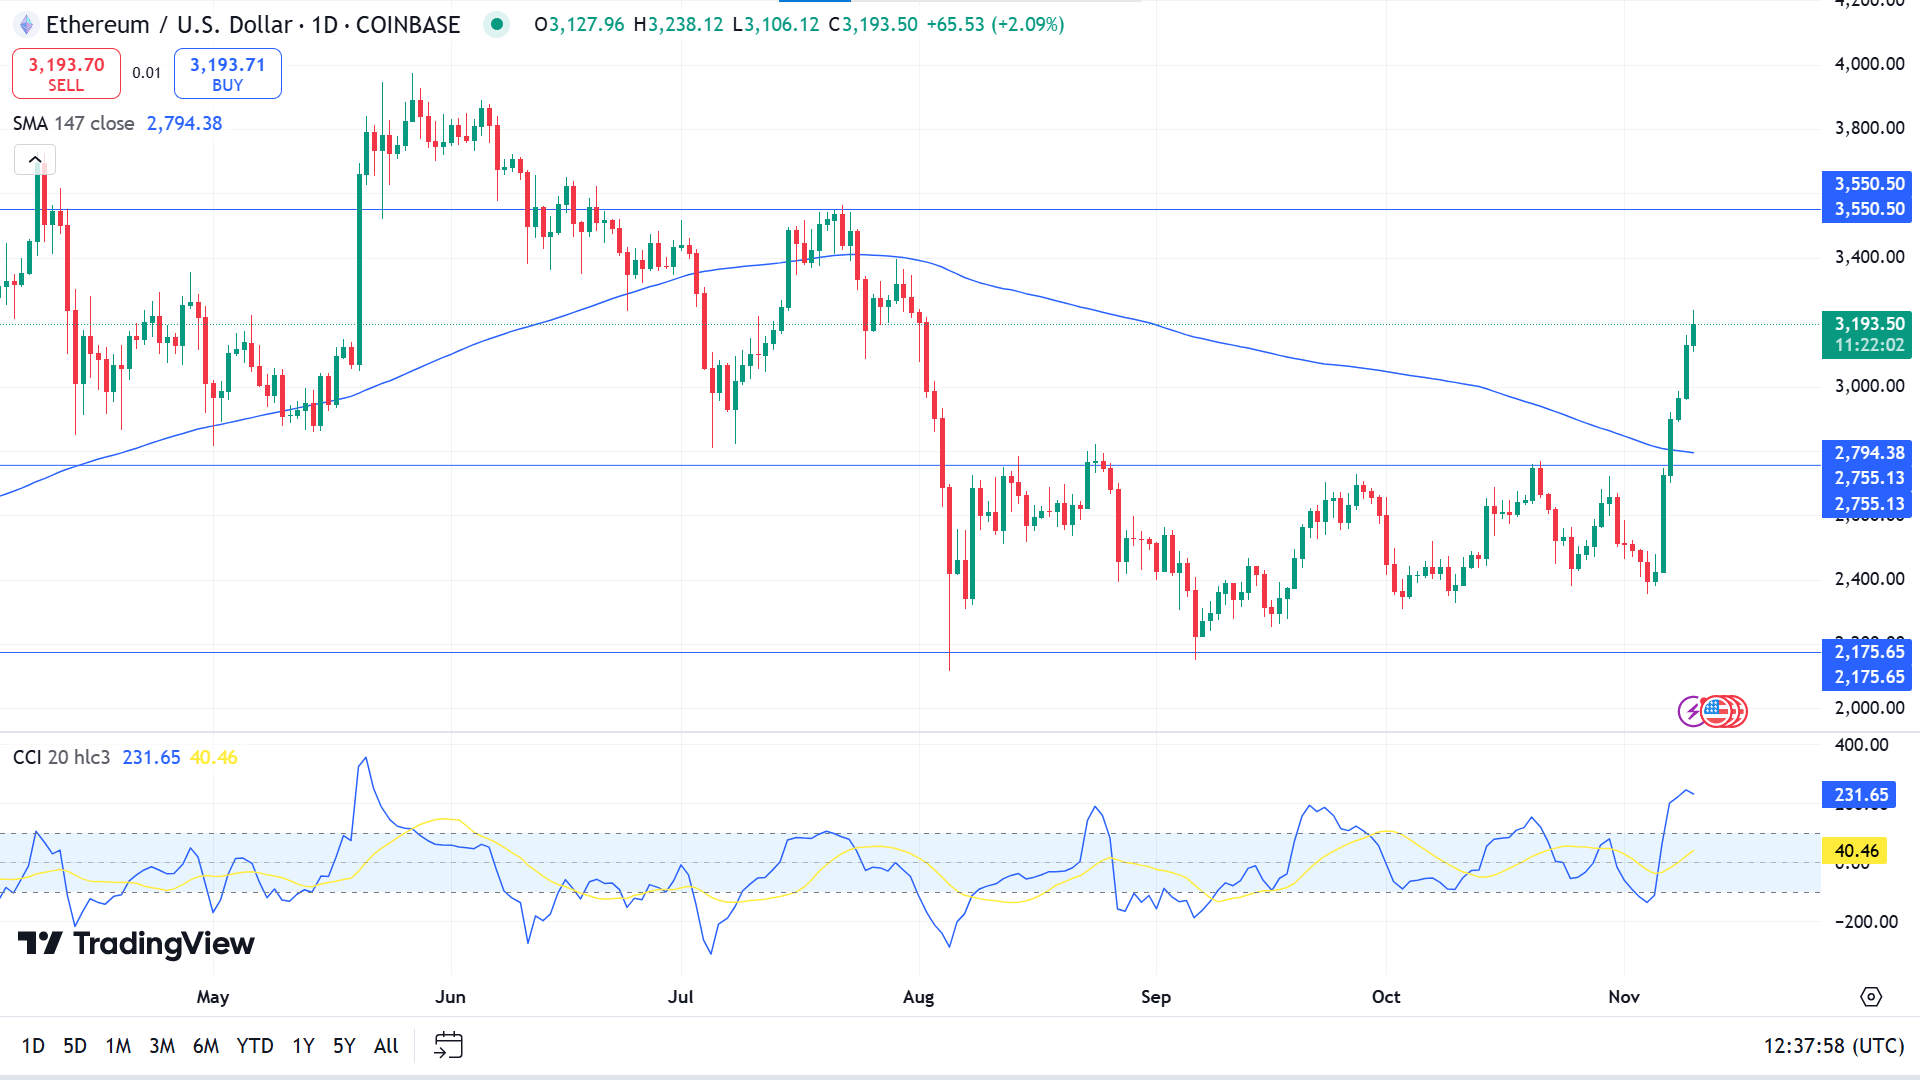
The price reaches above the range top rapidly due to recent solid bullish pressure, making buyers optimistic but the CCI indicator window indicates a bearish initiation as the dynamic signal line edging downside although still remains above the upper line of the indicator window. While the price is above the SMA 147 line due to the recent bullish pressure.
Price action traders may seek to open precious long positions near the range of 2755.13 to 2902.70, which may continue toward the anticipated resistance of 3550.50.
Whereas the bullish setup will be invalid, if the price drops below the 2775.65, in that case bears can lead the price toward the previous range low near 2175.65.
Nvidia Stock (NVDA)
Fundamental Perspective
Nvidia (NVDA -0.84%) entered 2023 with a $360 billion market cap, which has since soared to $3.5 trillion, thanks to its unparalleled success in monetizing artificial intelligence (AI). Nvidia's GPUs dominate the data center market for AI applications, with demand consistently outpacing supply, fueling the company's triple-digit revenue growth for five consecutive quarters.
On November 20, Nvidia will release its fiscal 2025 Q3 results (for the quarter ending October 31), and given recent trends, it may deliver another impressive performance. Nvidia's H100 GPU, launched in 2022, quickly became essential for AI data centers due to its powerful parallel processing capabilities and high memory, ideal for AI training and inference tasks.
As AI is expected to boost global productivity by up to $200 trillion by 2030 (according to ARK Investment), major companies like Microsoft and Amazon are outfitting data centers with Nvidia GPUs, offering developers rentable computing power.
Nvidia's new GB200 GPU, built on its Blackwell architecture, delivers a 30x increase in AI inference speed over the H100. Early GB200 shipments are underway and may contribute significantly to Nvidia's Q3 earnings, with Microsoft already offering the upgraded GPUs to developers.
Technical Perspective
NVDA share price reaches a new ATH and the last candle surpasses the previous week's high due to recent bullish pressure, confirming a triangle breakout on the weekly chart.
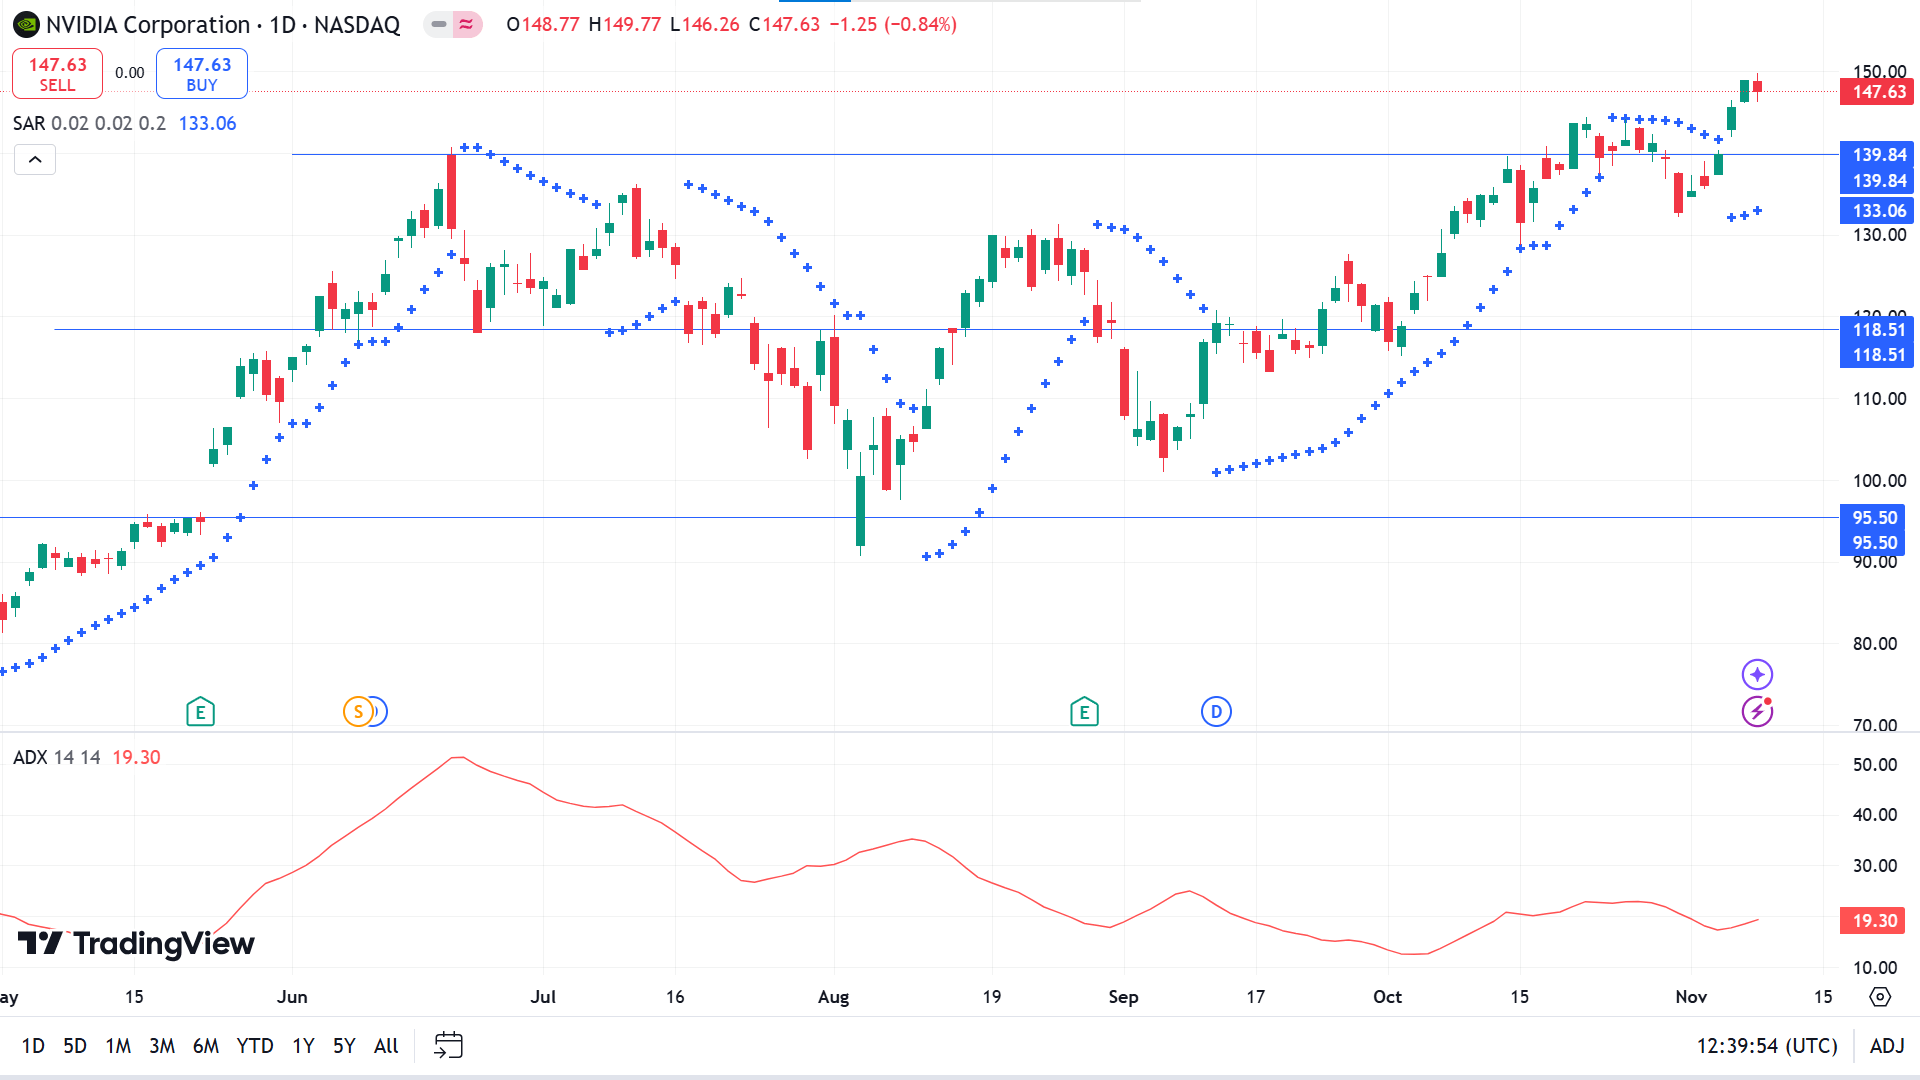
The price resumes in the uptrend after some setbacks in the daily chart as the Parabolic SAR also creates dots below the price candles confirming the recent bullish pressure on the asset price, while the ADX reading indicates bulls may be losing power.
The market context confirms price action traders may wait for the price to retouch near 139.84 as it will enable opening precious long positions which may trigger the price to regain the ATH or beyond near 160.05.
Meanwhile, if the price declines and remains below the 139.84 level, it will deny the bullish setup and may make sellers attractive toward the support near 118.51.
Tesla Stock (TSLA)
Fundamental Perspective
Tesla's (TSLA) stock surged over 9% on Friday, rounding out a strong week as Wall Street speculated that the company could gain from Donald Trump's anticipated policy changes following his re-election. Shares reached approximately $325, marking the first time above $300 since 2022 and pushing Tesla's market cap beyond $1 trillion. For the week, the stock rose by 30%.
Analysts, including those at Bank of America, raised Tesla's price target from $265 to $350, citing potential regulatory benefits under a Trump administration. They expect Trump's support for a national standard on autonomous vehicles to aid Tesla's robotaxi plans, set to debut next year.
Further, analysts suggest Musk's public relationship with Trump could strengthen Tesla's competitive position. Trump's stance on environmental regulations might slow down other automakers' EV efforts, while anticipated tariffs on Chinese imports could reduce competition from low-cost EVs abroad.
Wedbush analysts, led by Dan Ives, maintained their $300 price target, arguing Tesla's market leadership would remain strong if Trump reverses the current EV subsidies, which would impact rivals more than Tesla. Meanwhile, competing EV companies like Rivian (RIVN) faced headwinds, with Rivian cutting its 2024 production estimate due to a parts shortage, now expecting to produce 47,000–49,000 vehicles this year.
Technical Perspective
The weekly chart reveals TSLA price surpasses the 300 benchmark for the first time in 2024 and the long green candle represents aggressive buying, which leaves buyers optimistic for the upcoming weeks.
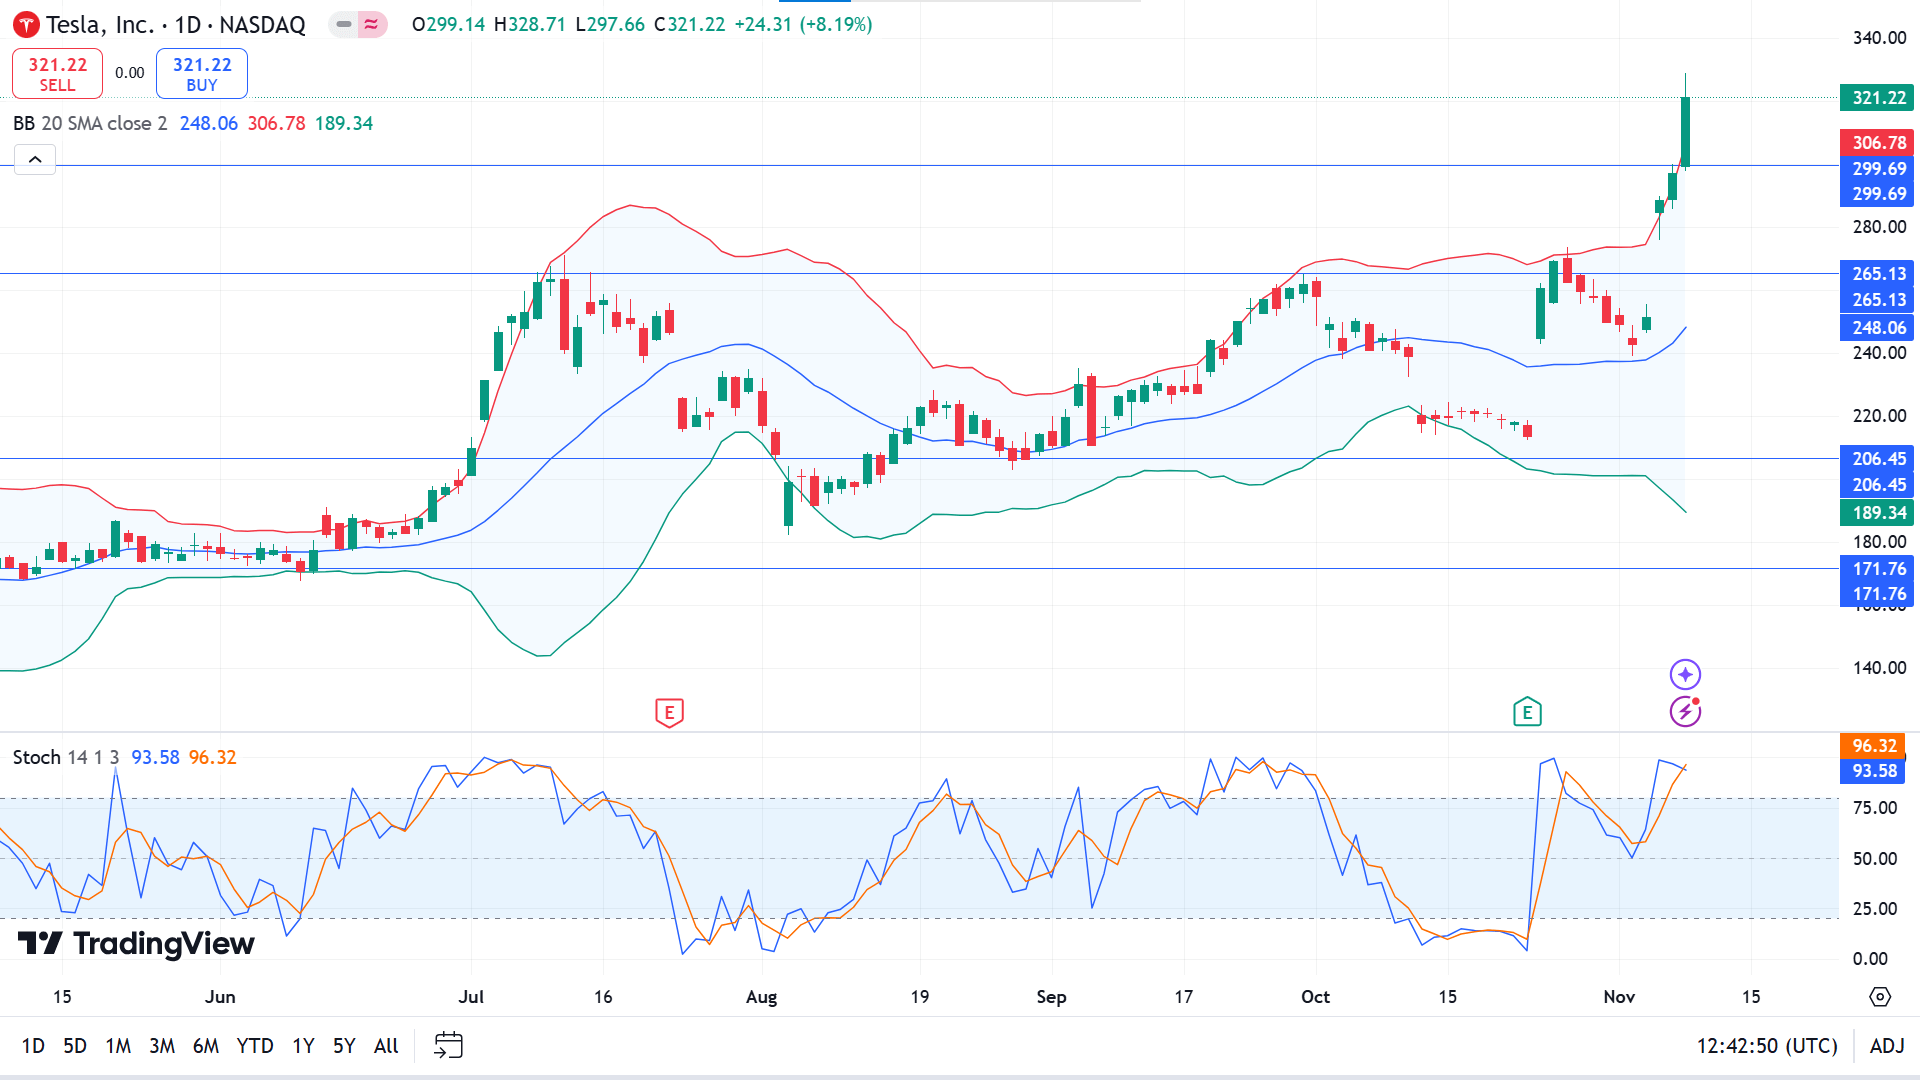
On the daily chart, the price surge suddenly passed two important resistance levels 265.13 and 299.69 due to the US election, which may cool down and re-adjust demand-supply in the upcoming days. The Stochastic indicator window reading remains neutral while the dynamic signal lines float above the upper line of the indicator window, while the price is moving along the upper band of the Bollinger band indicator.
Erasing liquidity from this level could easily drive the price toward the 265.13-299.69 zone, which is also an adequate buy zone, following the price action context. That buy signal is valid till the price reaches toward previous resistance near 380.83.
Meanwhile, if daily candles continue to decline and remain below the 299.69-265.13 level, it will indicate the bullish phase may be over and bears can drive the price toward the 206.45 support level.
WTI Crude Oil (USOUSD)
Fundamental Perspective
Crude oil prices slipped more than 1% in Friday's US trading session but held within the tight range seen over the past four days. Initial optimism following President-elect Donald Trump's victory has begun to wane as energy markets turn their attention to China. Concerns are growing that potential US tariffs could slow China's already weak demand for oil, possibly further reducing the global demand forecast for 2025.
The US Dollar Index (DXY), which tracks the dollar against six major currencies, found support as Federal Reserve Chair Jerome Powell reassured markets of his stability in leadership after the Fed's 25-basis-point rate cut. Powell's comments soothed uncertainty regarding his role, which had come under question following Trump's election.
Broadly, the market rally is slowing as the so-called “Trump trades” lose steam, and renewed concerns over China's demand take precedence, Bloomberg notes. Oil supply pressures linger, with OPEC's October production up by 370,000 barrels per day, largely due to Libya's output recovery to over 1 million barrels daily after resolving a central bank leadership dispute.
Additionally, Tropical Storm Rafael is expected to approach the Texas and Louisiana coasts by Saturday, though it likely won't make landfall. Baker Hughes' weekly US oil rig count update is anticipated near 18:00 GMT, with the last count at 479.
Technical Perspective
The last gravestone doji after a doji candle with a green body, reaching above the previous candle range confirms bullish pressure on the asset but is not sufficient to create a new high on the weekly chart.
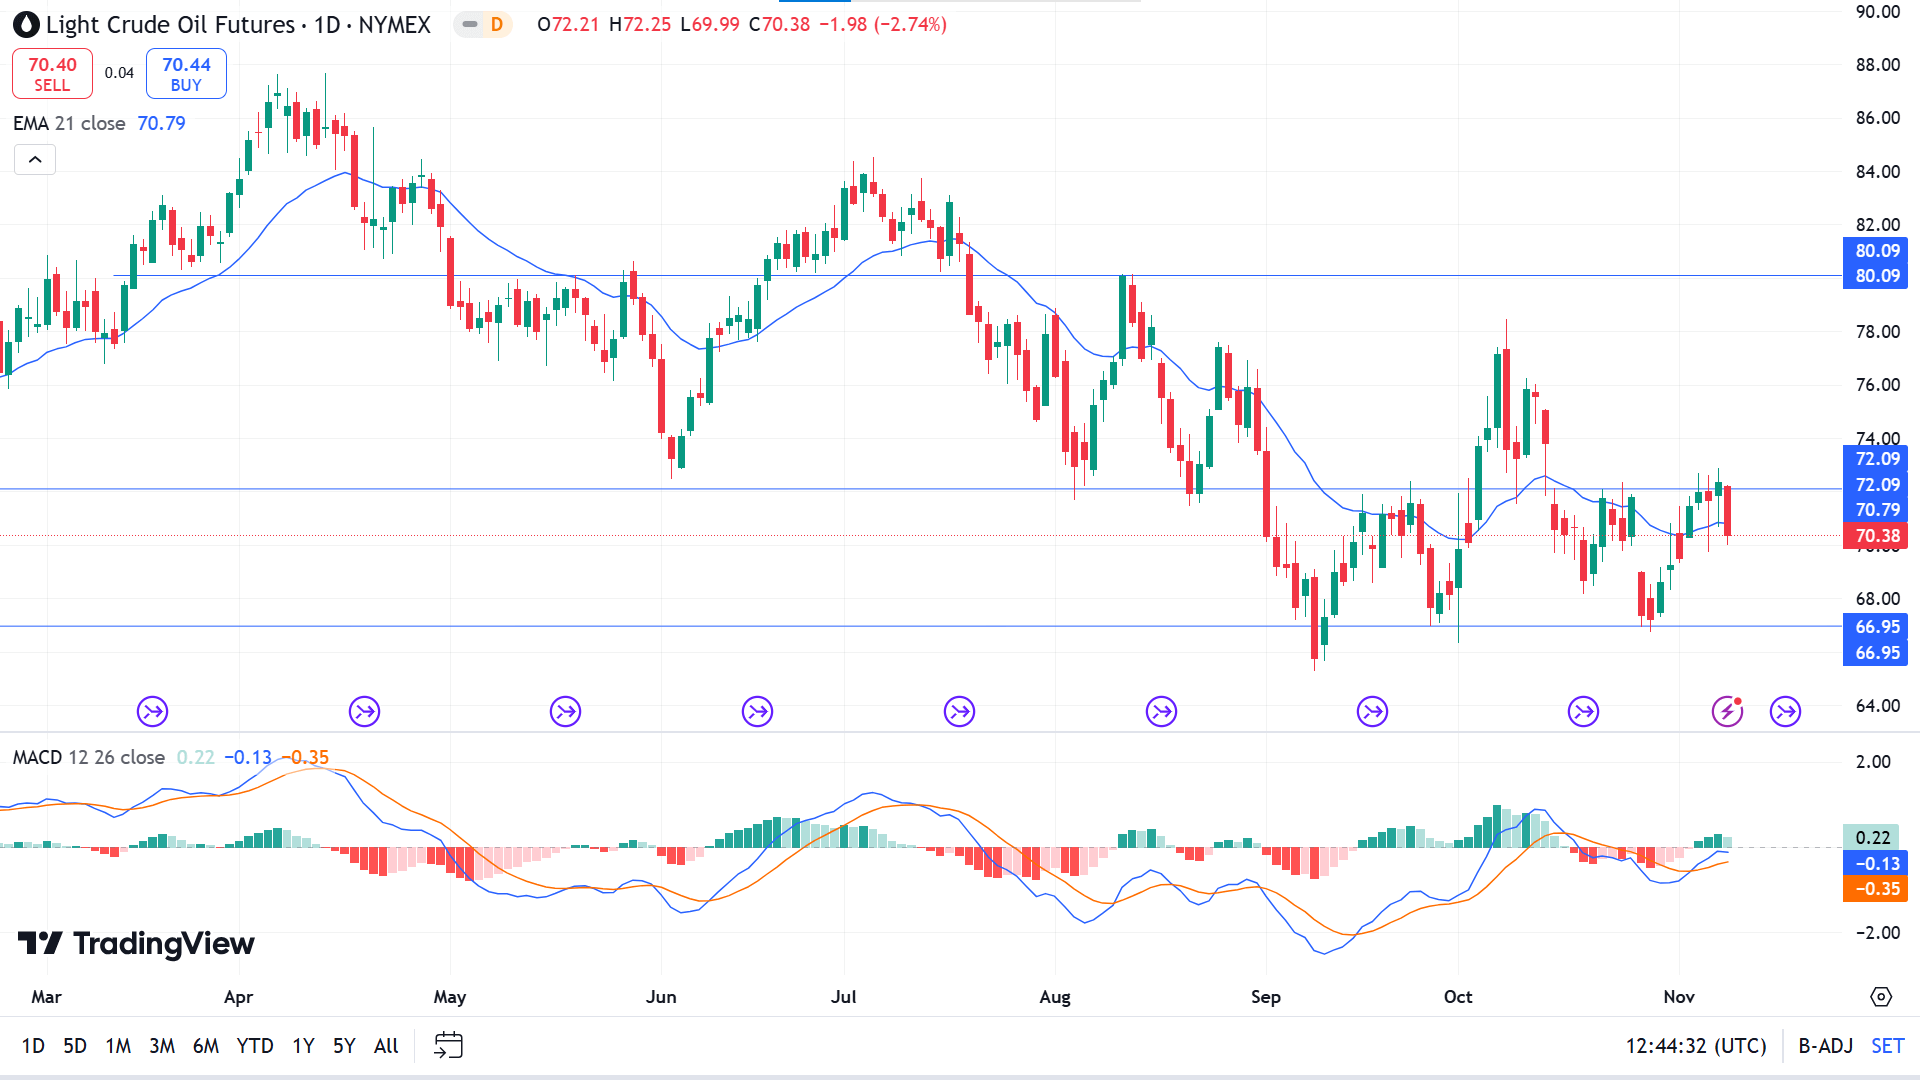
On the daily chart, the price could not break above the resistance of 72.09 successfully, which level also acts as a barrier for sellers. The price also reaches below the EMA 21 line due to the recent bearish pressure, while the MACD indicator reading still remains bullish, but the green histogram bars are fading, reflecting bulls may lose power. The recent bearish pressure can lead the price toward the support near 66.95.
Meanwhile, the sell setup will lose validity if the price reaches above 72.09 level, floating above the EMA 21 line, which will enable buying opportunities for investors toward the resistance near 80.09.


