
EURUSD
Fundamental perspective
The EURUSD pair hovered above 1.0700 throughout the week, displaying choppy trading dynamics until Thursday, when the US Dollar yielded ground, extending its decline into the weekly close. The market's attention centered on the US labor market, particularly the spike in Initial Jobless Claims to 231K, the highest since November 2023. This enthusiastic speculation that the Federal Reserve might quicken rate cuts. Subsequently, stocks surged while the Greenback weakened.
The preliminary May Consumer Sentiment Index data was released on Friday, adding weight to the Dollar's disappointment. The index dropped to 67.4 from April's 77.2, failing to match the market expectations of 76. Notably, 1-year and 5-year inflation expectations increased, underscoring concerns.
Meanwhile, the Euro failed to capitalize despite upward revisions in the Eurozone's Purchasing Managers Indexes and robust March retail Sales. The decline in the Producer Price Index offered some respite amid inflation worries. Overall, the week showcased a mixed economic landscape, with US concerns outweighing Eurozone optimism, leading to the Dollar's depreciation against the Euro.
EURUSD Forecast Technical Perspective
The weekly chart shows the last candle closed green, posting four consecutive weeks of growth, leaving buyers optimistic. So, the next candle can be another green one.
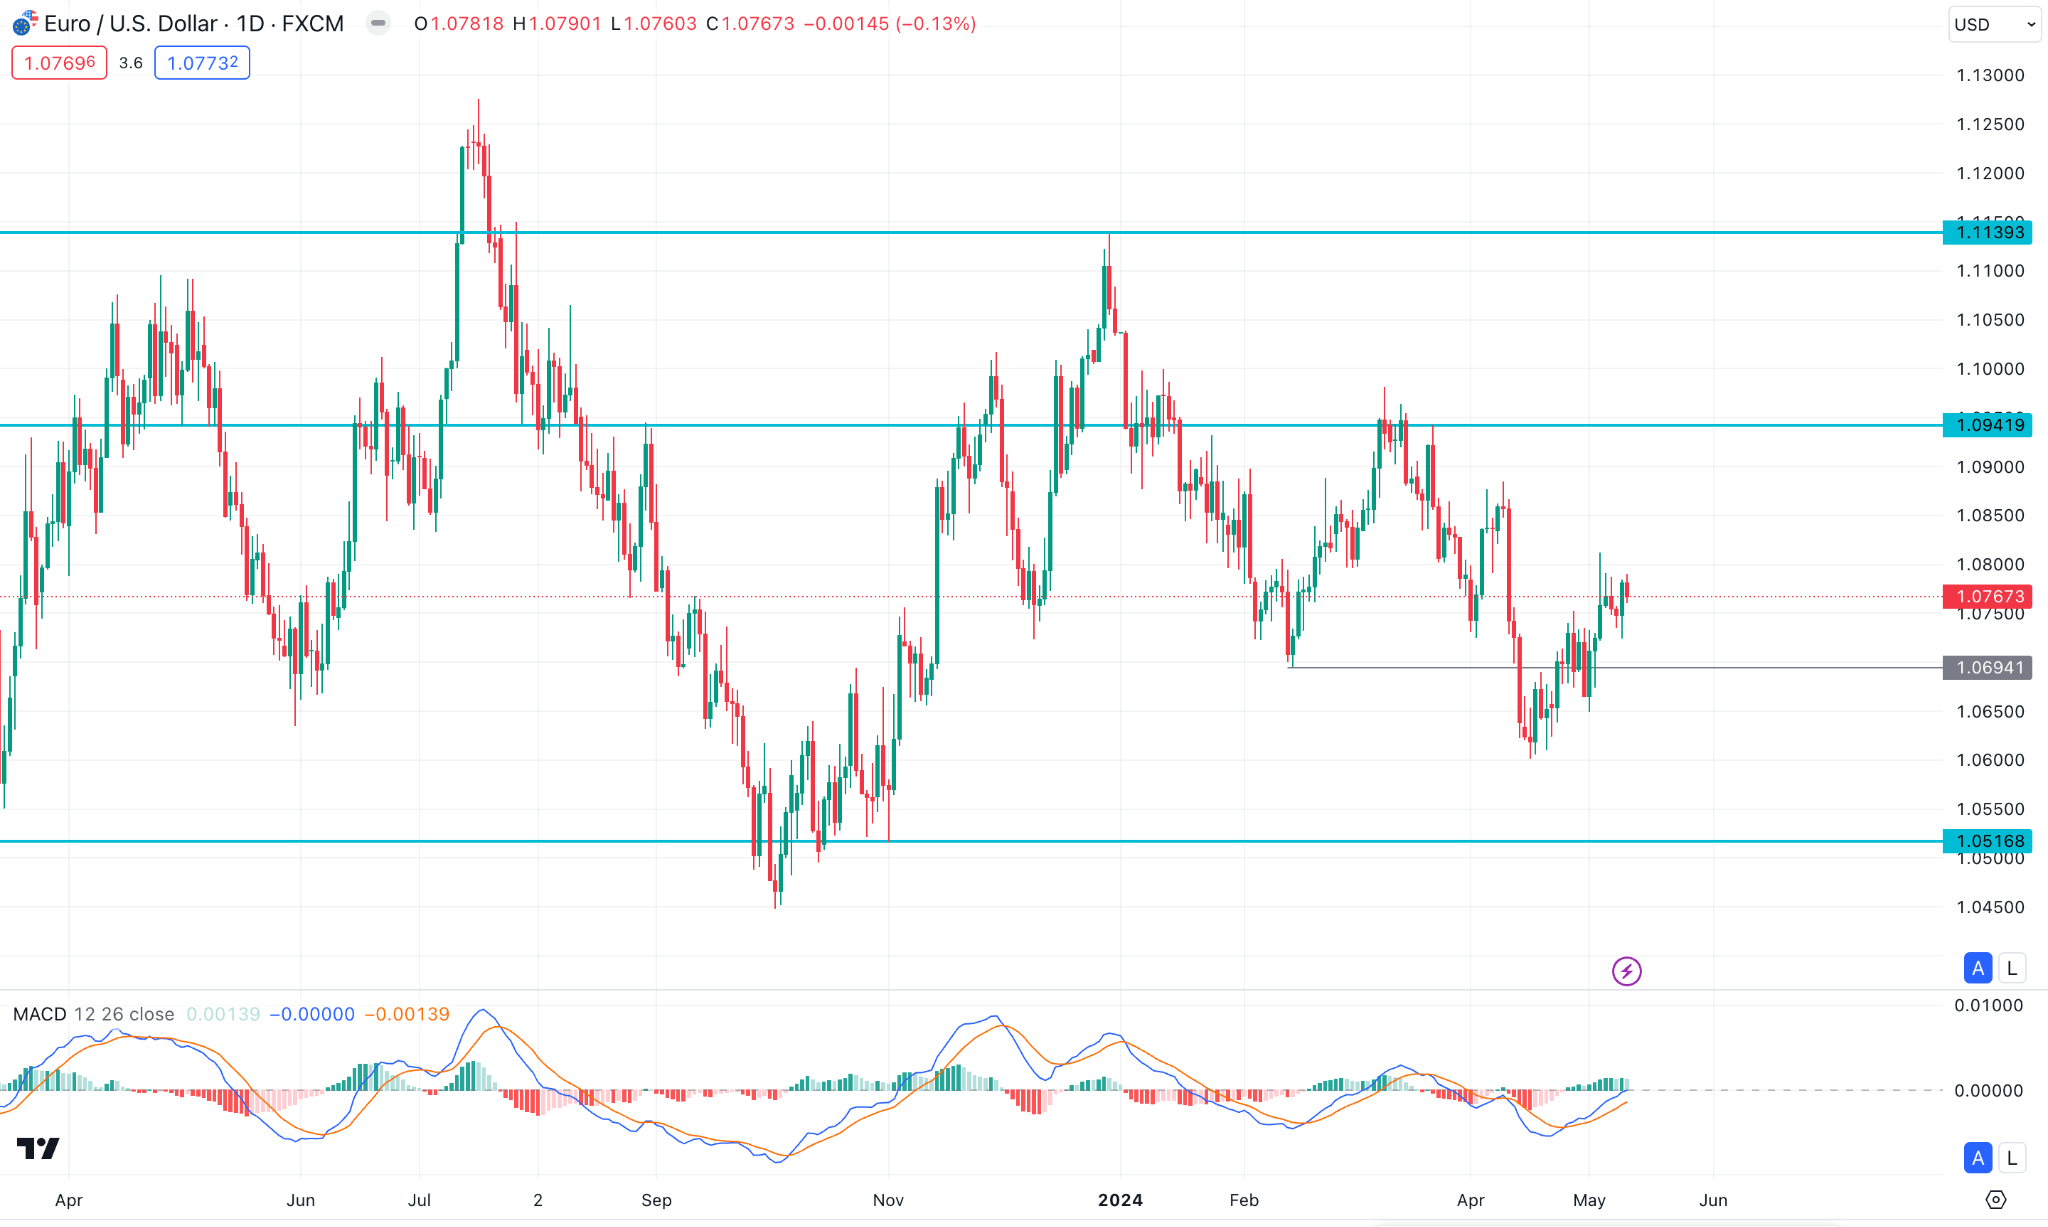
However, on the daily chart, the price floats below the EMA 100 line, indicating fresh selling pressures. However, the MACD window indicates a bullish scenario through upward signal lines alongside green histogram bars. Therefore, If the price exceeds 1.0800, surpassing the EMA 100 line, it can reach the primary resistance of 1.0880, followed by the next resistance of 1.0980.
Meanwhile, as the current price trades below the EMA 100 line, it can continue to drop at the next support level of 1.0631, following the next support near 1.0500.
GBPJPY
Fundamental Perspective
The Bank of Japan's recently disclosed Summary of Opinions from its April 26th meeting underscores a period of relative stasis in policy decisions. While the meeting yielded no shifts in policy settings, subsequent market movements, particularly the yen's slide below the crucial 160 mark, hinted at potential intervention by Japan’s Ministry of Finance. Criticism directed at Governor Ueda for his perceived ambiguity regarding future rate hikes fueled the debate surrounding the yen's depreciation.
Governor Ueda's effort to address concerns materialized on Wednesday, expressing readiness to tighten policy should inflation surpass expectations. The Summary of Opinions unveiled several calls from several members urging the central bank to persist with rate hikes to mitigate the risk of inflation overshooting projections.
Whether this hawkish sentiment will galvanize Ueda into action remains uncertain, contingent upon inflationary dynamics. The fragile state of the Japanese economy warrants caution, as a substantial rate hike could precipitate recessionary risks.
The pound wobbles like the Dollar! Both currencies faced choppy trading after the Fed's cautious stance at their May meeting, and ongoing comments keep investors guessing about the dollar's future. Meanwhile, the Bank of England kept rates steady but hinted at potential cuts based on future data. Governor Bailey even leans towards lowering rates if inflation keeps improving.
GBPJPY Forecast Technical Perspective
The last weekly candle closed as a green candle recovered from the previous week's loss, indicating bulls are in play. So, the next candle can be another green one.
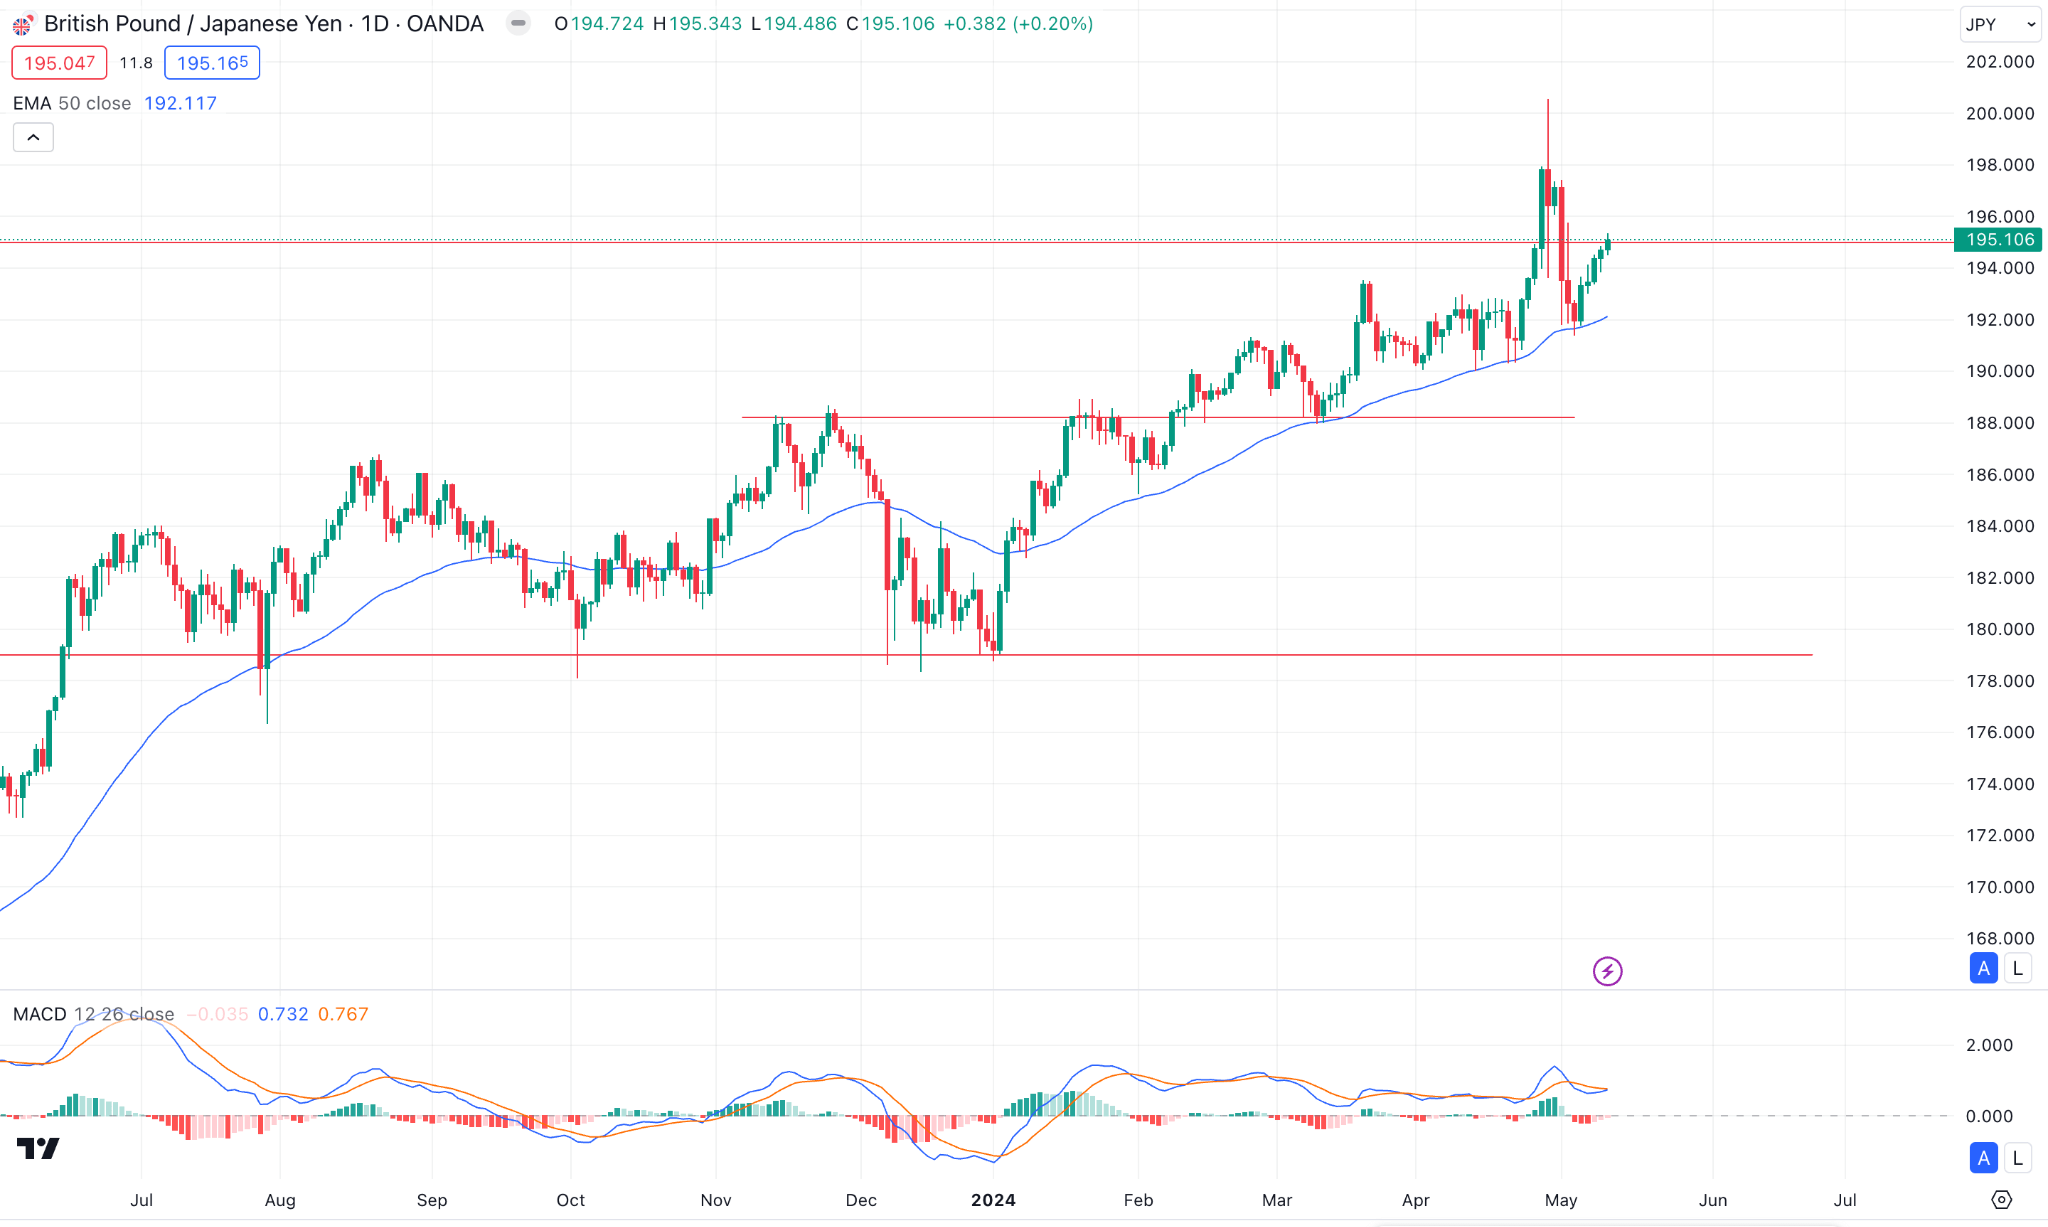
On the daily chart, the price just reached the EMA 50 level and reversed, creating the EMA 50 line as an initial support level. Meanwhile, the MACD indicator reading remains negative, suggesting a downside pressure. Considering the ongoing bullish trend, the price can reach the next resistance of 197.11, following the next resistance near 200.56, as long it remains above the EMA 50 and EMA 21 lines.
Meanwhile, a downside correction is possible towards the 21-day EMA line, where a break below this level could see the recent support of 192.11, following the next support near 190.31.
Nasdaq 100 (NAS100)
Fundamental Perspective
Wall Street indices are steadily approaching record highs after a recent downturn, propelled by economic indicators signaling a moderation in the US labor market. There are heightened expectations that the Federal Reserve will implement multiple interest rate cuts throughout the year.
A notably robust earnings season has also contributed to the positive sentiment, particularly bolstering the tech-heavy Nasdaq Composite, poised for its third consecutive week of gains. Similarly, the blue-chip Dow, currently experiencing its longest winning streak since December, is set for a fourth consecutive week of gains.
Hugh Anderson, managing director at HighTower Advisors, characterizes the situation as a classic example of "bad news is good news," where softening employment data aligns with the Fed's desired conditions for implementing interest rate cuts. While acknowledging the implications for job seekers, Anderson highlights the optimism it fosters in the market.
Despite the consensus among most Fed policymakers that a rate cut is the next likely policy move, uncertainty persists regarding the timing of these rate cuts, as indicated by San Francisco Fed President Mary Daly's recent remarks on the considerable uncertainty surrounding future inflation trends in the US. Investors eagerly await speeches from various Fed officials throughout the day for further insights into the trajectory of interest rates.
Technical Perspective
The last weekly candle closed solid green after a bullish hammer, posting three consecutive positive weeks, indicating the price is in buyers' domination. So, the next candle can be another green one.
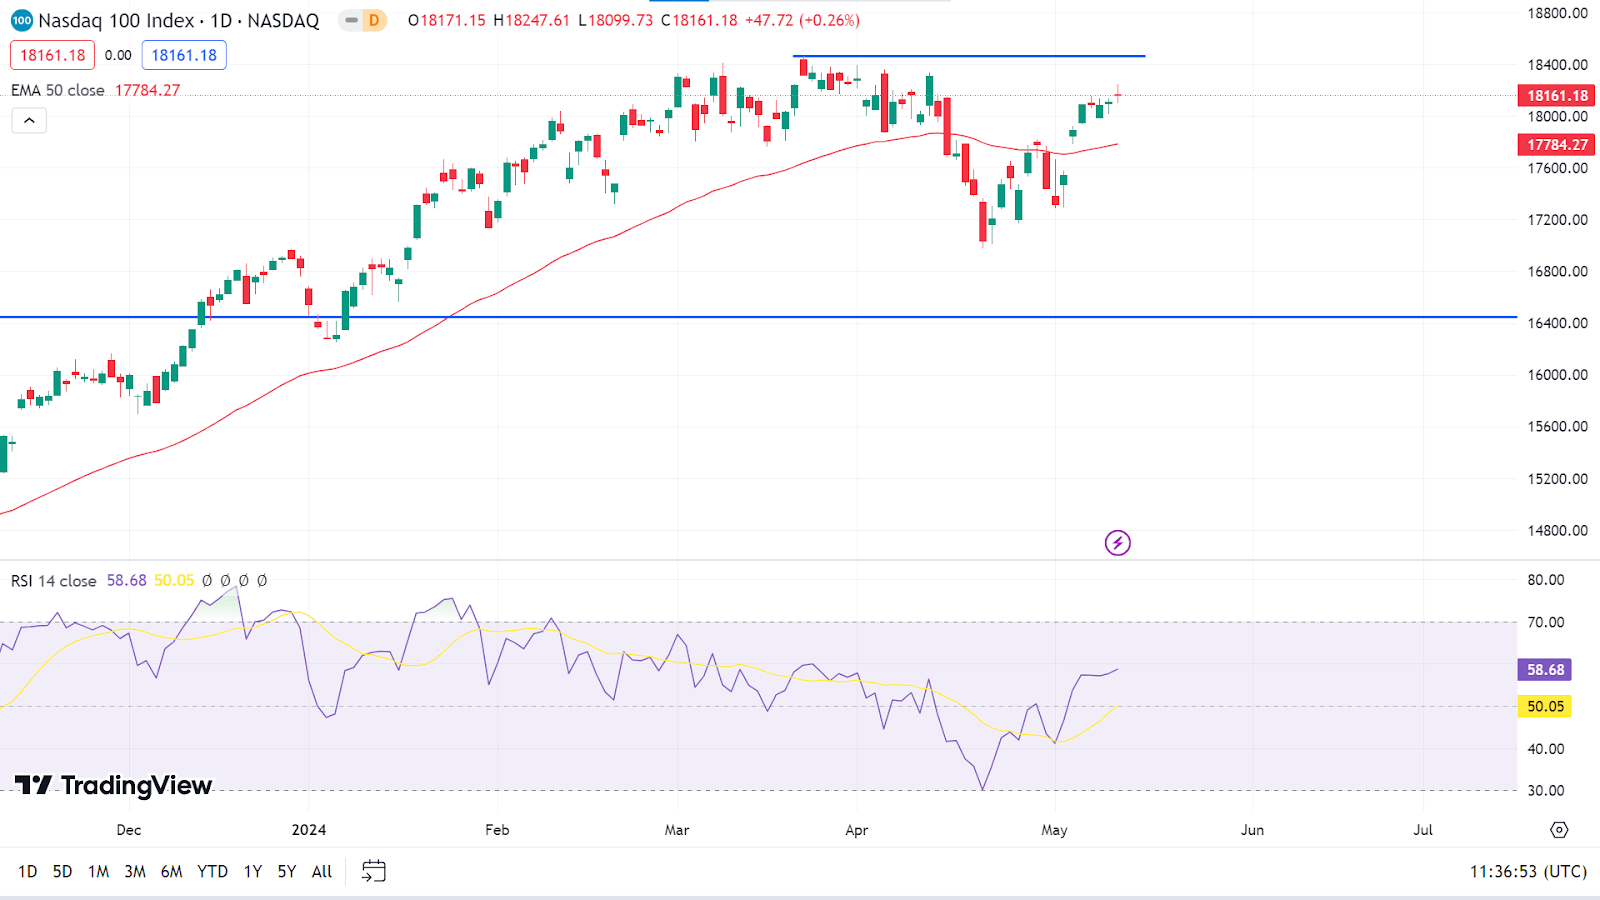
The daily chart's price remains above the EMA 50 and EMA 100 lines, indicating a positive force on the asset price. However, it rebounded above the 50.0 level, suggesting ongoing buying pressure. This indicates that the price can reach the primary resistance of 18,464.70. Any breakout can trigger the price toward the 19,000.00 psychological line.
On the other hand, downside pressure, with a break below the 50-day EMA line, could reach the recent support near 17,284.37, following the next support near 16,973.94. Simultaneously, the RSI reading will continue to get into the negative territory.
S&P 500 (SPX500)
Fundamental Perspective
The Standard & Poor's 500 index increased by 1.9%, marking its third consecutive week of gains throughout the week. This positive movement was fueled by robust earnings reports that surpassed expectations, alongside gaining investor optimism regarding potential rate cuts.
Closing the week at 5,222.68, the index has now recorded a 3.7% increase for the month and a robust 9.5% increase for the year.
While quarterly earnings have generally exceeded forecasts, revenue outcomes could have been more consistent. Among the 64 S&P 500 components reported this week, 79% exceeded earnings forecasts, while only 44% outperformed revenue expectations. According to Bloomberg data, the number of components with revenue below expectations remained relatively low at 40%, with 16% aligning with Street views.
Investor sentiment regarding prospective rate cuts by the Federal Reserve gained momentum after last week's weaker-than-expected monthly jobs data report. During prepared remarks on Friday, FED Governor Michelle Bowman underscored the importance of cautious policy decisions, citing their potential impact on financial stability.
Gaps were witnessed across all sectors of the S&P 500, with utilities leading the charge with a 4% increase, followed by a 3.1% rise in financials and a 2.6% uptick in materials. Notable performers included Vistra and Constellation Energy in utilities, Fidelity National Information Services in financials, and International Flavors & Fragrances in materials. As investors look ahead, anticipation mounts for key updates on inflation, with reports on the April producer price index and consumer price index slated for the upcoming week, alongside other significant economic indicators.
Technical Perspective
The last weekly candle was solid green, posting three consecutive gaining weeks, indicating bullish pressure on the asset price. So, the next candle can be another green one.
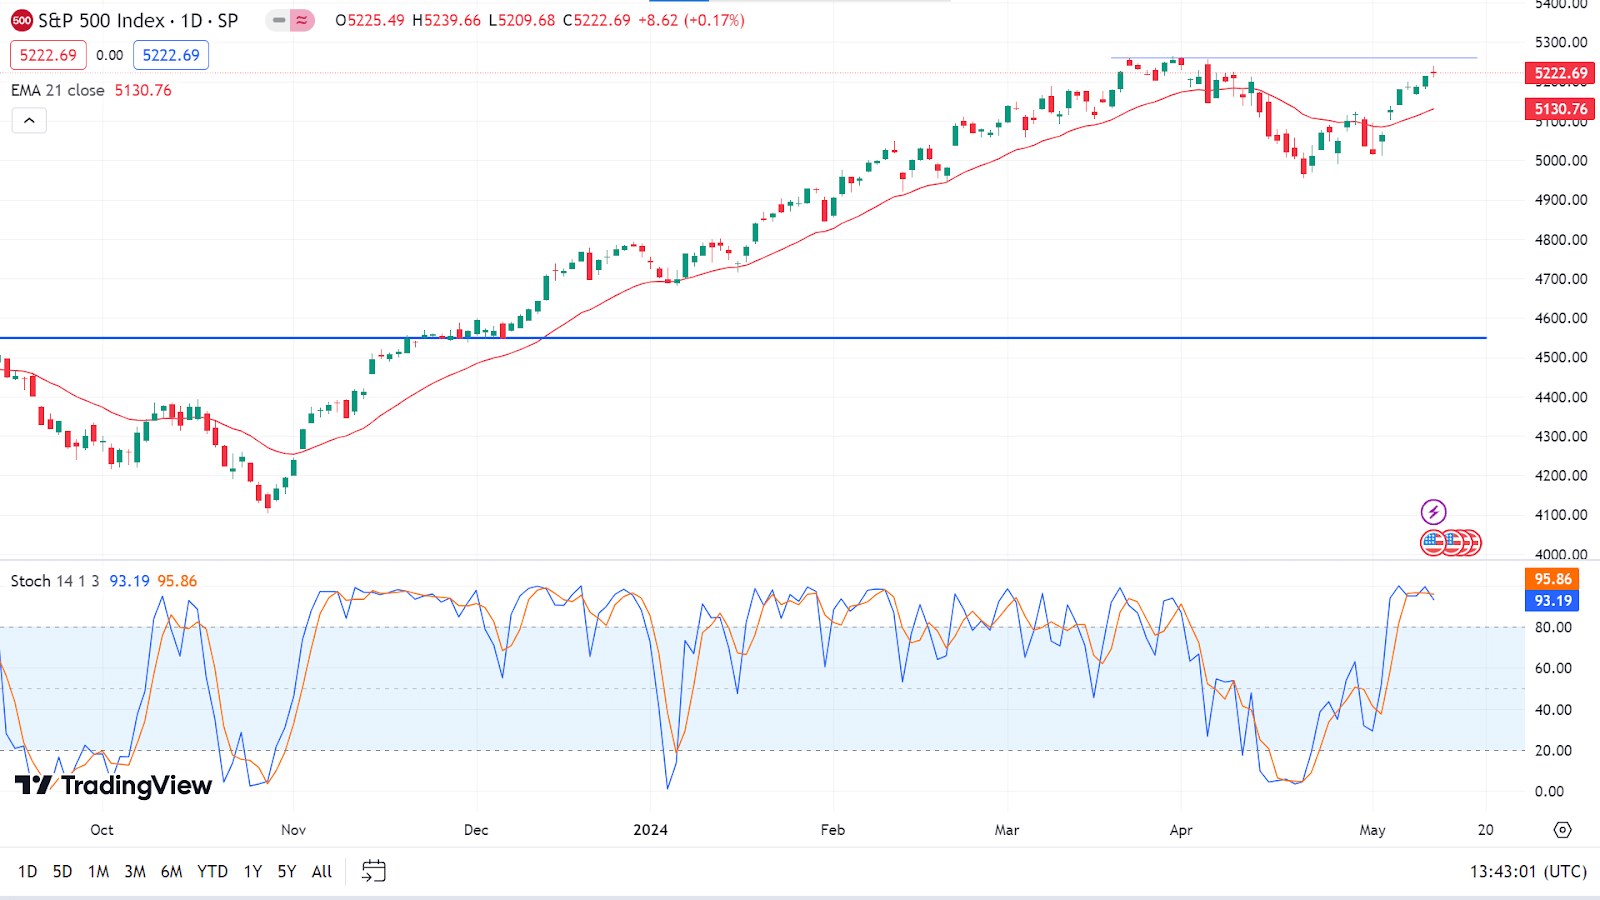
The price stays above the EMA 21 line when checking the daily chart, while the Stochastic indicator reading remains overbought. Following the current bullish trend, the price can regain its peak of 5264.85 or reach above it.
Meanwhile, if the price drops below the EMA 21 line, it can continue to decline to recent support near 5013.45, followed by the next support near 4953.56. The Stochastic indicator reading will follow correspondingly.
Bitcoin (BTCUSD)
Fundamental Perspective
Bitcoin has recently undergone its most significant correction since the November 2022 FTX crash, dropping over 20% from its peak of about $74,000. Despite this, Glassnode analysts maintain cautious optimism, noting that the cryptocurrency's "macro uptrend still appears to be one of the more resilient in history." They observe that corrections, while occurring, have been relatively shallow, attributing this to improved liquidity and reduced volatility within the Bitcoin market.
After the March 2023 highs, Bitcoin has struggled to sustain its upward trajectory, finding support around $60,000, with a critical level at $56,500 to monitor for downside reactions. However, a breakthrough above $66,000 could signal a potential rally, exceeding $72,000 and reaching $74,000 again.
While price dynamics offer some support, Glassnode underscores the significance of fundamental factors as key market catalysts. The sustained resilience of Bitcoin's macro trend, diminished volatility, and increased institutional engagement reflects a maturing market landscape. Notably, substantial accumulation by a single whale suggests potential undervaluation despite recent multi-year highs. Moreover, recent developments, such as Donald Trump's acceptance of crypto donations and potential regulatory approval in Europe, bode well for Bitcoin's future growth and institutional investment.
Bitcoin Price Prediction Technical Perspective
The last weekly candle closed solid red after a hammer, indicating a possible sell continuation. So, the next candle can be another red one.
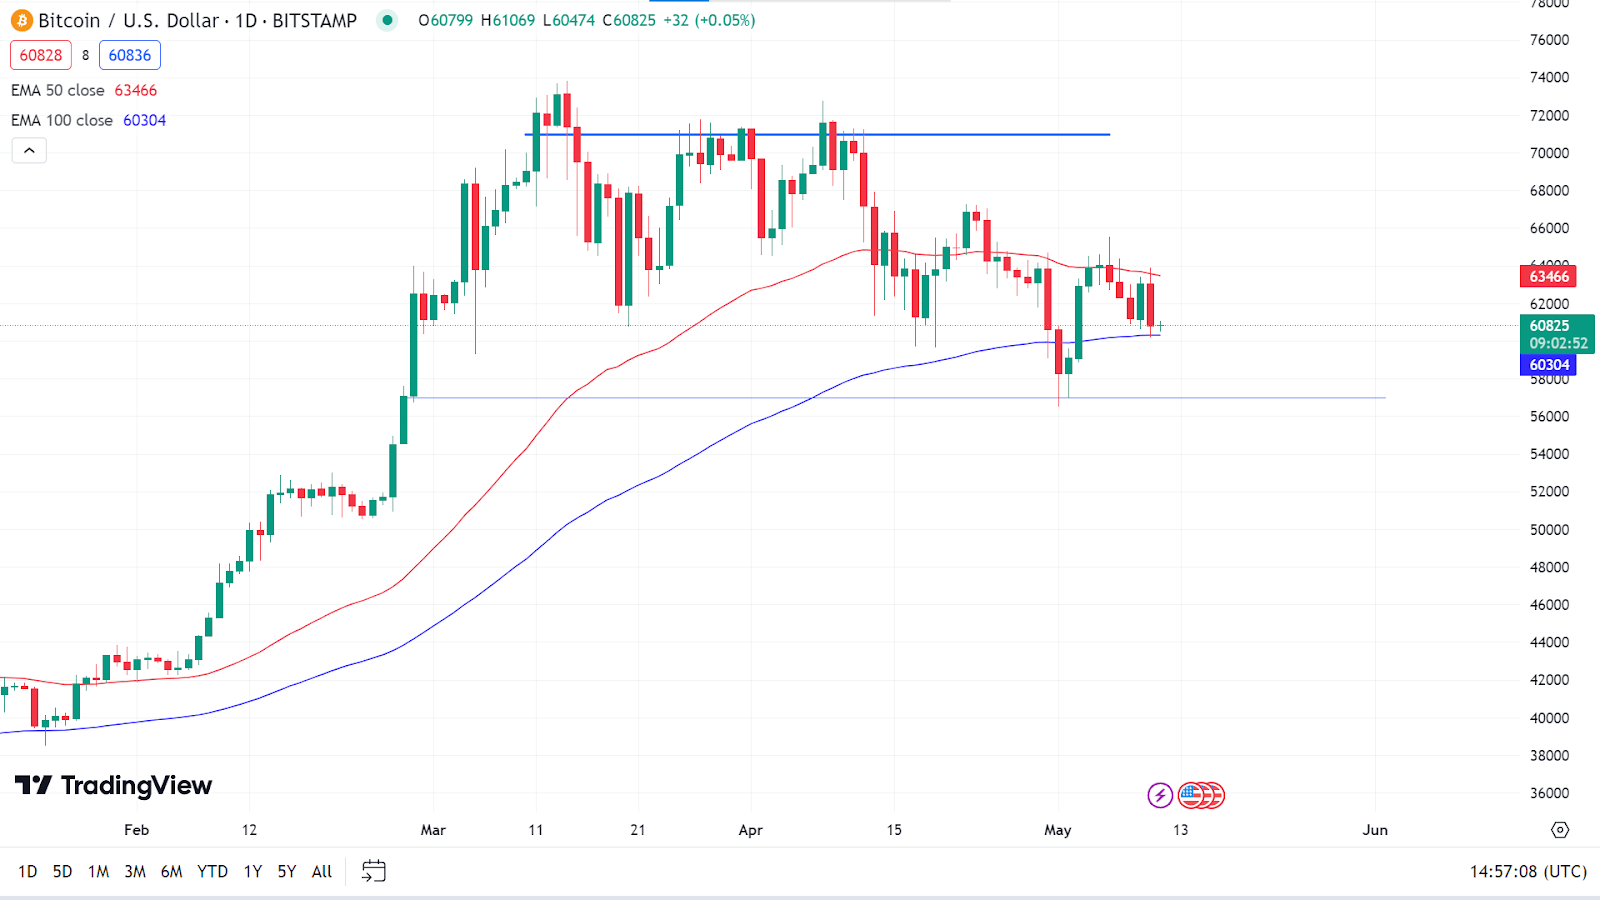
The daily chart shows the price remains below the EMA 50 line, declaring a minor bearish pressure on the asset price. Buyers are still optimistic as the price remains above the EMA 100 line, with a potential inverse Head and Shoulders breakout possibility. A successful breakout above the 66000.00 level could be a potential long signal, creating a bull run towards the 70000.00 level
On the other hand, a failure to hold the price above the 100 day SMA line could create a potential short opportunity, aiming for the 52000.00 level.
Ethereum (ETHUSD)
Fundamental Perspective
The proposed spot ether exchange-traded fund (ETF) collaboration between Cathie Wood's ARK Invest and 21 Shares will no longer incorporate staking, as revealed in an updated filing on Friday. Initially, the filing had included a staking component, outlining the potential for the sponsor to stake a portion of the Trust’s assets through trusted Staking Providers. However, this specific language was omitted from the revised filing.
Bloomberg ETF analyst Eric Balchunas provided insights into the implications of this modification, suggesting various potential reasons for the change. While it could be construed as a proactive response to feedback from the Securities and Exchange Commission (SEC), Balchunas noted the absence of any official comments from the regulatory body. He proposed that the alteration might serve as a strategic maneuver to streamline the application process or preemptively address concerns to mitigate the risk of rejection.
Both ARK Invest and 21 Shares have refrained from commenting on this development.
The proposed spot ether ETF, initiated in September, aims to provide direct exposure to ether and trade on the Cboe BZX Exchange utilizing the CME CF Ether-Dollar Reference Rate – New York Variant. With 21 Shares as the trust's sponsor, Delaware Trust Company as the trustee, and Coinbase Custody Trust Company as the ether custodian, ARK Investment Management serves as the sub-adviser, assisting in marketing the Shares.
However, optimism regarding the SEC's approval of spot ether ETFs has diminished in recent months. Bloomberg's Balchunas revised his estimate for the likelihood of approval by late May from around 70% to 25%.
Ethereum Price Prediction Technical Perspective
The last weekly candle closed in solid red, declaring bearish pressure on the asset price. So, the next candle can be another red one.
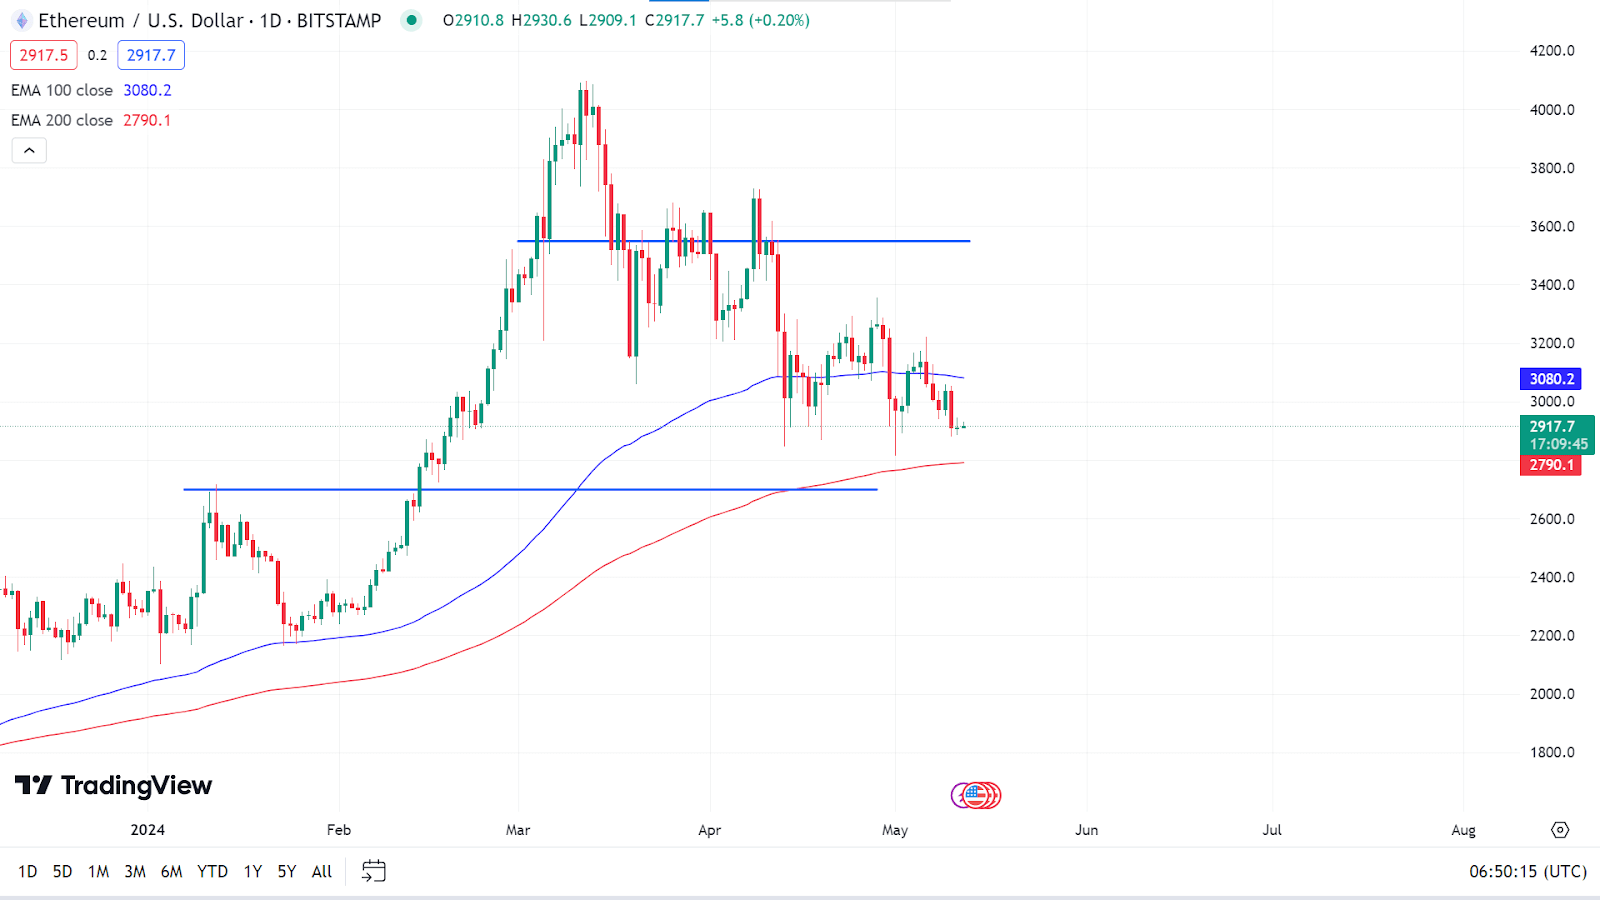
The price remains below the EMA 100 line on the daily chart, declaring a bearish pressure. However, the 200-day SMA line is still untouched, leaving room for buyer optimism. A potential bullish breakout above the 100 SMA line can be seen in the resistance of $3355.00, followed by the next resistance of $3550.00.
However, if the price declines below the EMA 200 line, it can trigger the price to reach the primary support of $2700, whereas the next support is near $2431.80.
Gold (XAUUSD)
Fundamental Perspective
Gold prices seem to have reacted strongly to recent economic data and Federal Reserve statements. Despite high US Treasury bond yields, gold still surged by over 1%, indicating a flight to safety among investors. The decline in consumer sentiment, coupled with softer labor market figures and escalating inflation expectations, has painted a gloomy picture for the US economy.
Federal Reserve officials have expressed differing views on monetary policy, with some, like Atlanta's Fed President Raphael Bostic, remaining hawkish and others, like Fed Governor Michelle Bowman, advocating for a steady policy stance without rate cuts. The uncertainty surrounding future monetary policy, as indicated by Minneapolis Fed Neel Kashkari's "wait and see" approach, adds to market volatility.
Next week's economic calendar will include crucial releases such as inflation figures, retail sales data, building permits, and more Fed speeches. These data points will likely influence market sentiment and further shape expectations regarding future monetary policy actions, including the possibility of Fed rate cuts.
The University of Michigan Consumer Sentiment Index's significant decline, rising inflation expectations, and softer labor market figures have heightened speculation about potential Fed rate cuts, with probabilities increasing toward the end of 2024, indicating investors' cautious approach amid economic uncertainties.
Gold Price Prediction Technical Perspective
The weekly candle finished solid green, declaring bullish pressure on the asset price after two consecutive losing weeks. So, the next candle can be another green one.
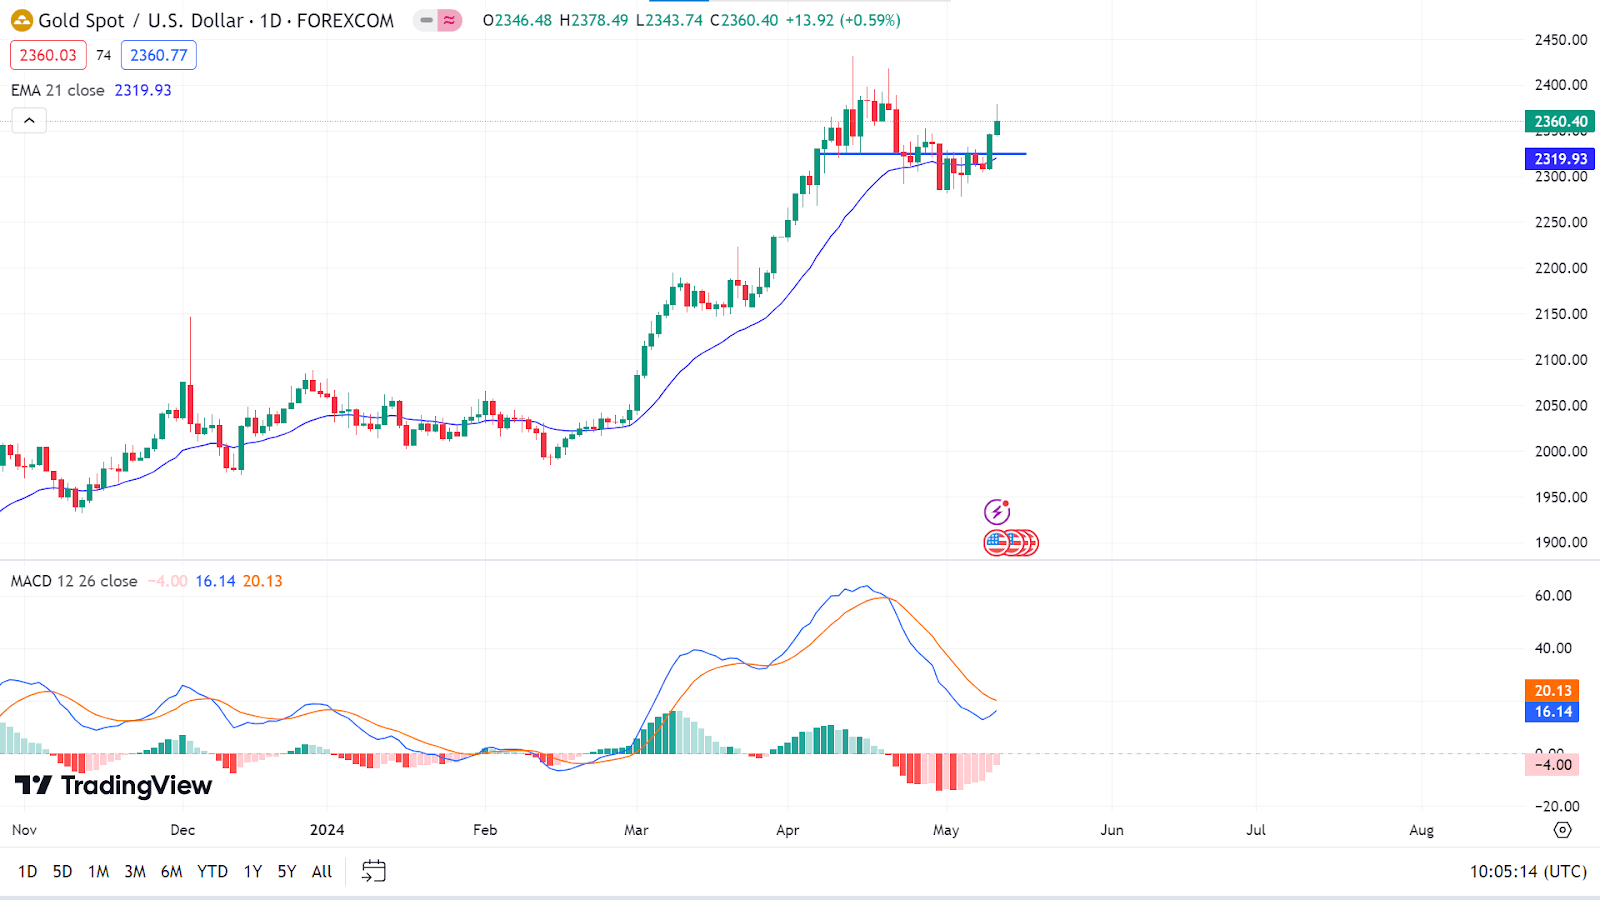
The daily price hovers above the EMA 21 line on the daily chart, declaring a bullish force on the asset price, whereas MACD readings remain in negative territory. Primarily, as the current price hovers above the EMA 21 line, it can regain the peak of $2431.55 or above.
On the other hand, if the price reaches below the EMA 21 line, it can drop to the current support of $2277.43, followed by the next support near $2134.27.
Tesla Stock (TSLA)
Fundamental Perspective
After soaring by an impressive 22% over the previous two weeks, Tesla (TSLA) stock faces a potential weekly decline, marking a shift in its recent bullish trend. However, this downturn coincides with unsettling occurrences within the company. Notably, another executive departure was announced on Wednesday, as Rich Otto, Tesla's head of product launches, disclosed his resignation via LinkedIn. This move aligns with a broader trend as CEO Elon Musk initiates a series of layoffs.
The exits of key figures like Rebecca Tinucci, responsible for Tesla's supercharger endeavors, and Daniel Ho, heading the new vehicles program, underscore Musk's apparent restructuring endeavors. Reports suggest that all teams under Tinucci and Ho have been disbanded, with the discontinuation of public policy roles and the dissolution of the Tesla supercharger division.
These actions come amidst Musk's earlier decision in April to reduce Tesla's global workforce by more than 10%, purportedly in preparation for the company's envisioned "next phase of growth." However, this restructuring has also coincided with the departure of notable figures like Drew Baglino, senior vice president of powertrain and energy, and Rohan Patel, vice president of public policy and business development. These developments collectively highlight a significant crush within Tesla's leadership ranks against the backdrop of ongoing investigations into the company's representations regarding Full Self-Driving capabilities, adding further uncertainty to its future trajectory.
Tesla Stock Forecast Technical Perspective
The last weekly chart posted two consecutive losing weeks, indicating seller domination on the asset price. So, the next candle can be another red one.

When checking the daily chart, the price floating below the EMA 50 line shows a bearish signal on the asset price, whereas the MACD indicator readings are still positive. If the price exceeds the EMA 50 line, it can reach primary resistance near $198.87, followed by the next resistance near $233.62.
However, if the price continues to float below the EMA 50 and the MACD histogram bars turn red and shift below the baseline, it can reach the recent support of $138.80, whereas the next support is near $101.81.
Nvidia Stock (NVDA)
Fundamental Perspective
Amidst the ongoing first-quarter earnings season, Nvidia stands out as a dominant force, drawing commendation from major tech titans even before disclosing its financial performance. Key players like Microsoft, Alphabet, Amazon, and Meta Platforms have alluded to Nvidia's pivotal role in their operations, particularly in AI infrastructure and generative technologies. Throughout their earnings discussions, phrases such as "AI Infrastructure" and "generative AI" resound, underscoring the soaring demand for Nvidia's H100 GPU chip, which commands a price tag of over $40,000 and drives groundbreaking AI innovations like ChatGPT and Anthropic platforms.
Excitement builds for Nvidia's impending release of its next-generation AI chip, Blackwell, later this year. Elon Musk's explicit endorsement on Tesla's earnings call further solidifies Nvidia's eminence. The company plans to significantly boost its utilization of H100 GPU chips by year-end to enhance its Full Self-Driving software.
The surge in AI expenditure among mega-cap tech firms underscores the mounting significance of AI in shaping their future strategies. Meta Platforms, for instance, has substantially escalated its capital expenditures to fortify its AI infrastructure, aiming to acquire a notable one million H100 GPUs from Nvidia. Similarly, Microsoft has set its sights on strengthening its AI capabilities with an ambitious GPU procurement target of 1.8 million units by 2024, highlighting the widespread reliance on Nvidia's cutting-edge technologies across the tech landscape.
Nvidia Stock Forecast Technical Perspective
The last weekly candle closed as a doji after a bullish hammer declared that bulls are still in play. So, the next candle might be another green one.
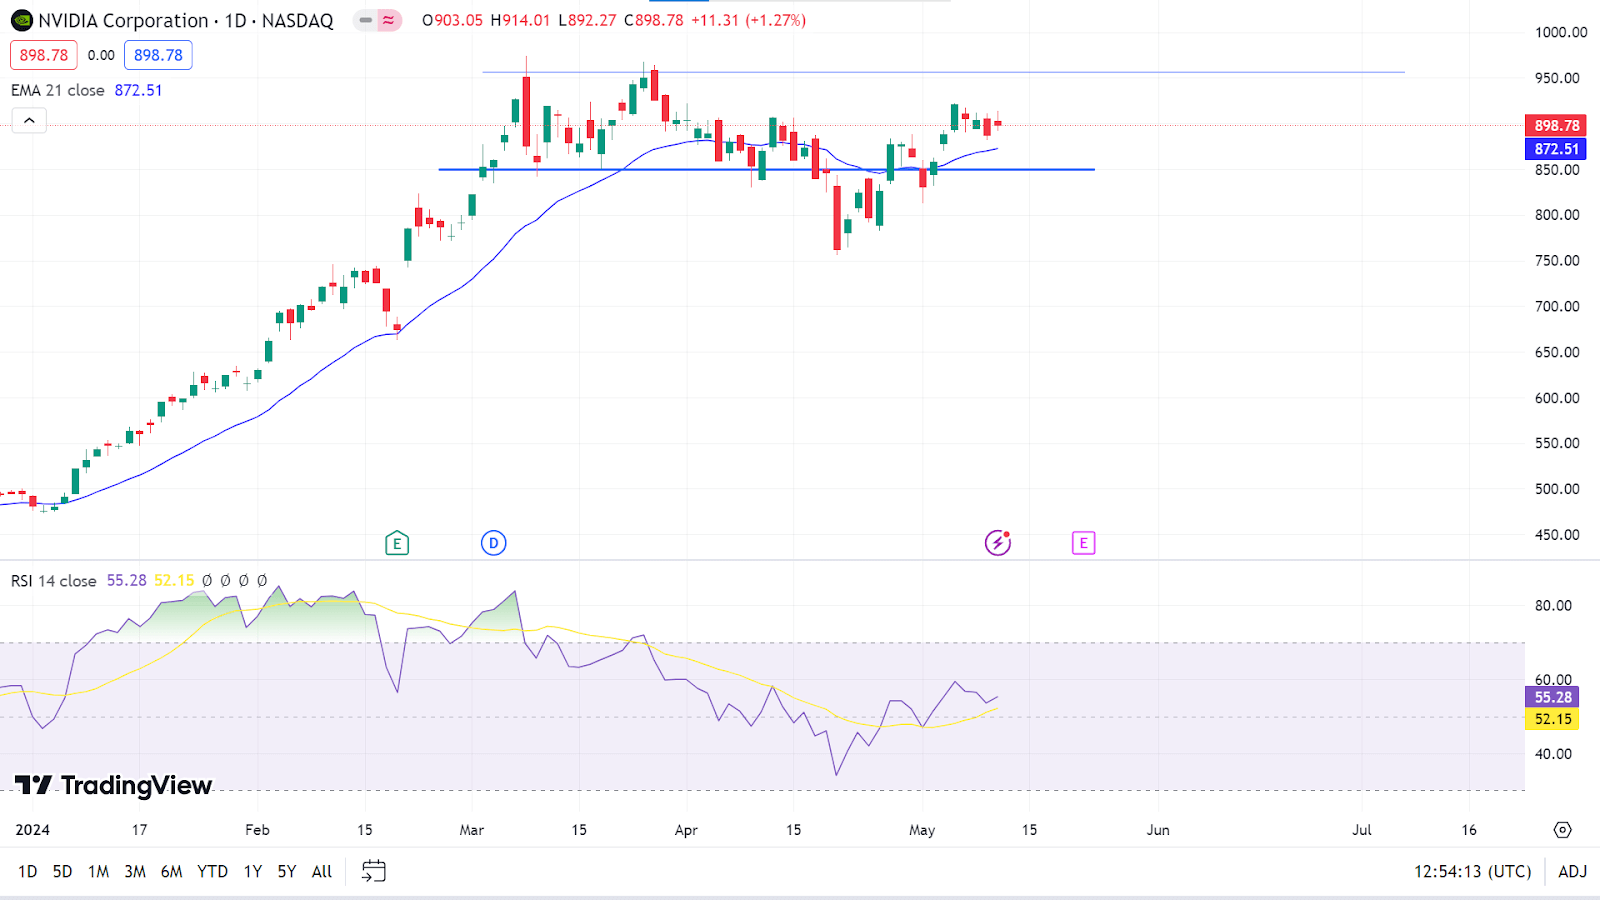
The price remains above the EMA 21 line on the daily chart, declaring bullish pressure, whereas the RSI indicator reading remains neutral. So, the price can continue to regain the primary resistance of nearly $974.00 or more.
Meanwhile, if the price exceeds the EMA 21 line on the downside, it can drop to the recent support near $812.55, followed by the next support near $756.06. In that case, the RSI signal line will continue to move lower.
WTI Crude Oil (USOUSD)
Fundamental Perspective
Oil prices reached a one-week peak on Thursday, driven by promising data from China and the U.S., indicating a potential surge in demand within the world's top two crude-consuming nations. Brent futures settled at $83.88 per barrel, up by 30 cents, while U.S. West Texas Intermediate crude settled at $79.26 per barrel, marking the highest close for both benchmarks since April 30. However, this uptick was dampened by U.S. energy data revealing a decline in gasoline and diesel demand to its lowest level since the onset of the 2020 pandemic.
Analyst Phil Flynn of Price Futures Group noted the subdued fluctuation in crude prices due to the shortage of significant oil-related developments and uncertain geopolitical dynamics in the Middle East. Conversely, in China, April witnessed a notable surge in crude oil imports compared to the previous year, along with a resurgence in exports and imports, signaling a potential rebound in both domestic and international demand as efforts to stabilize the nation's economy continue.
Meanwhile, in the U.S., a notable increase in new claims for unemployment benefits—reaching their highest level in over eight months—underscored a cooling labor market. It prompted speculation among analysts about the possibility of two interest rate cuts by the U.S. Federal Reserve within the year as concerns about economic stability grew amid diminishing labor market momentum.
Oil Prices Forecast Technical Perspective
The last candle closed as a doji after a solid red candle declaring slight indecision, but sellers are still active. So, the next candle can be either red or green.

The price remains below the EMA 21 line, whereas the Stochastic indicator readings remain oversold, declaring bearish pressure on the asset price. So, the price can reach the primary support of $75.84, followed by the next support near $72.86.
However, if the price exceeds the EMA 21 line, it can reach the peak of $84.46, followed by the next resistance near $87.67. Then, the Stochastic indicator signal lines will continue to move up, supporting the bullish movement.


