
EURUSD
Fundamental Perspective
Recent movements in the EURUSD exchange rate highlight a complex interplay of economic data, geopolitical tensions, and market sentiment. The USD has maintained its strength, driven by safe-haven demand amid geopolitical concerns, notably Russia's remarks on nuclear doctrine and arms supply. US economic indicators present a mixed picture, with weak retail sales and building permits offset by stronger industrial production and capacity utilization. This mixed economic outlook has been further influenced by initial jobless claims and the Philadelphia Fed Manufacturing Survey falling below expectations.
Federal Reserve officials have adopted a hawkish tone, emphasizing concerns about inflation and tempering expectations for interest rate cuts. This stance has provided additional support to the USD, even as market participants await clearer signals on the direction of monetary policy. The anticipation of the US PCE Price Index and other key economic data points adds to the cautious market sentiment.
Economic data in the Eurozone has been equally ambivalent. While inflation figures have aligned with expectations, the German ZEW survey and the EU Composite PMI reveal underlying economic challenges. The HCOB PMIs further indicate stagnation in business activity, particularly within the manufacturing sector, signaling ongoing struggles in the region's economic recovery.
Critical data releases such as US Durable Goods Orders, Consumer Confidence, the Q1 GDP final estimate, the German IFO Business Climate index, the GfK Consumer Confidence Survey, and Retail Sales will be closely scrutinized. Significant deviations from expectations, especially in inflation metrics or Fed commentary, could provoke further volatility in the EUR/USD exchange rate.
EURUSD Forecast Technical Perspective
The last weekly candle closed as a hammer with a long upper wick and a small lower wick. The currency pair posted three consecutive losing weeks, leaving optimism that the next candle can be another red one.
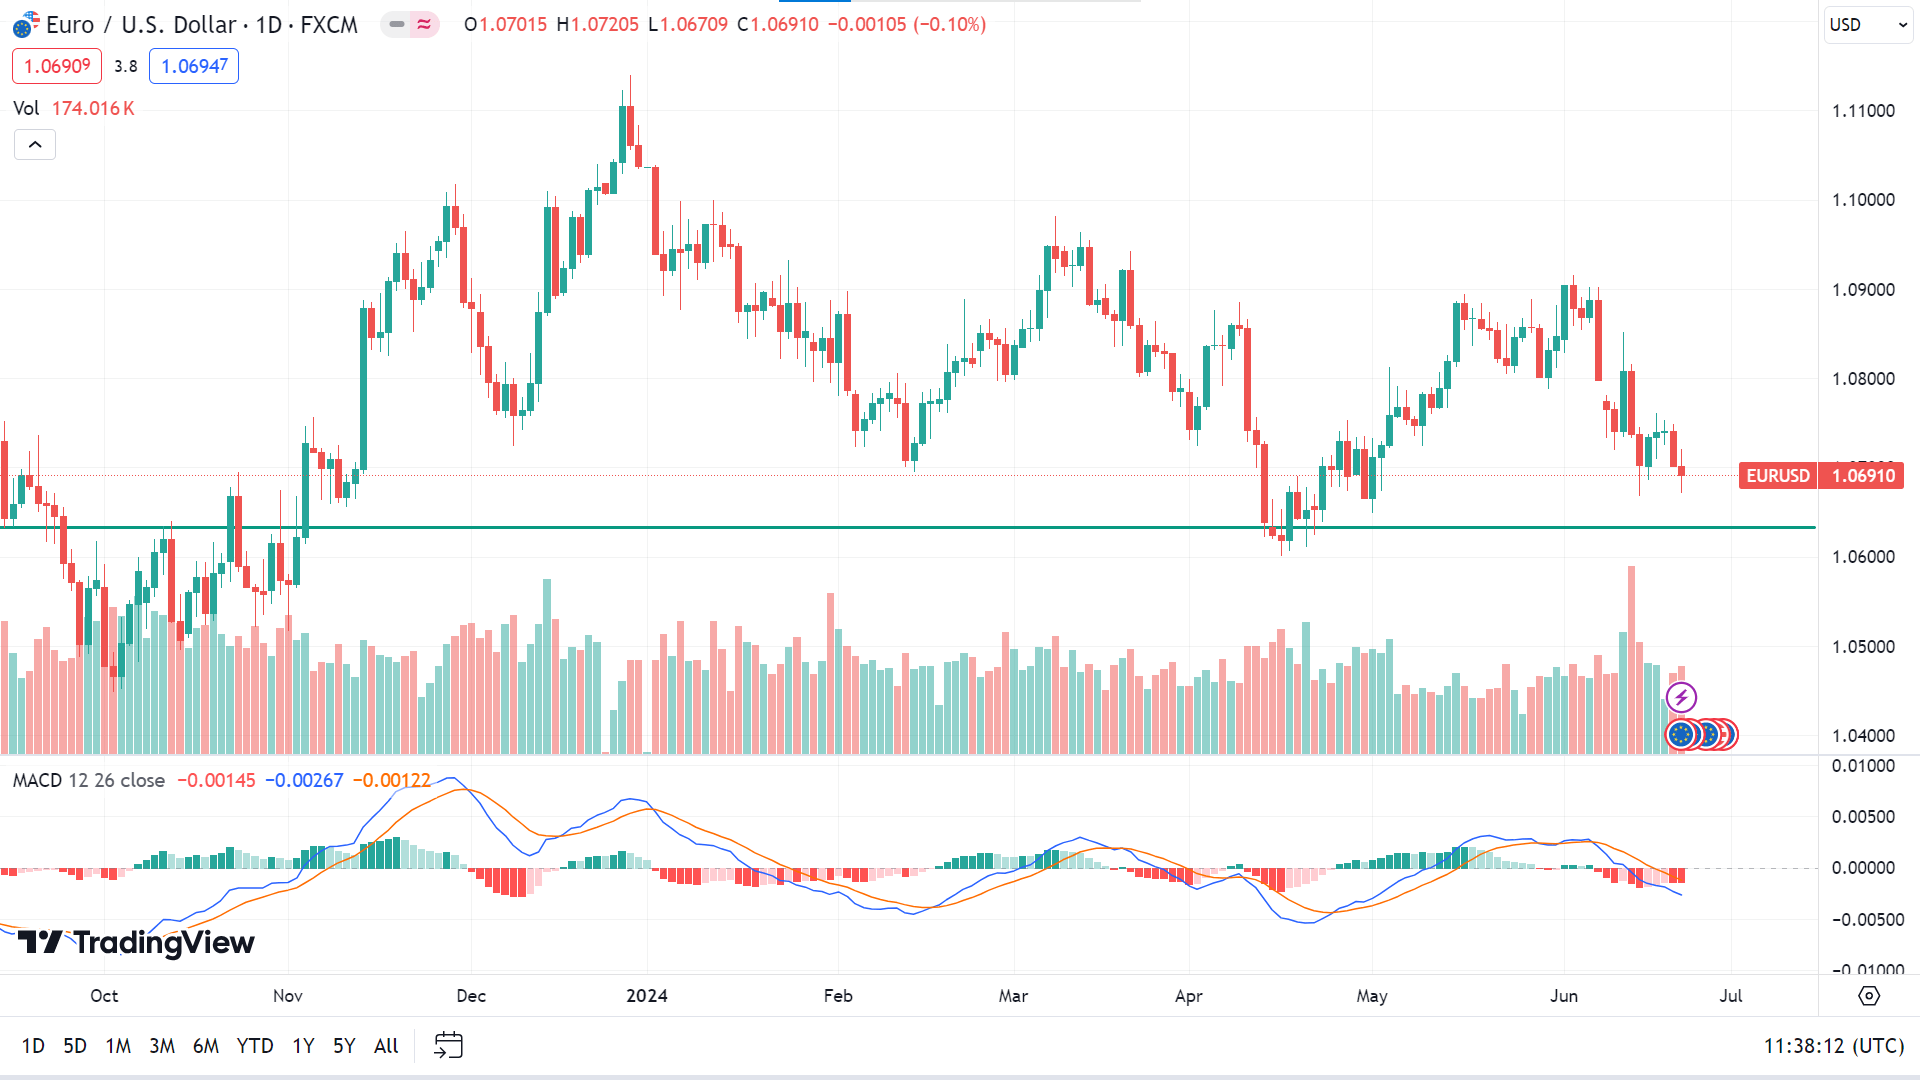
On the daily chart, the price continues to decline; looking at the MACD indicator reading, it remains in negative territory. The price may head toward the nearest support of $1.0601, followed by the next support near $1.0500.
On the positive side, any pause in the current trend may cause a price surge toward the primary resistance of $1.0811, followed by the next near $1.0916.
GBPJPY
Fundamental Perspective
GBP/USD closed Friday at a fresh five-week low of 1.2622, marking the Cable's third consecutive week of decline. The Bank of England's midweek rate hold failed to inspire confidence in the GBP, and a late-week surge in the US Purchasing Managers Index (PMI) dampened broad-market risk appetite, strengthening the US Dollar.
UK retail sales data were surprising, which rose 2.9% month over month in May, significantly exceeding the forecasted 1.5% increase and rebounding from the previous month's revised 1.8% contraction. This unexpected boost in retail sales offered a glimmer of hope for the UK economy amidst broader uncertainties.
In Japan, the Yen's long-term depreciation remains a concern, with experts suggesting that increasing interest rates is the only solution. However, the Bank of Japan (BoJ) needs sustained inflation to justify such a move. The recent Japanese Consumer Price Index (CPI) data for May showed a headline inflation rate increase to 2.8% from 2.5%, largely due to a 10% rise in utility bills following the removal of government energy subsidies.
Nevertheless, the National CPI excluding Food and Energy cooled to 2.1% from 2.4%, indicating a rapid slowdown in underlying inflation. Marcel Thieliant of Capital Economics anticipates that while a rate hike at the BoJ's July meeting remains possible, the Bank will likely maintain current rates afterward due to the slowing inflation.
GBPJPY Forecast Technical Perspective
The weekly chart shows that the last candle ended solid green, reflecting the strong bullish pressure on the asset price, indicating that the next candle might be another green one.
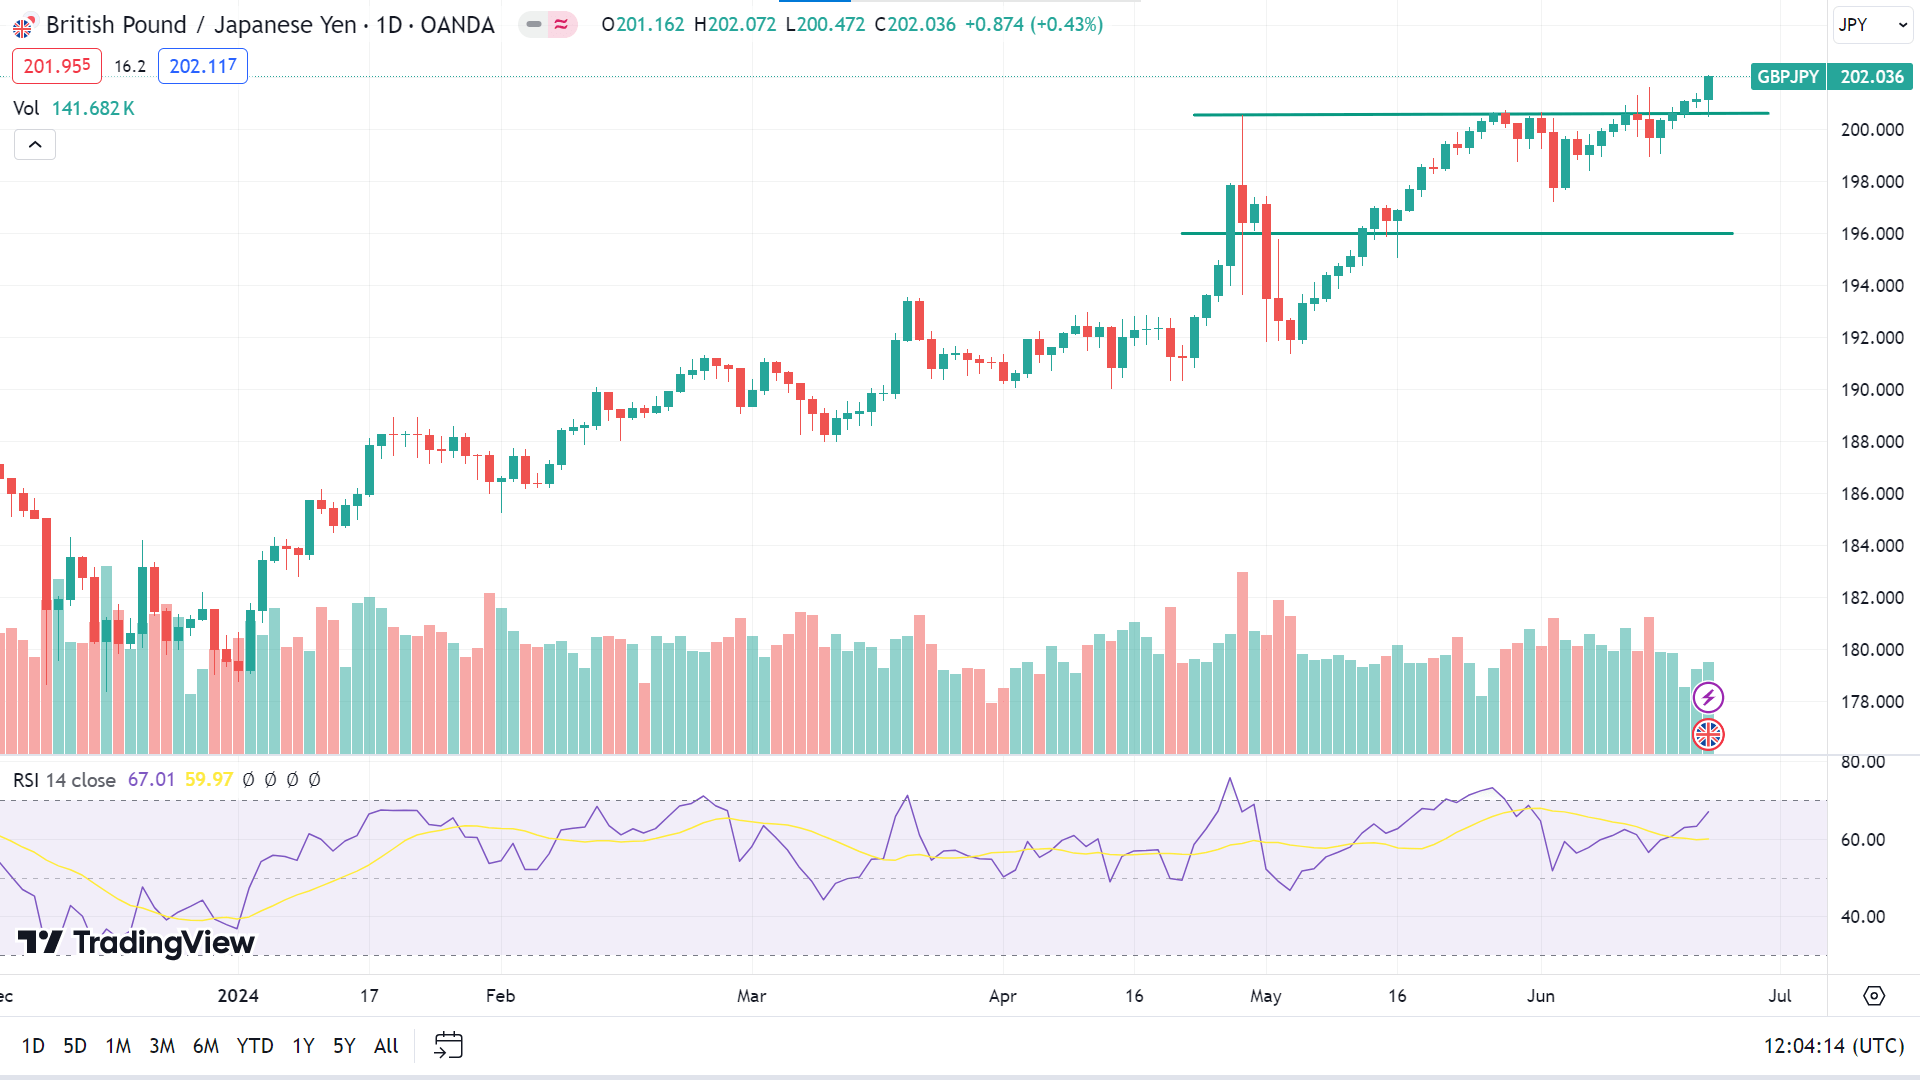
The price on the daily chart is moving in an uptrend, and the RSI indicator readings support the movement as they remain neutral below the overbought territory. So, the price may seek to create a new peak near 203.31, whereas the next resistance is near 206.89.
However, any correction in the current trend can trigger the price to reach the current support of 201.16, followed by the next support near 197.51. The RSI indicator reading will also follow the movement then.
Nasdaq 100 (NAS100)
Fundamental Perspective
Financial markets may face renewed volatility next week with the release of notable US economic data. CB consumer confidence, durable goods, and Michigan consumer confidence are potential market movers. However, the final US Q1 GDP report on Wednesday and the US core PCE release on Friday are the main events to watch.
The core PCE, which has stalled around 2.8%, remains well above the Federal Reserve's 2% target. Should this metric remain unchanged, it will increase pressure on the Fed to maintain current interest rates for an extended period.
These data points will be crucial in shaping market expectations regarding the Fed's policy direction. Investors will closely monitor these releases, anticipating their potential impact on financial markets and future monetary policy decisions.
Among earnings releases, there are crucial reports from Enerpac Tool Group Corp. (EPAC), FedEx Corporation (FDX), Micron Technology (MU), Nike Inc (NKE), etc.
Technical Perspective
The last weekly candle closed as a doji after a solid gaining candle, reflecting a pause in gaining weeks but confirming that bulls are still in the play, leaving hopes for buyers in the upcoming week.
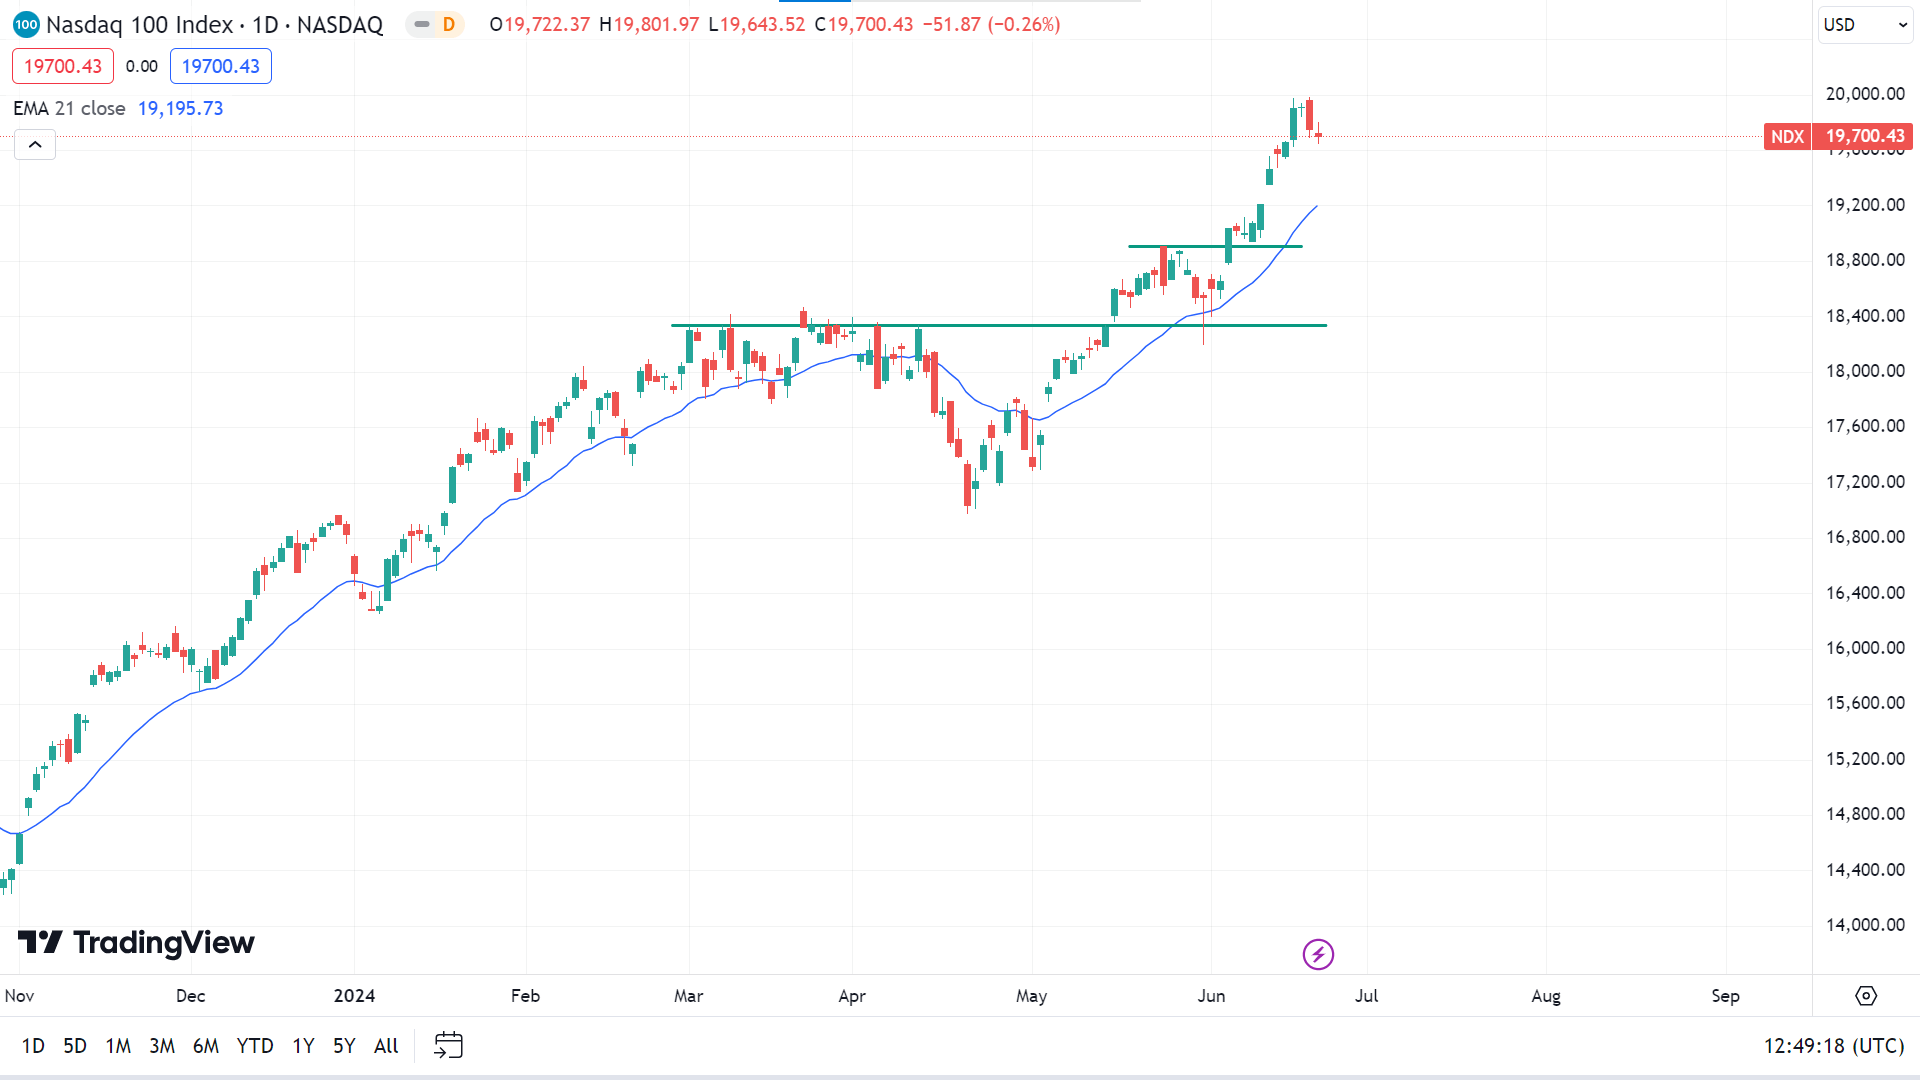
The price has hovered above the EMA 21 line in the daily chart for over two weeks, reflecting solid buying pressure on the asset price and indicating that it may reach the current peak of $19,979.93 or above.
Meanwhile, on the negative side, any retracement can occur, leading the price to drop to the nearest support of $19,195.73, followed by the next support near $18,909.38.
S&P 500 (SPX500)
Fundamental Perspective
Last week proved pivotal for US indices as both the S&P and Nasdaq 100 breached significant psychological thresholds at 5500 and 20000, respectively. However, their ability to sustain these levels was fleeting, highlighting the challenge of gaining acceptance above such barriers. The market downturn was partly fueled by Nvidia's ongoing decline, which saw the chipmaker's shares drop 1.4% in pre-market trading on Friday. Uncertainty persists regarding Nvidia's valuation, contributing to market volatility.
Early in the week, conflicting signals emerged from the US economy, with weak data countered by Federal Reserve comments suggesting a potential for prolonged higher interest rates. While producer price inflation showed encouraging signs, concerns over inflation remain prominent, exacerbated by geopolitical tensions that could impede effective inflation control efforts.
Despite positive PMI data for manufacturing and services surpassing expectations, US equities slid further on Friday, underscoring a persistent divergence between economic indicators and stock market performance. Signs of a possible deeper correction contributed to the overall decline in US indices.
Investor sentiment also faltered as US equity funds experienced significant outflows for the second consecutive week, totaling nearly $30 billion over the past two weeks. Large-cap and multi-cap funds led the retreat, particularly in the healthcare and industrial sectors. In contrast, despite lingering valuation concerns, the tech sector saw a second week of inflows totaling approximately $554 million.
Technical Perspective
On the weekly chart, the last candle finished as a hammer candlestick with an upper wick and green body after a solid green candle, leaving optimism that the next one might be another green.
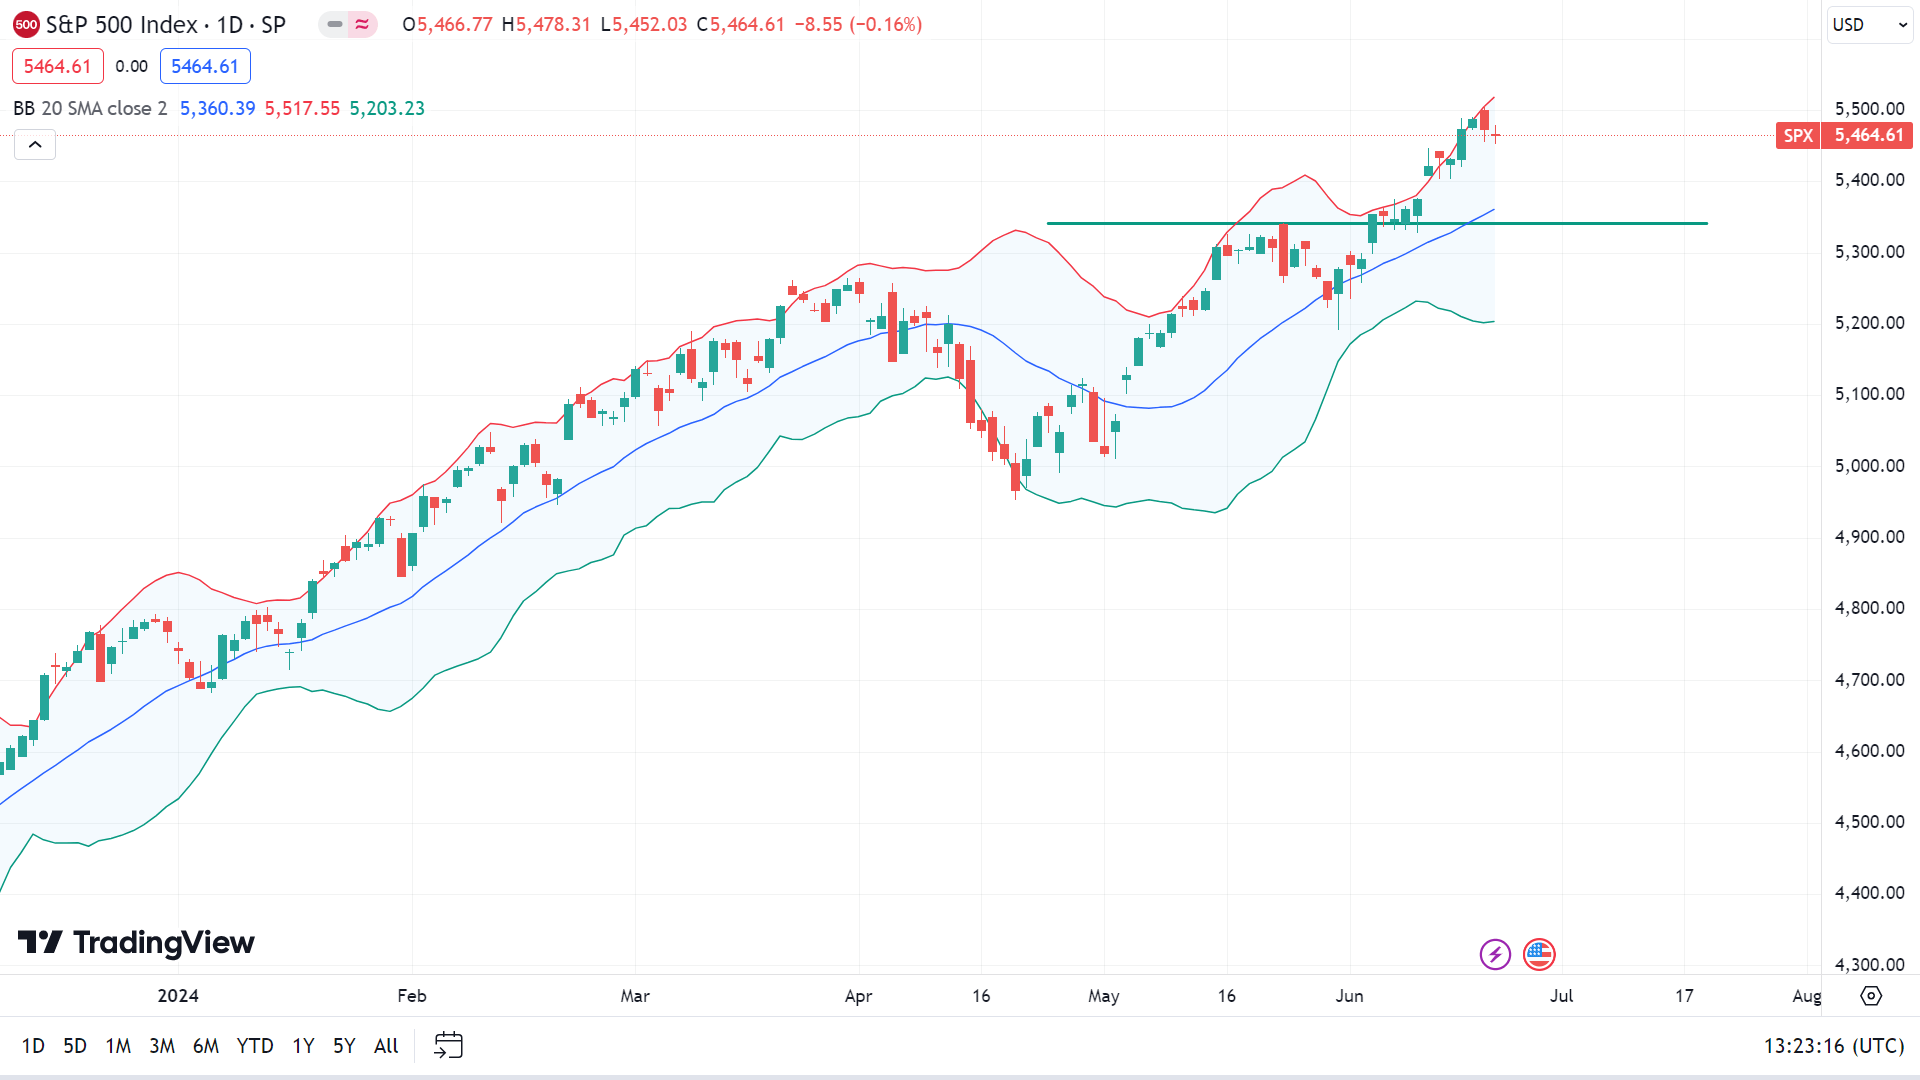
The price is moving closer to the upper band of the Bollinger Bands indicator on the daily chart, indicating the price may regain the current peak of $5,505,53 or above.
On the negative side, the price on the upper band indicates overbought, which can cause a pause in the uptrend, which may lead to the price dropping to the nearest support of $5,360.39, followed by the next support of $5,256.74.
Bitcoin (BTCUSD)
Fundamental Perspective
The recent turbulence in the cryptocurrency market has sparked debates over its underlying causes. Initially, attention centered on a substantial Bitcoin sale reportedly executed by the German government, involving the transfer of 6,500 BTC worth $425 million on June 19. This move, allegedly from BTC seized years ago in a piracy case, was seen as a catalyst for market volatility. However, the impact of this sale was partially offset when MicroStrategy, a U.S.-based company, disclosed a significant purchase of 11,931 BTC for $786 million the following day, countering the downward pressure on prices.
Simultaneously, global financial markets faced a "triple witching" event on June 21, involving the expiration of a substantial $5.5 trillion in derivatives contracts tied to stocks and indices. This event occurred against a backdrop of weakening economic indicators, including declining U.S. home sales and disappointing PMI figures across Europe and Japan, which underscored broader concerns about economic growth prospects.
Furthermore, uncertainties surrounding the U.S. debt ceiling suspension and potential credit rating downgrades have contributed to a cautious market sentiment. These factors highlight the complex interplay between regulatory actions, macroeconomic conditions, and investor behavior that continues to shape the dynamics of the cryptocurrency market amidst broader economic uncertainties worldwide.
Bitcoin Price Prediction Technical Perspective
The last candle on the weekly chart finished solid red, posting two consecutive losing weeks, which leaves confusion and indicates that the next candle might be another red one.
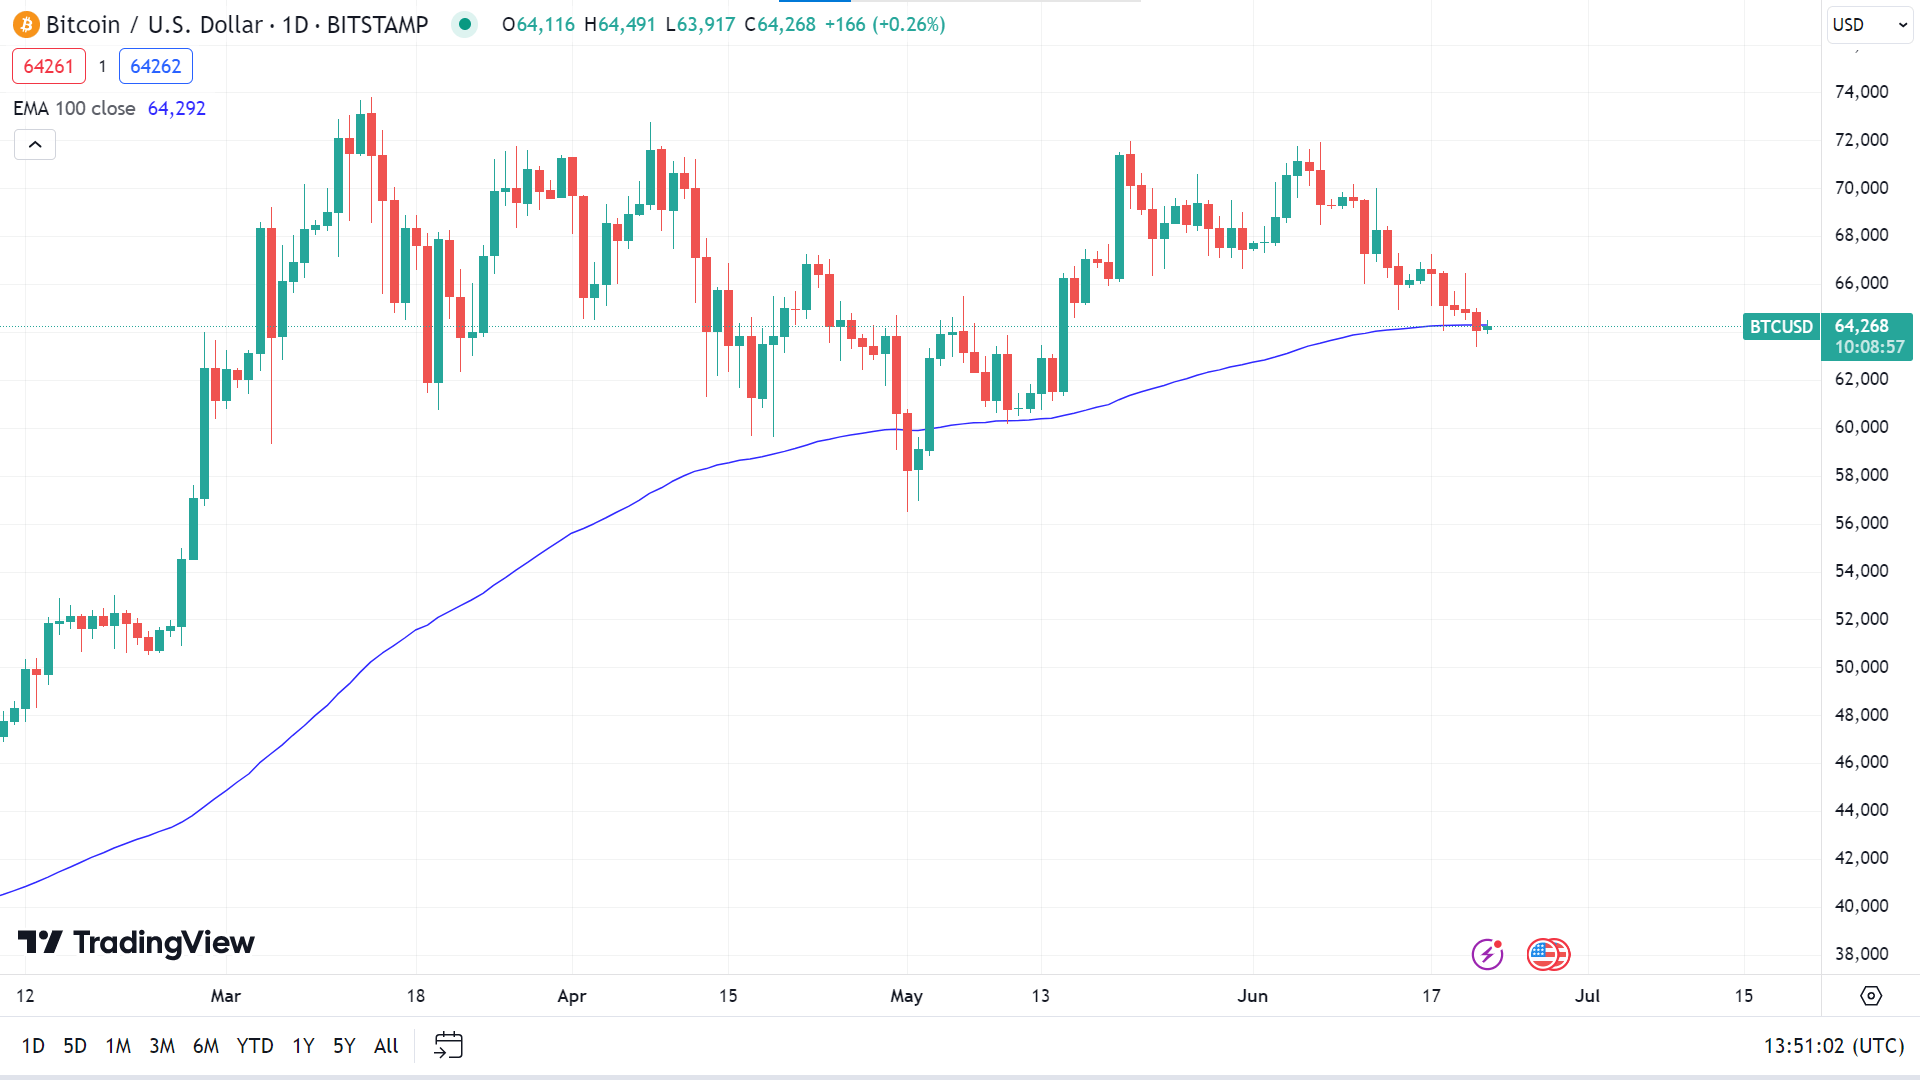
At the time of writing, the price just declined below the EMA 100 line on the daily chart, indicating fresh bearish pressure on the asset price, leaving optimism that the price may drop to the nearest support of $60,556, followed by the next support near $57,753.
However, if the price manages to exceed the EMA 100 line again on the upside, it will indicate the price may head to regain the nearest resistance of $67,435. Meanwhile, the next resistance level is near $70,153.
Ethereum (ETHUSD)
Fundamental Perspective
Bitcoin (BTC) and Ethereum (ETH) holders are among the most influential investors in the crypto space, often inspiring new investors to emulate their strategies. Recently, these investors have begun shifting their support to Kelexo (KLXO). With the Kelexo token currently priced at $0.05, these prominent figures believe it has the potential to be a disruptive force in decentralized finance, fostering substantial growth in the sector.
Ethereum (ETH), renowned for introducing smart contracts to decentralized finance, remains a favorite in the crypto market. Its blockchain, which automates transactions and enforces agreements, has become the foundation for significant development and innovation. Ethereum's robust capabilities continue to set it apart in the crypto ecosystem.
Reports indicate that Ethereum's innovation in smart contracts will also be utilized by the emerging crypto lending platform Kelexo (KLXO). This integration underscores why Ethereum is often seen as a pioneer in crafting the future of cryptocurrency with its advanced functionalities. Adopting Ethereum's technology through platforms like Kelexo highlights its ongoing influence and pivotal role in shaping the decentralized finance landscape.
Ethereum Price Prediction Technical Perspective
Like the previous one, the last candle on the weekly chart closed as a hammer candle with a red body and a lower wick, posing four consecutive losing weeks, signaling the next one might be another red one.
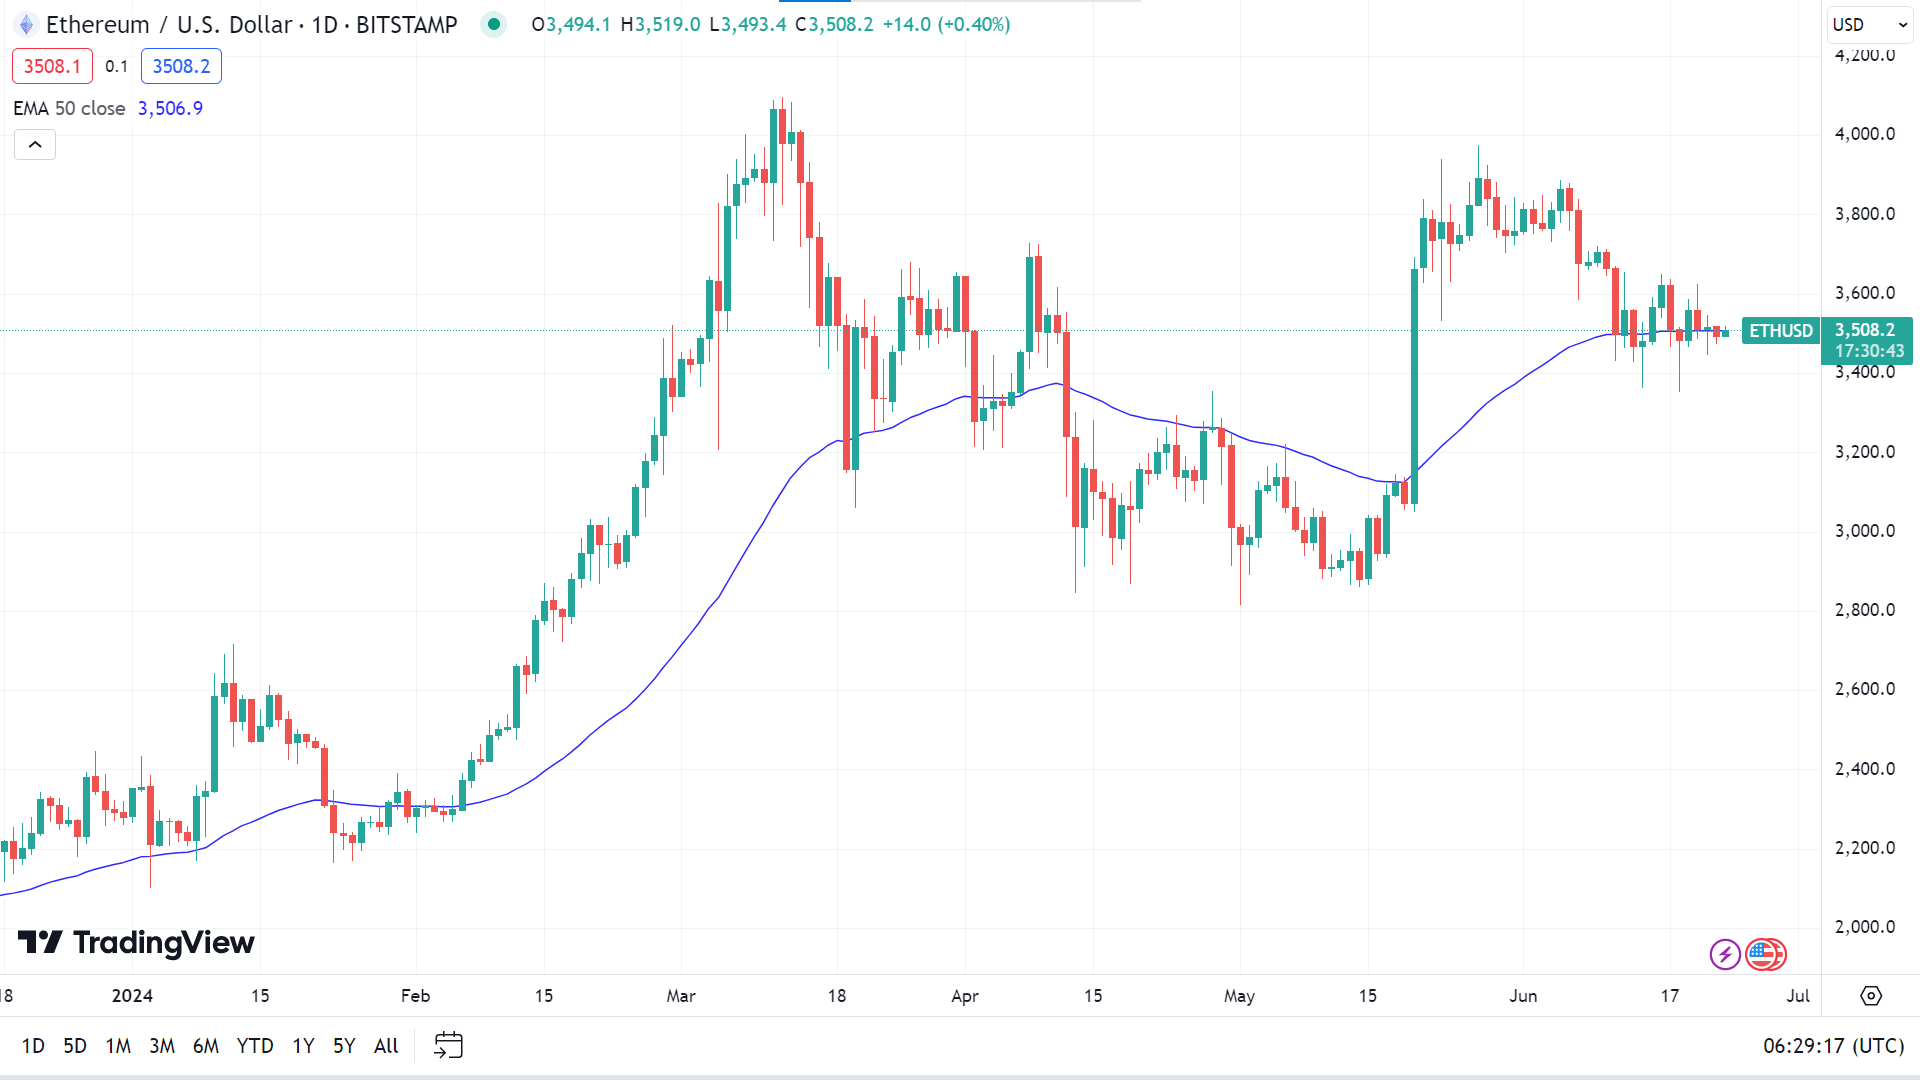
The price is moving closer to the EMA 50 line, indicating sideways. Any reading above the EMA 50 line can trigger the price to the nearest resistance of $3650.00, followed by the next resistance near $3812.60.
Meanwhile, a decline below the EMA 50 line can cause the price to drop to the nearest support of $3379.40, followed by the next support near $3085.20.
Gold (XAUUSD)
Fundamental Perspective
After a steady start to the week, Gold (XAUUSD) broke free from its narrow trading range on Thursday, soaring to a two-week high above $2,360. However, the persistent strength of the USD towards the weekend erased these gains. Investors now focus on geopolitical developments and key US data releases in the upcoming week.
Gold's potential rise was initially hindered by a cautious tone from Federal Reserve officials, with Minneapolis Fed President Neel Kashkari suggesting rate cuts might be deferred until December and Philadelphia Fed President Patrick Harker indicating rates might stay higher for longer. On Tuesday, this disappointing US retail sales data allowed Gold to hold its ground despite its strength in the USD.
On Thursday, geopolitical tensions flared as Israel's military prepared for an offensive against Lebanon, prompting a bullish response in Gold prices. Nevertheless, strong US economic data on Friday, including improved PMI figures, bolstered the USD and negated Gold's earlier gains.
Attention will turn to geopolitical headlines and crucial US economic indicators in the week ahead. The final revision of Q1 GDP growth and the PCE Price Index for May are expected to be pivotal. Investors will closely watch the core PCE reading, as it could influence expectations for future Fed rate cuts, thereby impacting both the USD and Gold's trajectory.
Gold Price Prediction Technical Perspective
The last weekly candle closed with a small red body and wicks on both sides after a solid green candle, reflecting a pause. So, the next candle will be either green or red.
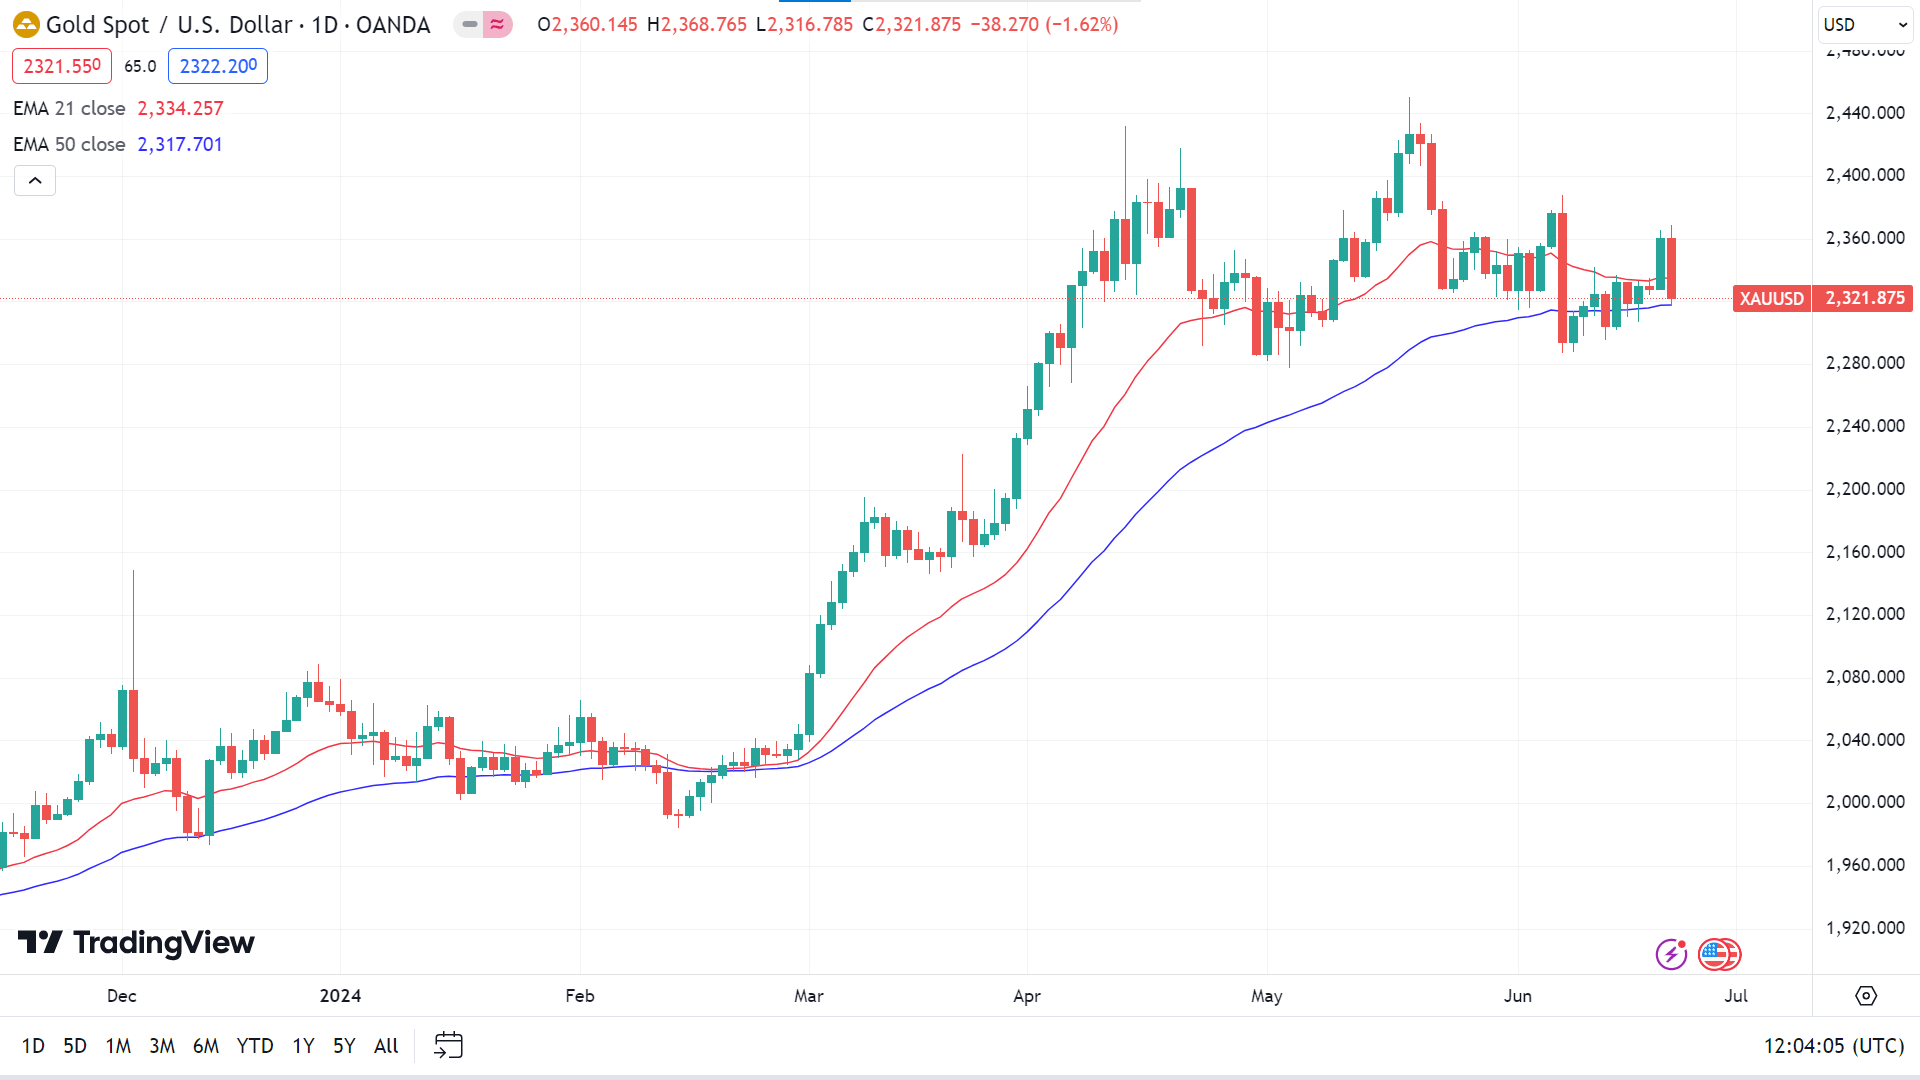
The price is floating between the EMA 21 and EMA 50 lines, confusing investors. If the price reaches above the EMA 21 line, it will indicate that the price may head toward the nearest resistance of $2364.38, followed by the next resistance near $2382.88.
On the other hand, if the price continues to decline below the EMA 50 line, it may open the door to reaching the nearest support of $2298.29, followed by the next support near $2281.10.
Tesla Stock (TSLA)
Fundamental Perspective
Barclays has taken a cautious stance on Tesla (TSLA) ahead of its Q2 2024 results, maintaining an "Equal-Weight" rating and setting a price target of $180 per share. The analysts project Tesla's deliveries for the quarter to be around 415,000 units. While this represents an improvement over the 386,810 vehicles delivered in Q1 2024, it needs to meet the consensus estimate of 444,000 units. Barclays' forecast aligns more closely with muted buy-side expectations, suggesting the final consensus for Q2 might also be lower.
The analysts cite underwhelming sales in Europe and modest production increases in China as reasons for the potential shortfall. They also express concerns about inventory issues, forecasting production to reach approximately 420,000 units, which could lead to further inventory accumulation. Barclays estimates a rise in global inventory by around 5,000 vehicles, bringing the total to about 150,000 units.
The analysts attribute Tesla's potentially weak Q2 performance to underwhelming European sales and modest production increases in China. They also highlight inventory concerns, anticipating an increase in production to about 420,000 units, which could exacerbate inventory build-up. Barclays estimates a rise in global inventory by approximately 5,000 vehicles, reaching about 150,000 units.
This forecast follows Tesla's disappointing Q1 2024, when deliveries fell short of expectations, with fewer than 387,000 vehicles against estimates of 415,000-430,000 units. Another miss in Q2 could further negatively impact Tesla. Barclays warns that Tesla's Q2 margins may hit a new low, leading to further negative EPS revisions, and anticipates continued downward revisions for Tesla's 2024 and 2025 estimates.
Tesla Stock Forecast Technical Perspective
The last candle on the weekly chart finished with a green body after several doji candles, which signals the upcoming candle might be another green one.
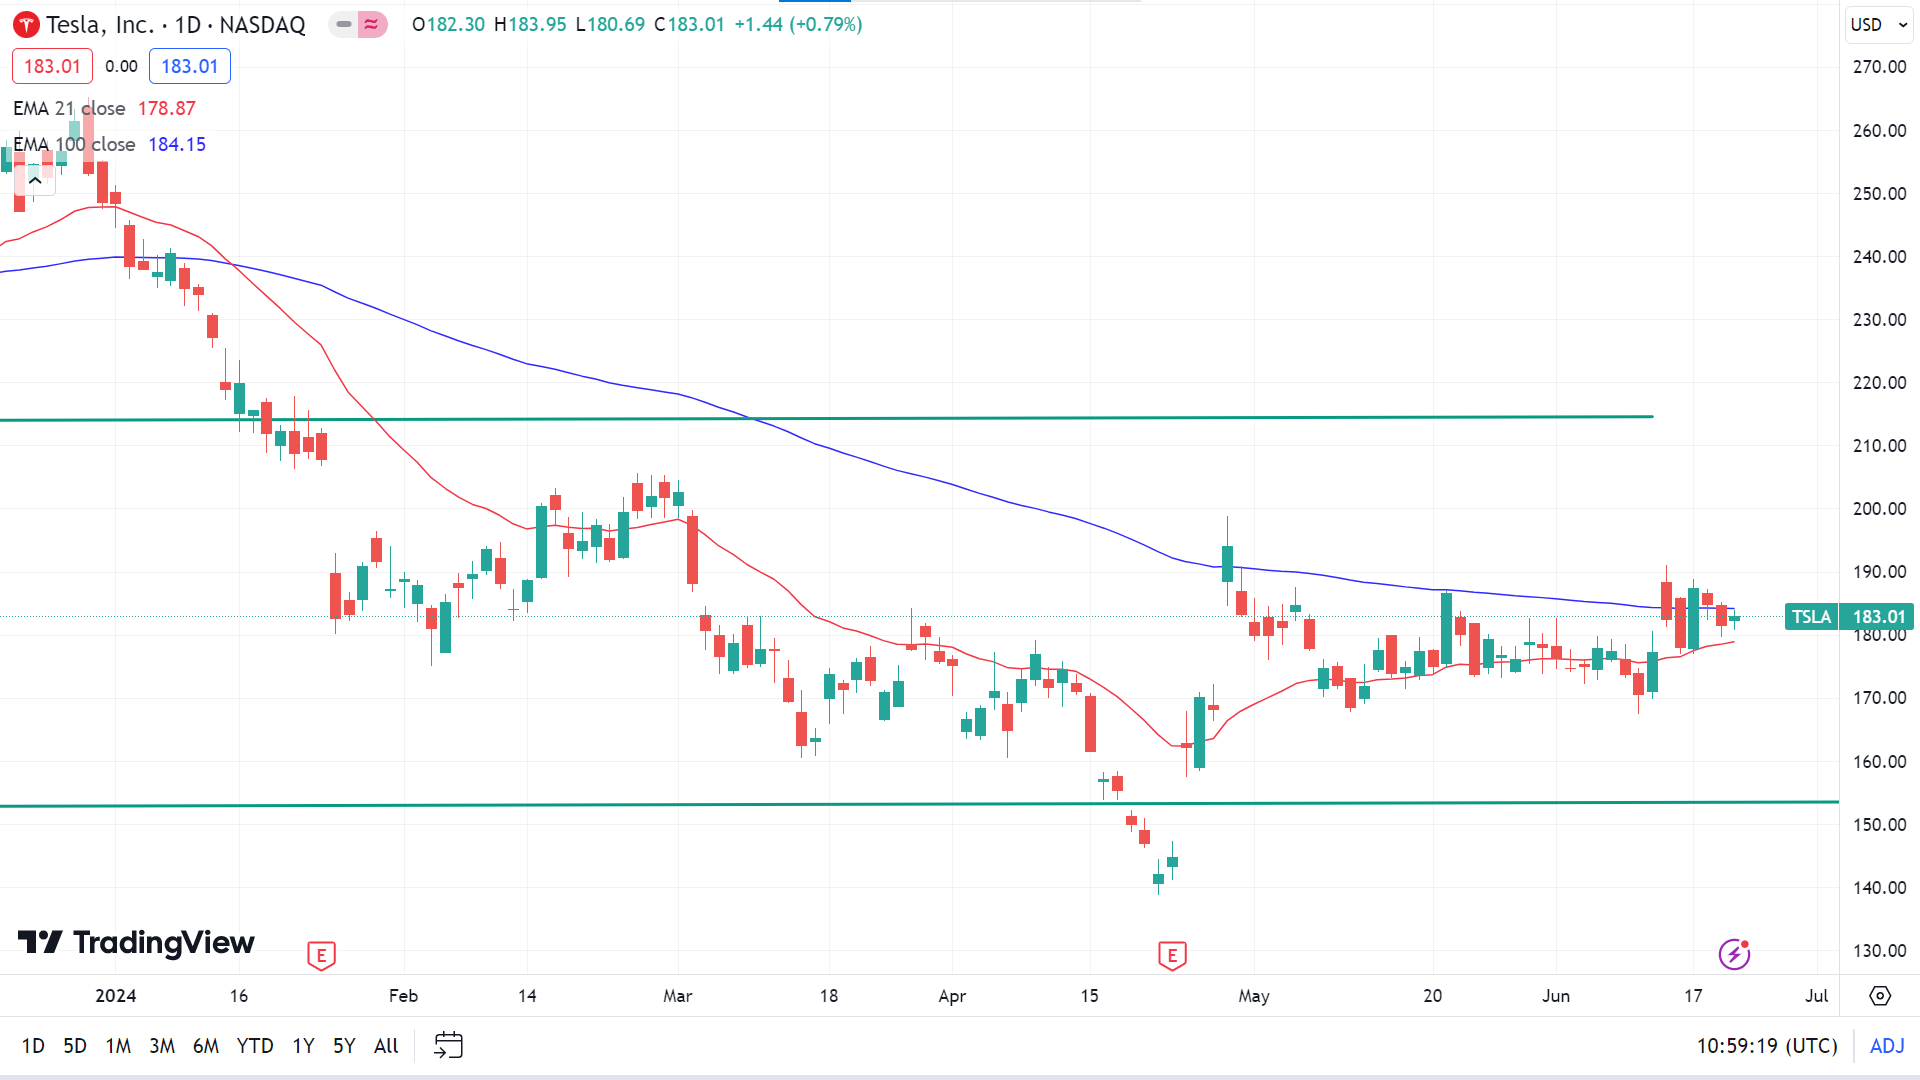
The price is floating between EMA 100 and EMA 21 lines on the daily chart. If the price surpasses the EMA 100 line on the upside, it will reflect significant bullish pressure on the asset price, which can trigger it to reach the nearest resistance of $190.52. Meanwhile, the next resistance is near $197.60.
However, if the price declines below the EMA 21 line, it will signal the price may head toward the primary support of $170.93, followed by the next support near $162.76.
Nvidia Stock (NVDA)
Fundamental Perspective
Nvidia's upcoming annual shareholder meeting on June 26, 2024, is eagerly anticipated by investors seeking clarity on the company's trajectory, especially within the dynamic artificial intelligence (AI) sector. The meeting will be pivotal, focusing on strategic initiatives and critical votes to offer insights into Nvidia's strategic positioning and growth prospects.
Despite echoes of past tech market volatility, Nvidia remains a cornerstone in the semiconductor industry, driven by its dominant position in AI-centric chips. Investors are particularly focused on Nvidia's robust financial health, which is underpinned by substantial cash reserves. This economic strength enables Nvidia to maintain a strong investment in research and development, outpacing competitors like AMD and Intel. Such financial resilience reinforces its market leadership and underscores its capacity for sustained innovation, which is critical for maintaining technological superiority.
Furthermore, Nvidia benefits from the rapid expansion of the AI market, which is projected to grow at a robust compound annual growth rate (CAGR) of 28.5% through 2030. This growth trajectory augurs well for Nvidia's semiconductor business despite challenges such as heightened competition and potential market saturation. Nvidia's strategic diversification into sectors like autonomous vehicles and robotics further enhances its ability to capitalize on emerging opportunities and solidify its role in shaping the future of AI technology.
In summary, Nvidia's shareholder meeting represents a pivotal moment for stakeholders to evaluate its strategic direction amid a dynamic market landscape. While optimism about AI's potential drives investor confidence, carefully considering risks and competitive dynamics remains essential for assessing Nvidia's long-term trajectory and market position.
Nvidia Stock Forecast Technical Perspective
After several weeks of gains, the last candle closed with a red body and upper wick, reflecting a pause in the current trend and leaving confusion. The upcoming candle can be green or red, depending on investors' actions.
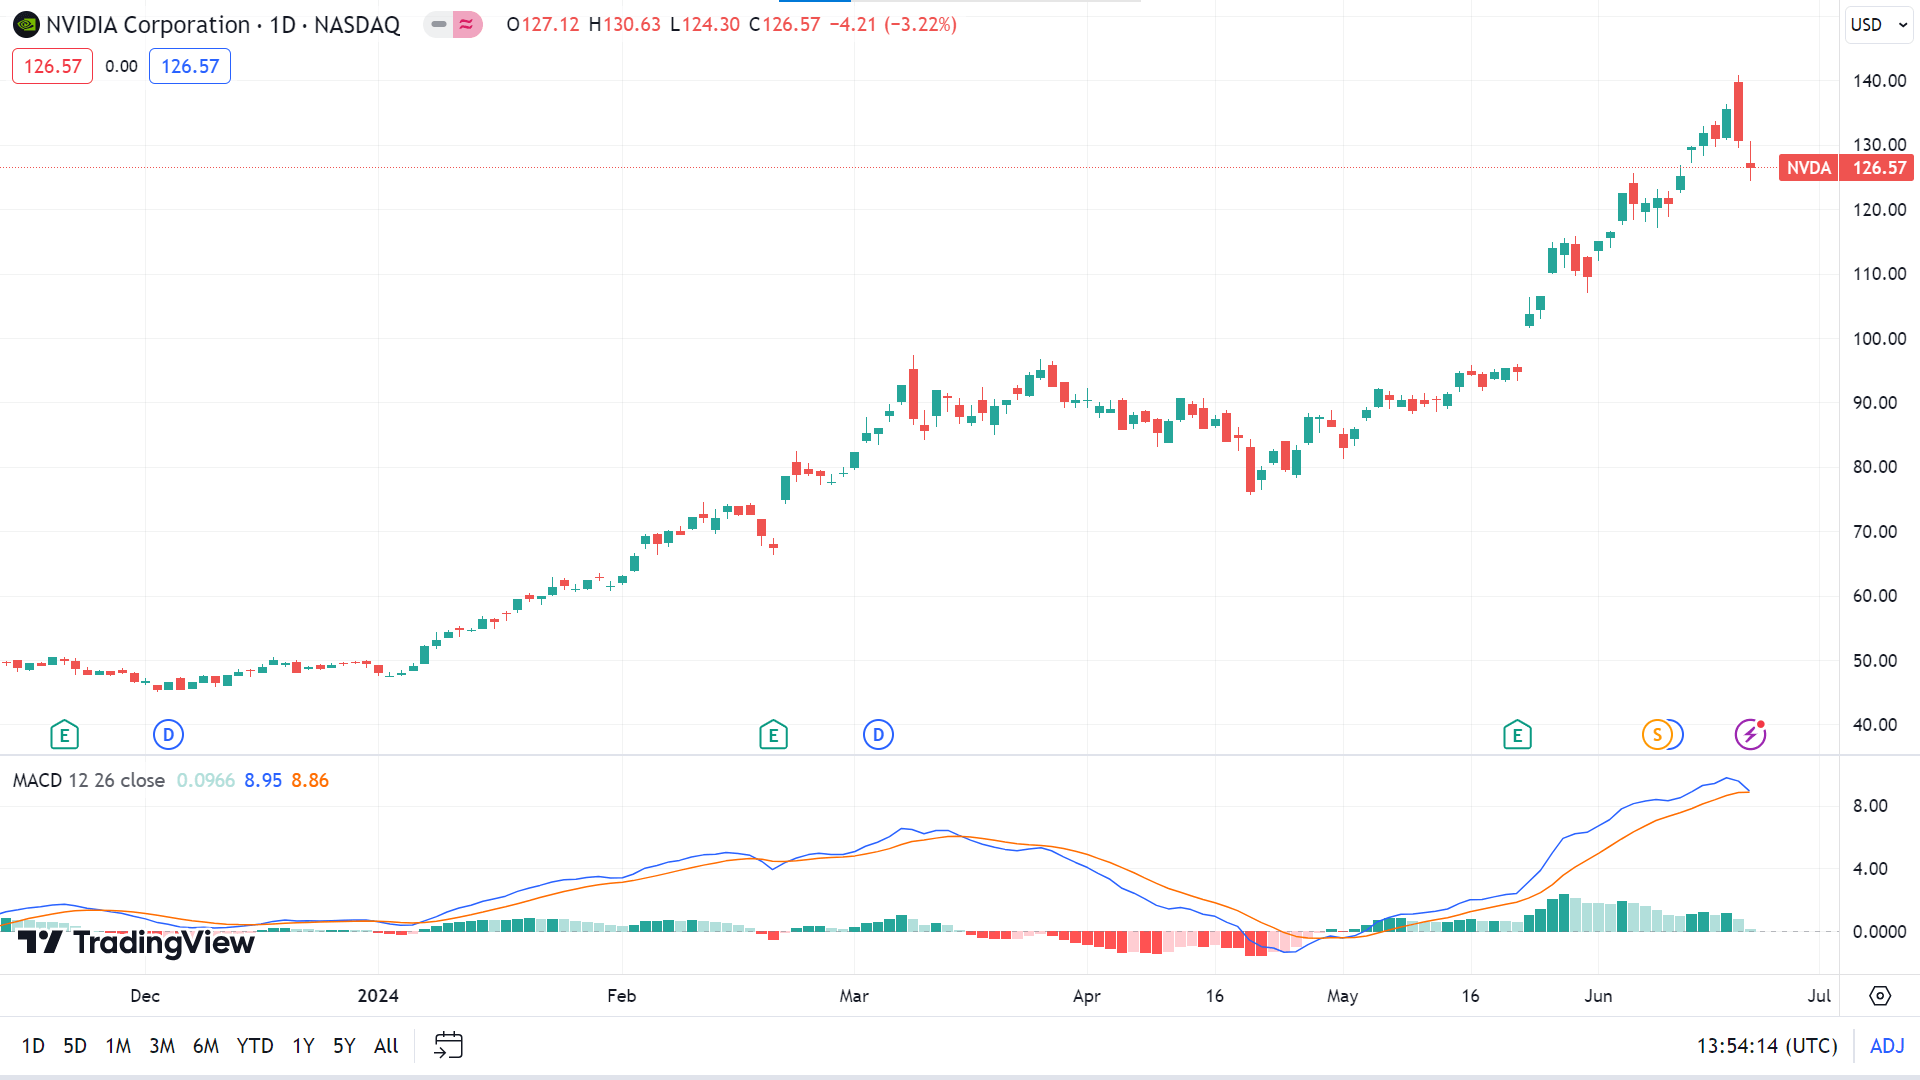
The MACD indicator reading remains neutral on the daily chart. The histogram lines show that the bullish pressure may fade while the signal lines come closer, remaining in the overbought territory. If the bullish pressure remains intact in the coming days, the price can continue to regain its peak of $140.76 or more.
Meanwhile, on the negative side, the price can return to the current support of $121.74, followed by the next support of $115.73, and the MACD indicator reading will also follow the price direction.
WTI Crude Oil (USOUSD)
Fundamental Perspective
West Texas Intermediate (WTI) US Crude Oil hit a new weekly high early Friday before slipping into negative territory. This downturn followed the Energy Information Administration's (EIA) report indicating that US crude production remains near record levels, alongside a larger-than-expected increase in natural gas reserves.
The EIA reported a 71 billion cubic feet (Bcf) rise in natural gas storage, bringing US reserves to a multi-month high of 3,045 Bcf for the week ending June 14. This increase followed a 74 Bcf rise the previous week, with expectations for a more modest build of 69 Bcf. As natural gas reserves accumulate ahead of peak summer cooling demand, the likelihood of a significant rise in crude oil demand diminishes, curbing hopes for a substantial drawdown during the season.
June's US Purchasing Managers Index (PMI) also surpassed expectations, dampening broad-market hopes for immediate rate cuts. With the Federal Reserve unlikely to expedite rate cuts in 2024, crude oil markets are reassessing near-term bullish outlooks as investors heavily rely on rate reductions to ease lending and financing costs.
Oil Prices Forecast Technical Perspective
On the weekly chart, the last candle ended green, posting two consecutive gaining weeks, leaving optimism for buyers for the next weeks.
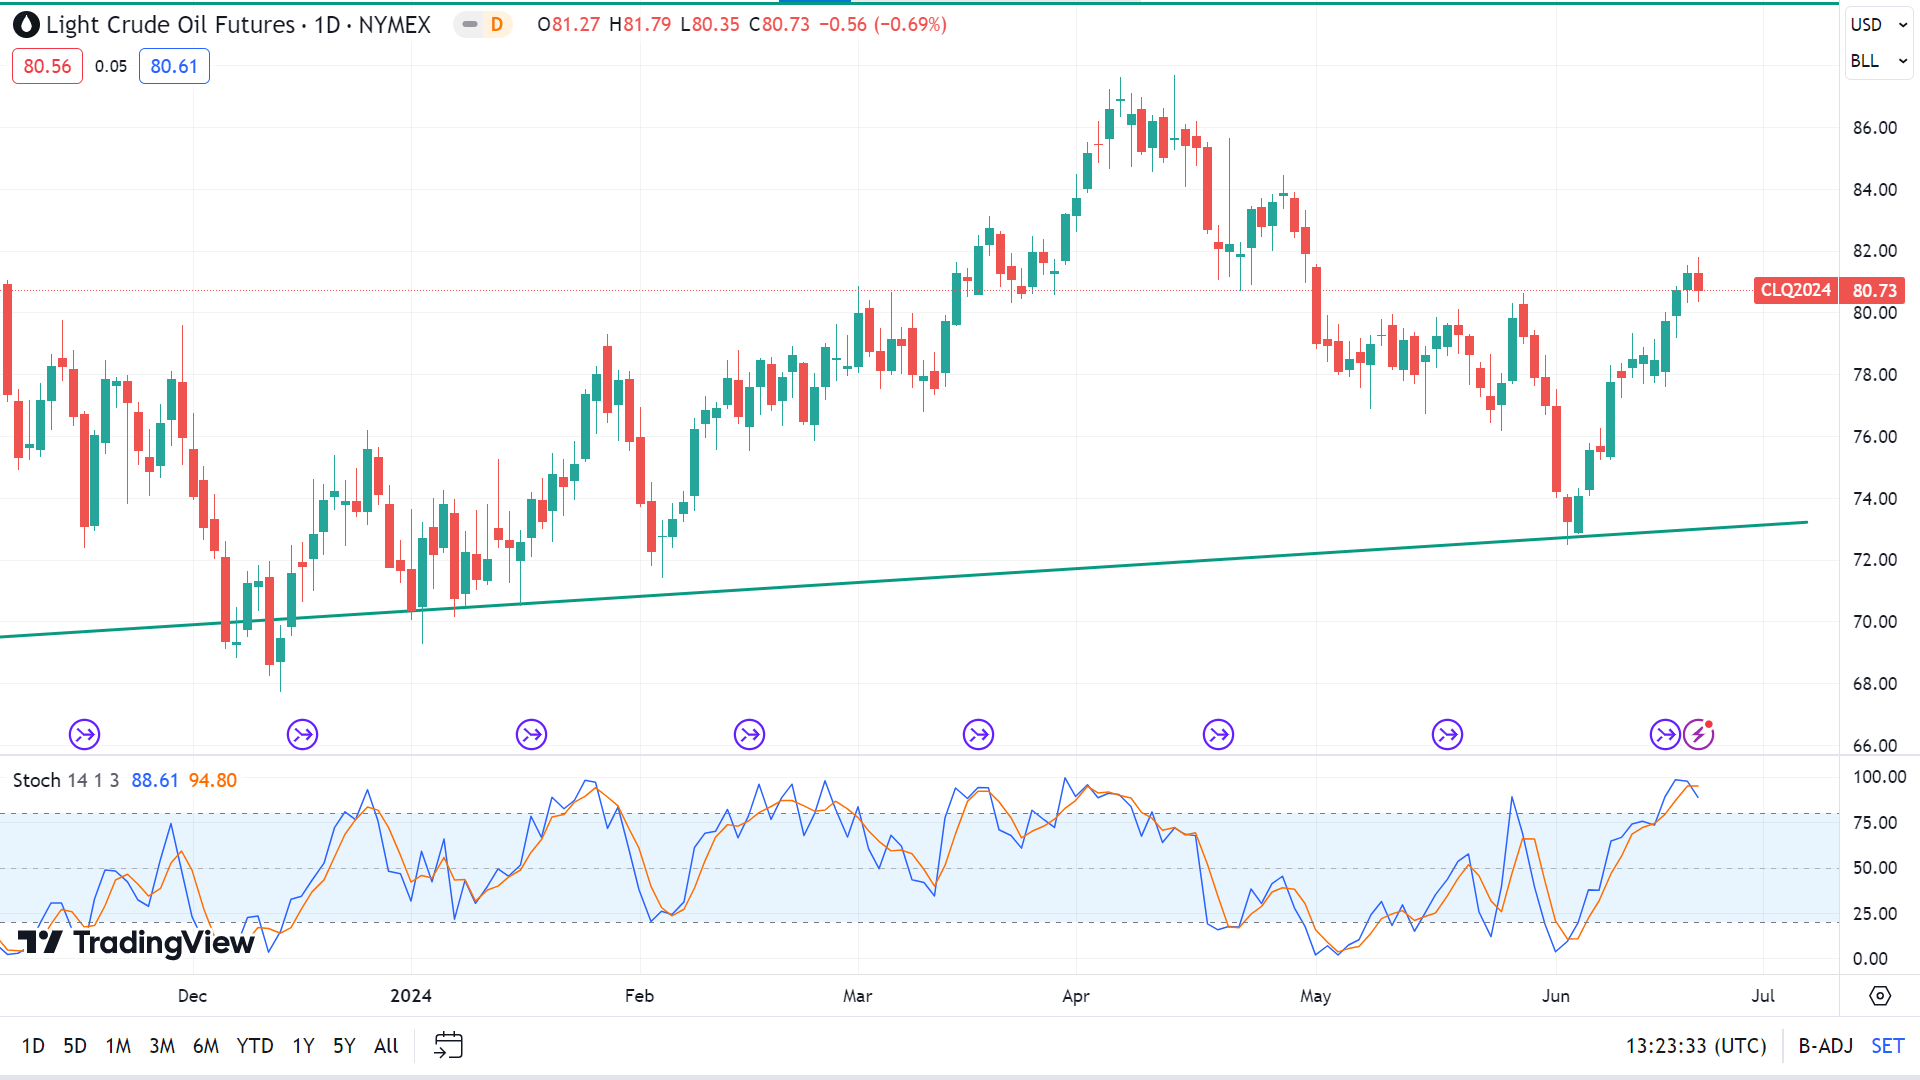
The Stochastic indicator reading remains neutral, and the signal lines remain overbought territory while making a bearish crossover. According to the indicator reading, the price can continue to increase toward the primary resistance of $83.91, followed by the next resistance near $87.33.
On the other hand, the signal lines can start to drop according to the crossover direction toward the nearest support of $77.81, followed by the next support near $75.30.


