EURUSD
Fundamental Perspective
The EURUSD pair closed the week on a downtrend, extending its two-week decline to around 1.12%. The euro faces pressure as investors anticipate significant announcements from the Federal Reserve (Fed) and the European Central Bank (ECB). The Fed's upcoming meeting on Wednesday is widely expected to keep interest rates steady. Still, market participants are keenly watching for any shifts in policy language that could signal future changes. Such guidance could have a profound impact on market sentiment and trading strategies.
In the Eurozone, attention is riveted on the release of the Harmonized Index of Consumer Prices (HICP) data scheduled for Wednesday. This report will provide crucial insights into potential ECB policy adjustments. July's year-over-year headline inflation is forecasted to ease to 2.3% from 2.5%, which might influence expectations regarding further ECB rate cuts. Meanwhile, the U.S. will also focus on the Nonfarm Payrolls (NFP) report, which will be released on Friday. This report will offer vital information about the health of the U.S. labor market and its potential impact on Fed policy decisions.
Despite rising inflationary pressures, market sentiment has shifted towards increased risk appetite, with many expecting a Fed rate cut in September. The CME's FedWatch Tool indicates a 100% probability of a rate cut, with some market players even anticipating a 50-basis-point reduction. However, this optimism will be tested by the forthcoming economic data, which will play a crucial role in determining the EUR/USD pair's trajectory. As traders navigate these uncertain waters, economic indicators and central bank actions will heavily influence their decisions, setting the stage for potential volatility.
Technical Perspective
The last weekly candle closed red after a doji candle with a long upper wick, reflecting fresh sell pressure, although buyers still have hope as the overall trend is bullish.
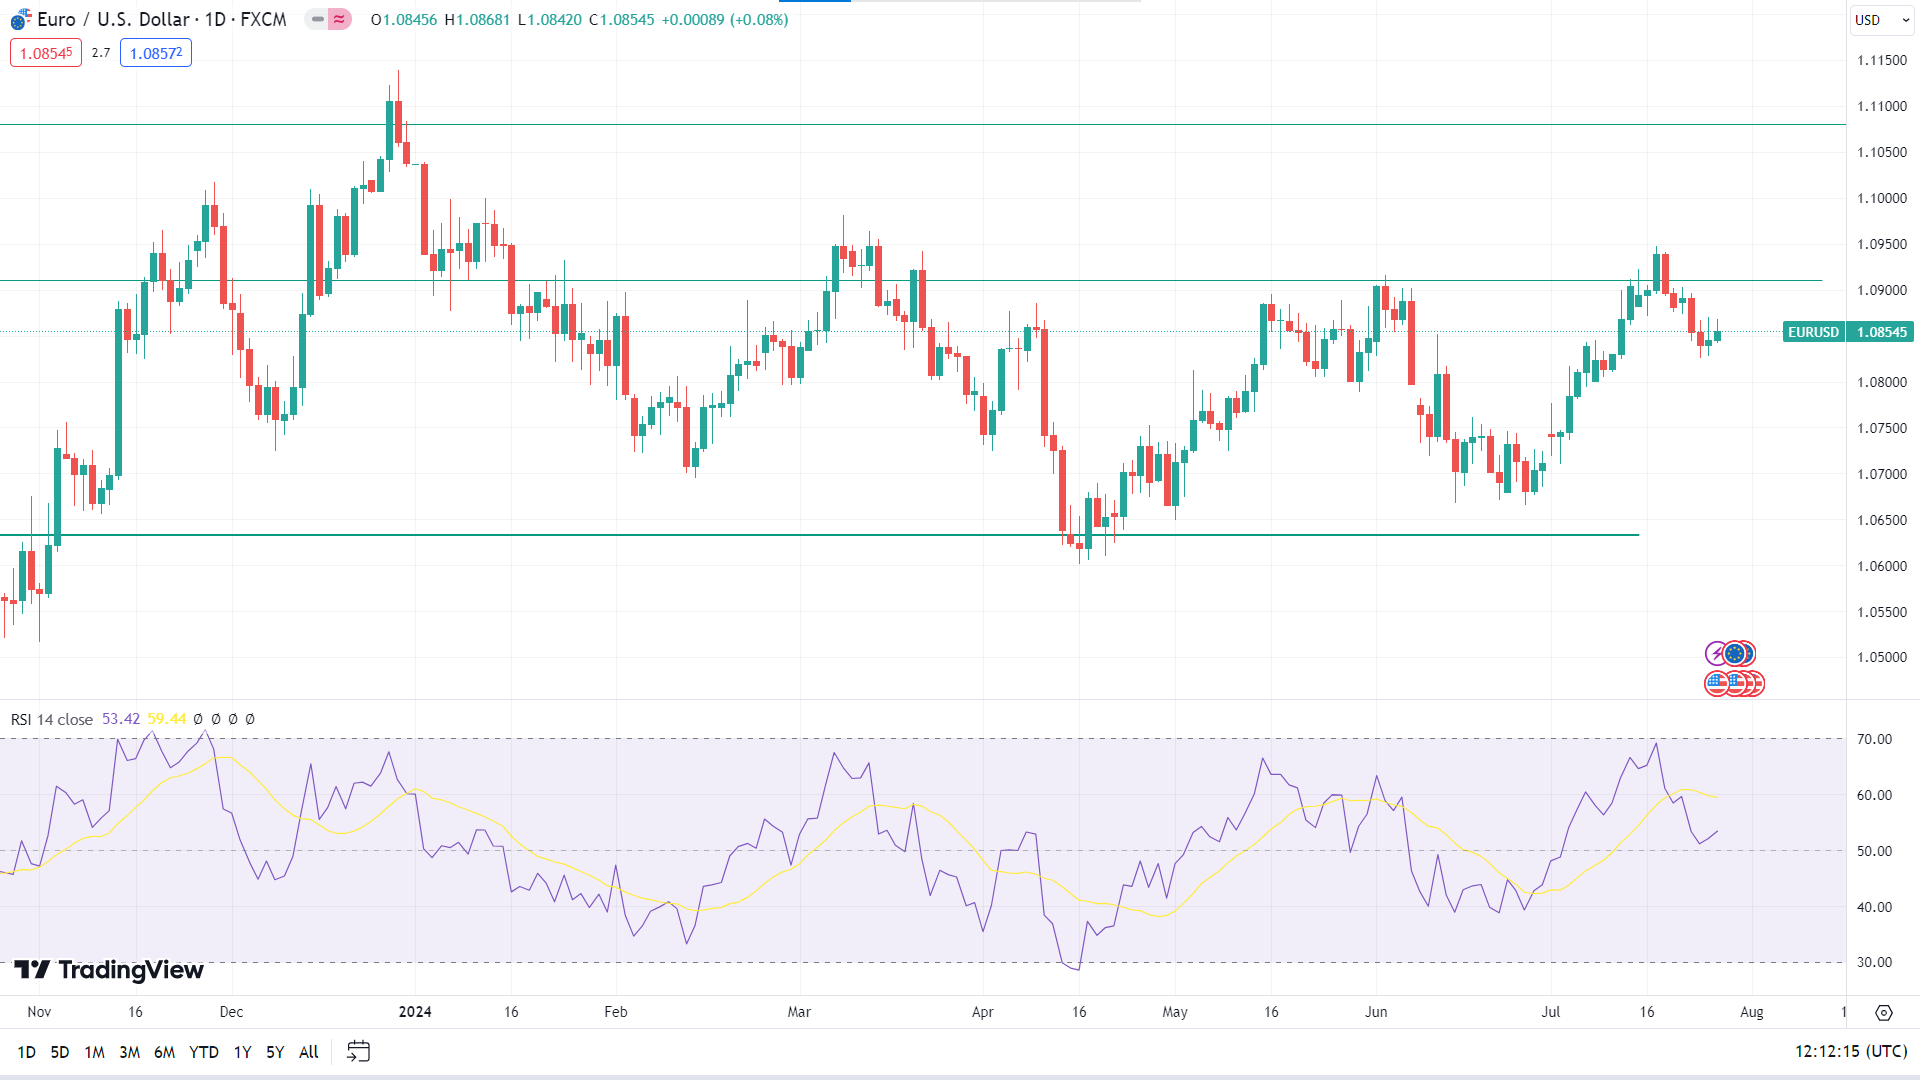
In the daily chart, the price is facing some resistance near 1.0946, breaking the previous peak of 1.0910. The RSI indicator reading remains neutral as the signal line floats above the midline of the indicator window, enabling room for the price to regain the recent peak of 1.0946. In this outlook, the next resistance level is at the 1.1080 level.
On the bearish side, the ongoing selling pressure can take the price toward the nearest support of 1.0746, followed by the next support near 1.0676.
GBPJPY
Fundamental Perspective
The yen faces a pivotal week as the Bank of Japan (BOJ) prepares for its meeting. There is a 68% chance of a minor rate hike. This potential increase is significant, given Japan's long-standing low-interest rate policy to stimulate growth. However, the real focus for traders will be the BOJ's stance on quantitative tightening as it looks to reduce its monthly asset purchases.
The BOJ purchases about 6 trillion yen in assets monthly, but there is speculation that this could be scaled back to 4.5 trillion yen, with a target of 2 trillion yen over the next two years. Market expectations vary, with some anticipating smaller cuts. Yet, the BOJ has a history of surprising the markets, and larger reductions might be forthcoming, aligning with recent comments from the BOJ governor about a sizable decrease in bond buying.
A BOJ's monetary policy shift could significantly impact the yen's value. If further rate hikes are signaled for October, the yen might strengthen, pushing the GBPJPY exchange rate down to around 190.00, which might align with Japanese authorities' preferences. This development would have wide-reaching implications for traders and investors, affecting not just currency trading but also stock and bond markets. Monitoring the BOJ's announcements and market reactions will be crucial for those involved in yen-related investments.
Technical Perspective
The last weekly candle was finished as a long red candle, posting three consecutive losing weeks. Considering the ongoing selling pressure, the price has a higher possibility of showing a downside continuation, depending on the BOJ's decision.
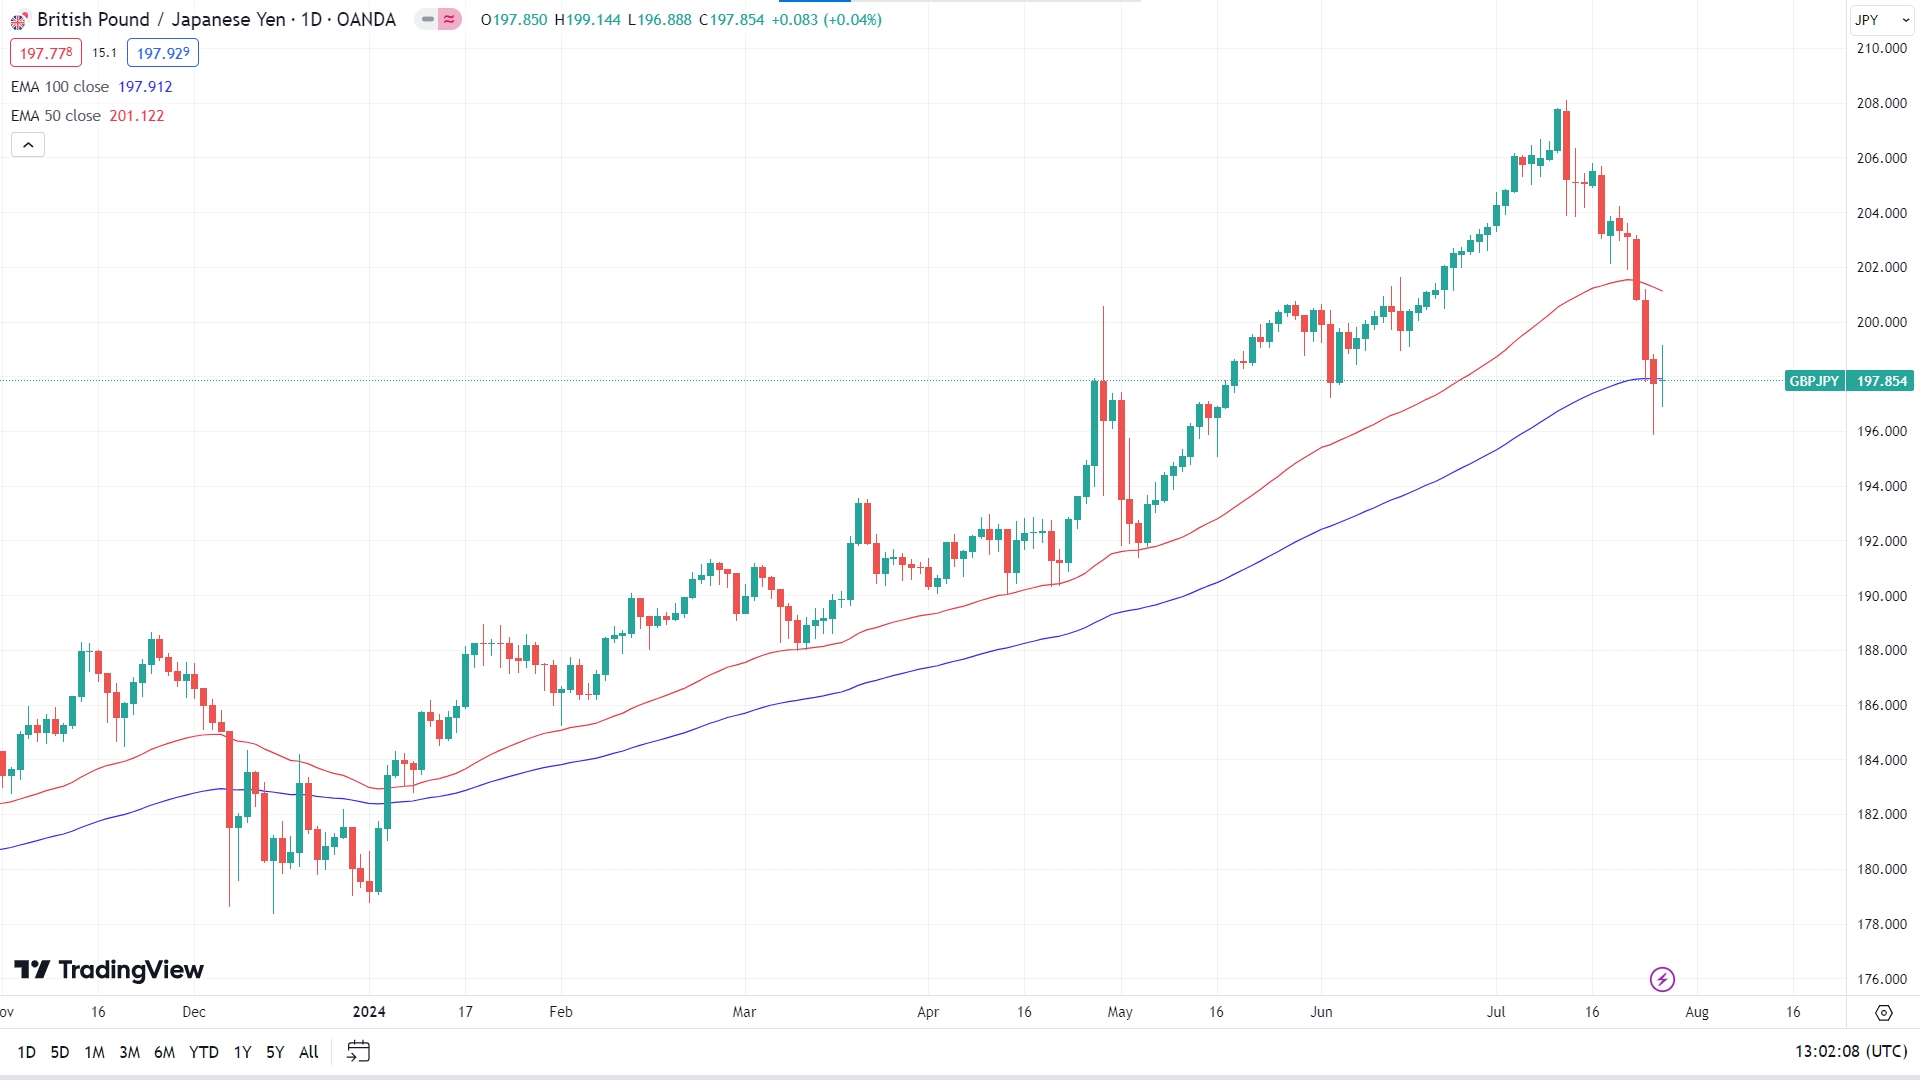
The price is floating at the EMA 100 line, whereas it is close below the EMA 50, reflecting recent sell pressure on the daily chart. On the bullish side, a valid recovery is needed above the EMA 100 line, which may hit the nearest resistance of 200.36, followed by the next resistance near 203.86.
Meanwhile, the price floating below the EMA 100 line may cause the price to head to the primary support of 195.86, followed by the next support near 193.87.
NASDAQ 100 (NAS100)
Fundamental Perspective
Despite a U.S. rate cut for September being widely anticipated, stock markets have recently sold off sharply, indicating that merely confirming this cut at the upcoming Federal Reserve meeting might not be enough to reassure investors. The Fed may express deep concern over recent labor market trends and suggest that the U.S. economy requires a significantly lower terminal rate. Such a signal could prompt the equity market, especially tech stocks, to recover after recent declines. Notably, the drop in 10-year Treasury yields and expectations of Fed rate cuts have fueled a recovery in mid-cap and value stocks, with the Russell 2000 outperforming the "Magnificent 7" mega-cap tech stocks.
The Fed might choose to cut rates at this week's meeting to avoid accusations of political bias. However, the probability of such a move is low, with only a 4.5% chance priced in by the market. Therefore, the Fed is expected to maintain its current stance and emphasize its data-dependent approach to monetary policy.
The market anticipates that the U.S. economy will add 175,000 jobs in July, down from 206,000 in June. Even if payrolls exceed expectations, the household survey measuring unemployment consistently shows weaker results than the establishment survey informing the NFP report. Consequently, unless there is an unexpected drop in the unemployment rate, the Fed will likely implement a rate cut in September and may continue cutting rates at each meeting through the end of the year.
In the Nasdaq-100 economic calendar, some crucial releases are from Apple Inc (AAPL), Microsoft Inc (MSFT), Amazon.com Inc (AMZN), Meta Platform Inc (META) and Exxon Mobil Corp ((XOM).
Technical Perspective
The latest weekly candle closed solid red, posting three consecutive losing weeks, reflecting possibilities that the next candle could be a bearish one.
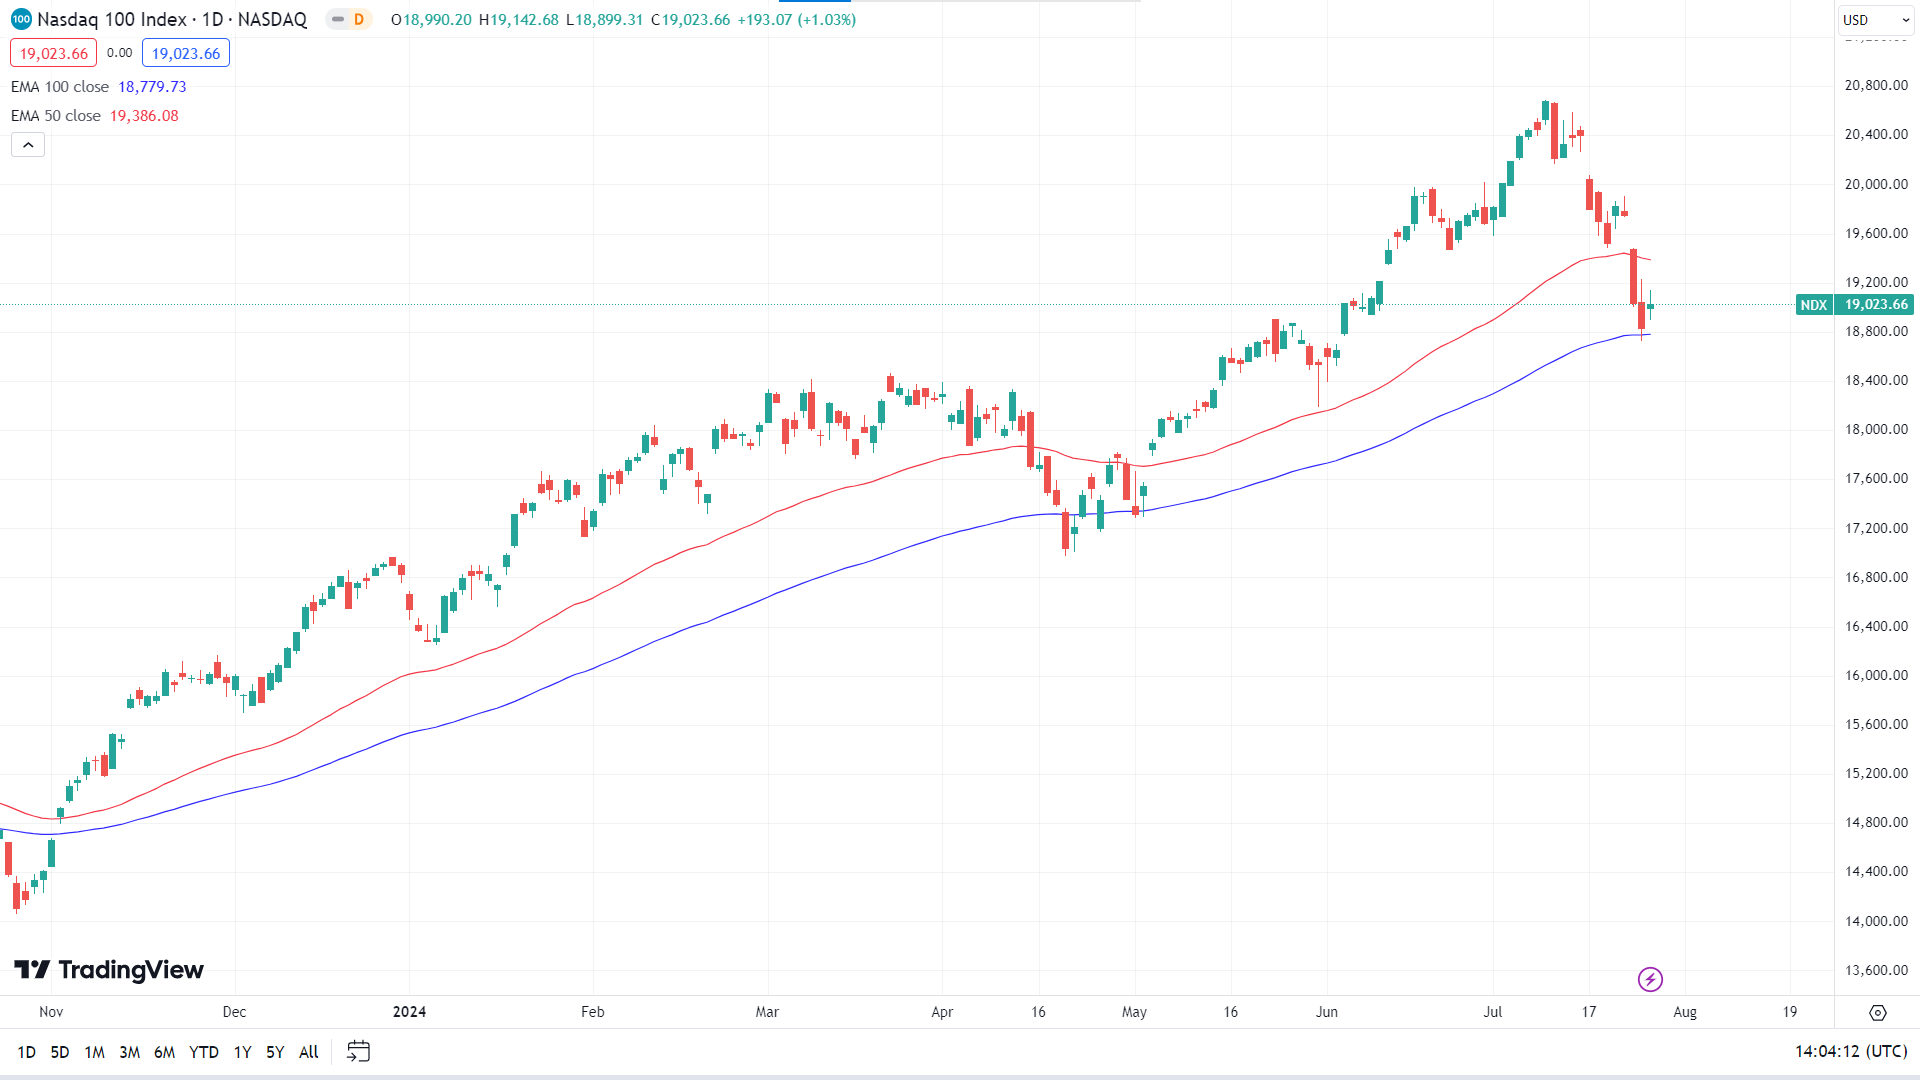
The price is floating between the EMA 100 and EMA 50 lines on the daily chart, where the EMA 100 line acts as a dynamic support level and the EMA 50 line acts as a dynamic resistance. In this context, a bullish rebound with a daily close above the EMA 50 line could hit the primary resistance of 19,899.76, followed by the next resistance of 20,477.49.
On the downside, if the price declines below the EMA 100 line, it can find the primary support at 18,337.23, followed by the next support of 17,339.32.
S&P 500 (SPX500)
Fundamental Perspective
Major Wall Street indexes ended higher last Friday as investors returned to tech megacaps, which had sparked sell-offs earlier in the week. This shift was fueled by inflation data that increased optimism about potential Fed interest rate cuts. Despite the gains, the Nasdaq Composite and the S&P 500 could not fully recover from earlier losses, marking their second consecutive declining week.
The market's immediate outlook may depend on the upcoming earnings reports from other Magnificent Seven companies. A moderate increase in June U.S. prices suggested cooling inflation, which supported small caps on Friday and potentially positioned the Federal Reserve to policy easing in September. Following the PCE reading, bets on a 25-basis-point rate cut in September remained steady at 88%, with traders anticipating two rate cuts by December, according to LSEG data.
Technical Perspective
The last weekly candle finished red, posting two consecutive losing weeks, leaving optimism for sellers for the next week.
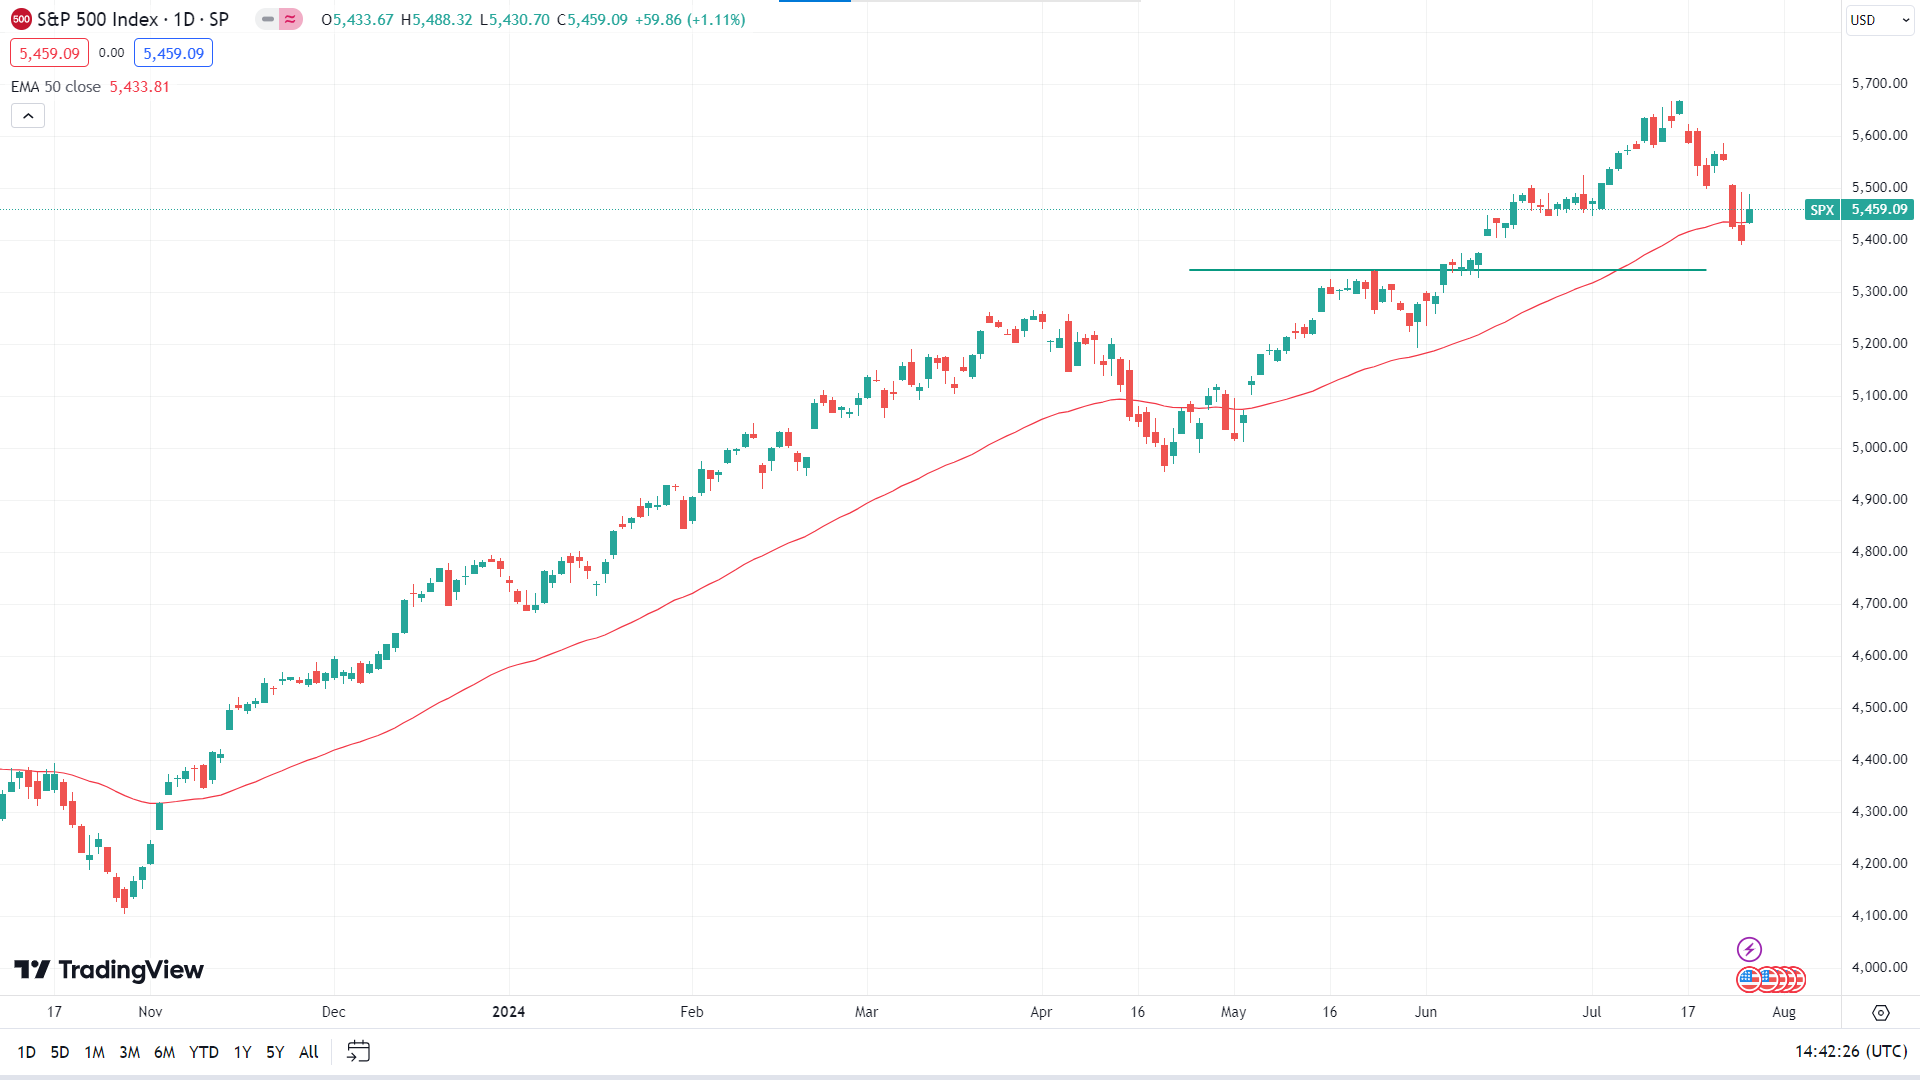
The price is floating above the EMA 50 line on the daily chart, signaling that buyers are still in play. It can reach the primary resistance of 5553.41, followed by the next resistance near 5669.67.
On the other hand, if the price drops below the EMA 50 line, it can hit the nearest support level of 5340.17, followed by the next support near 5238.80.
Gold (XAUUSD)
Fundamental Perspective
After a slight decline the previous week, Gold (XAUUSD) extended its drop, reaching a two-week low near 2,350.00 level amid concerns over diminishing demand. With the Federal Reserve poised to announce monetary policy decisions next week and crucial U.S. economic data upcoming, the direction of XAUUSD could soon become more apparent.
Gold struggled to gain traction due to a bleak demand outlook. The People's Bank of China (PBoC) announced that it had lowered the one-year and five-year Loan Prime Rates (LPR) and the interest rate for the 7-day reverse repo. These measures from China, the world's largest gold consumer, contributed to Gold's struggle to recover.
Gold managed a technical correction and stabilized near 2,400.00 on Tuesday but faced renewed bearish pressure after the PBoC cut the one-year Medium-term Lending Facility (MLF) rate on Thursday, which, combined with strong U.S. economic data, pushed Gold below the 2,400 level, touching its lowest level in two weeks.
The market is now focused on the Fed's upcoming policy decision. With bets on a 25-basis-point rate cut in September holding steady at 88% and potential further cuts by year-end, Powell's comments could significantly impact Gold's trajectory. July's Nonfarm Payrolls and the ISM Manufacturing PMI will also considerably shape market expectations.
Technical Perspective
The last weekly candle closed red after a hammer with a red body and long upper wick, confirming the sellers' activities and leaving optimism that the upcoming price direction could be bearish.
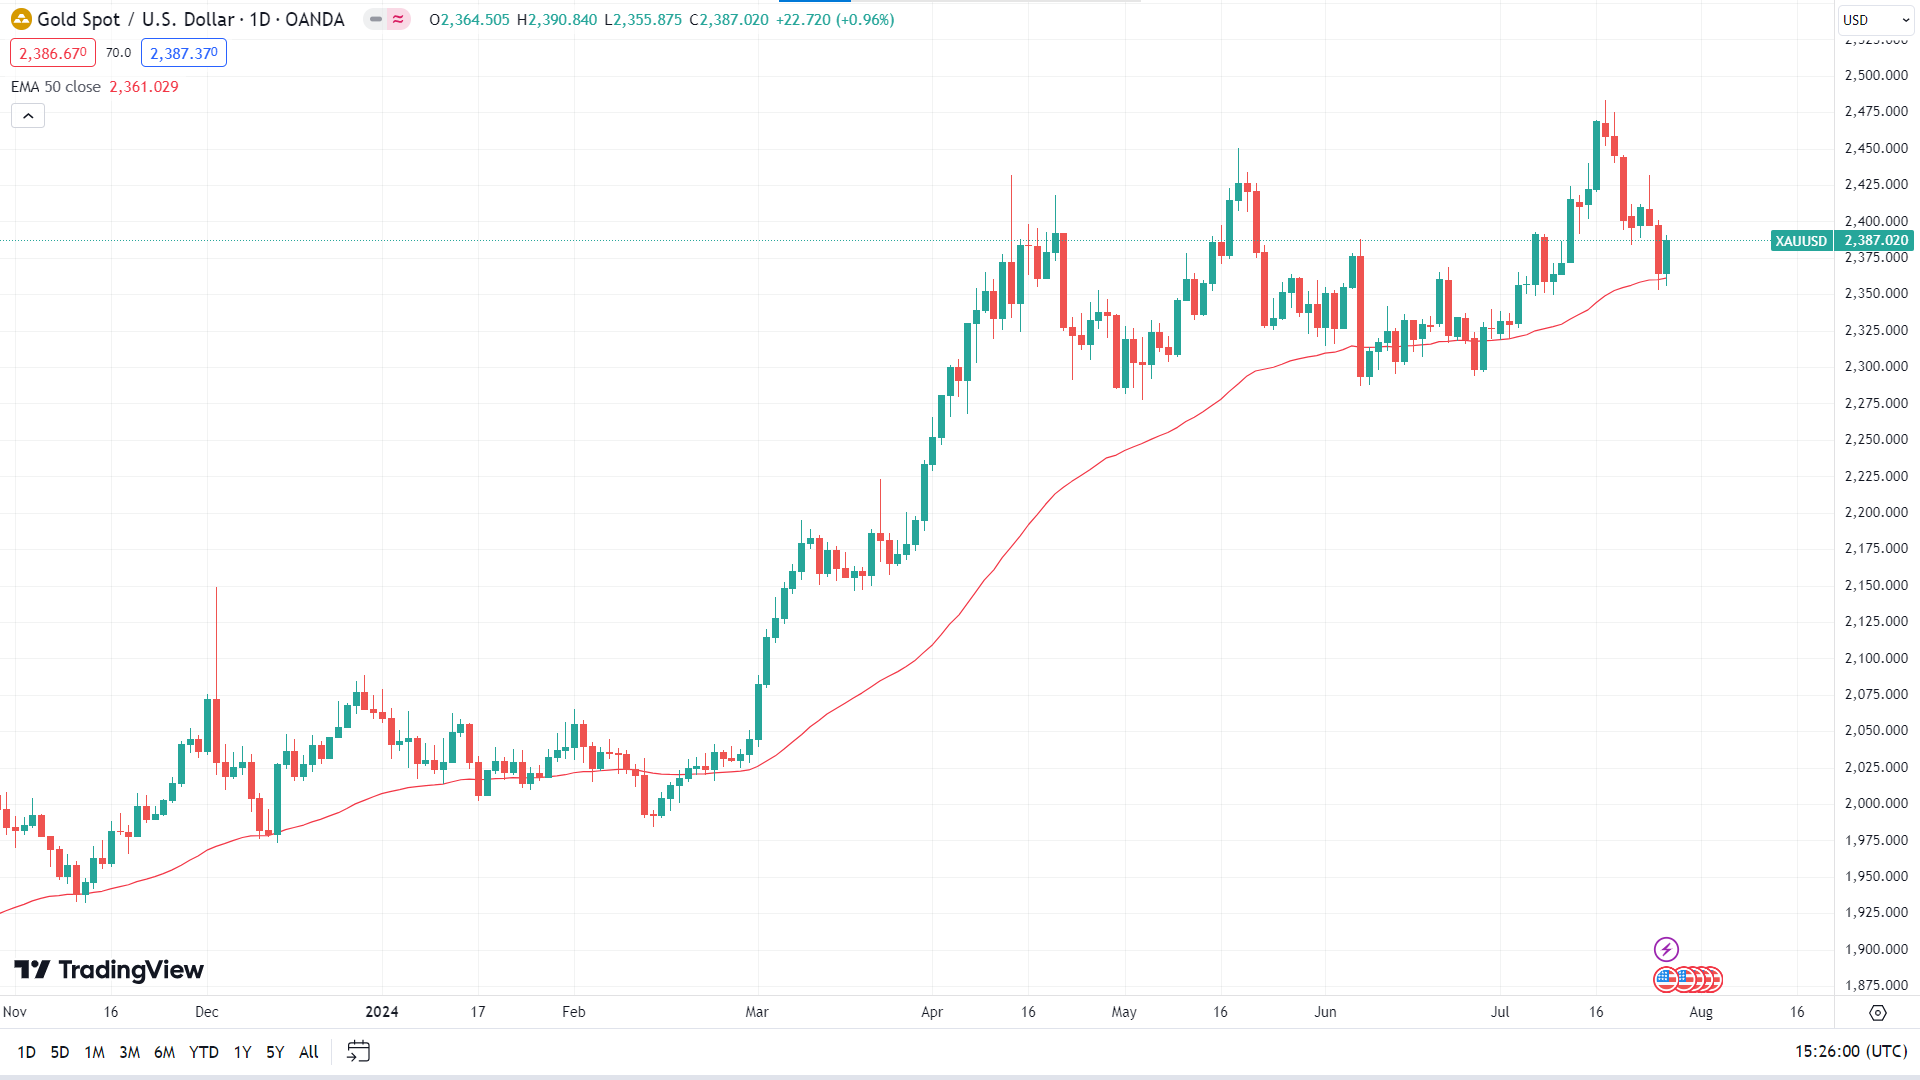
After reaching the ATH of $2483.74, the price declined toward the EMA 50 line and bounced back on the daily chart. Considering the bullish rebound from reliable support, the price may regain the recent peak of 2483.74 or above in the upcoming days. On the bullish side, the next resistance is near 2535.68.
On the other hand, if the price declines below the EMA 50 line again, it can drop to the primary support level of 2321.78, followed by the next support near 2280.53.
Bitcoin (BTCUSD)
Fundamental Perspective
Bitcoin (BTC) rebounded to $67,000 from the support of $63,500 the previous day. Despite this recovery, Bitcoin ended the week with a loss of over 1.50%, which created market unease and possibly contributed to the cryptocurrency's decline. Meanwhile, U.S. spot Bitcoin ETFs saw inflows this week, coinciding with Donald Trump's scheduled speech at the Bitcoin Conference on Saturday, which Vice President Kamala Harris will not attend.
Mt. Gox's Bitcoin balance declined from 90,000 to 80,000 BTC last week, with their holdings shrinking to $5.2 billion from $6.2 billion, per Akram Intelligence. This steady transfer of BTC to exchanges for creditor reimbursement has likely triggered fear, uncertainty, and doubt (FUD) among traders, applying additional weight to Bitcoin's price.
Coinglass data indicates that this week, U.S. spot Bitcoin ETFs had one day of outflows and three days of inflows, totaling net inflows of $480.30 million. These positive net inflows suggest growing investor confidence and could signal a short-term Bitcoin price increase. As of Thursday, the combined Bitcoin reserves held by these 11 U.S. spot Bitcoin ETFs amounted to $52.14 billion. Monitoring these inflows is significant for understanding market dynamics and investor sentiment, as they reflect potential shifts in the market's Bitcoin outlook.
Technical Perspective
The last weekly candle closed as a doji with a small green body and long lower wick after two solid green candles. It posted three consecutive gaining weeks, leaving optimism for the upcoming days.
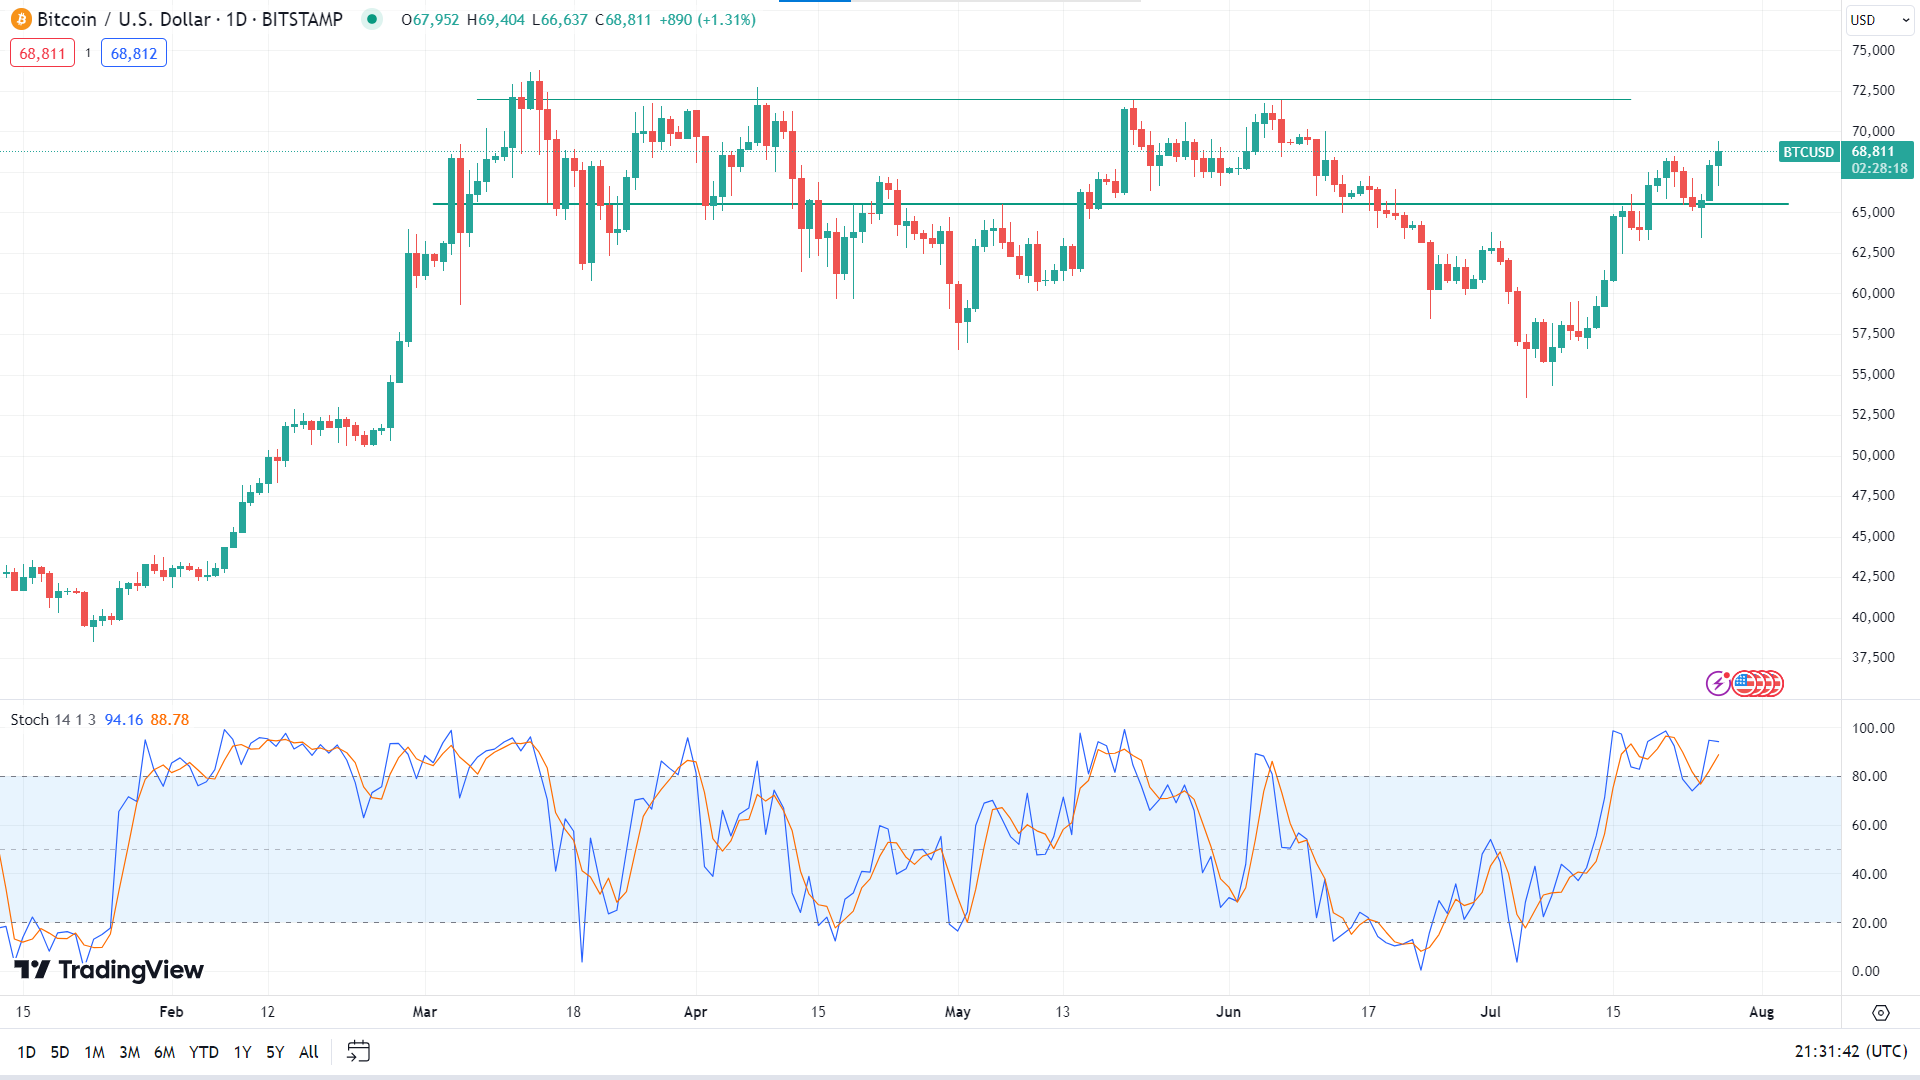
The asset has sufficient buy pressure on the daily chart, as the Stochastic indicator window shows through its signal line above the upper line. The price may head toward the nearest resistance, near 71,543. The following resistance is near 72,794.
Meanwhile, if the signal lines on the Stochastic indicator window decline below the upper line and slope downside, the price can retouch the nearest support near 65,500, followed by the next support near 62,796.
Ethereum (ETHUSD)
Fundamental Perspective
Ethereum spot exchange-traded funds (ETFs) recently began trading in the U.S., yet the introduction has not positively impacted Ethereum's price. Over the past week, Ethereum (ETH) has dropped by 8.2% since these ETFs launched, leading investors to speculate when the new funds might boost Ethereum's price by increasing buying activity and reducing supply. Analysts and crypto experts suggest it could take some time before these ETFs significantly influence the market.
Analysts can anticipate potential outcomes for Ethereum by drawing parallels to Bitcoin's experience with spot ETFs. When Bitcoin ETFs were introduced, Bitcoin was priced at $46,000 but fell below $39,000 within two weeks. However, over the subsequent two months, Bitcoin surged to $73,000 as record inflows pushed it into price discovery mode, illustrating how ETF activity can eventually drive significant price movements.
A blockchain analytics platform, Lookonchain, declares an Ethereum Foundation-related wallet recently transferred 92,500 ETH to a new wallet valued at approximately $294.9 million. The wallet had been inactive for over six years and drew significant attention. On-chain tracking revealed that this Ethereum stash was initially received from the Ethereum Foundation on September 1, 2015, a crucial moment in Ethereum's history, as it had only launched about a month earlier, on July 30, 2015.
Technical Perspective
The last weekly candle closed red after two solid green candles reflecting fresh selling pressure.
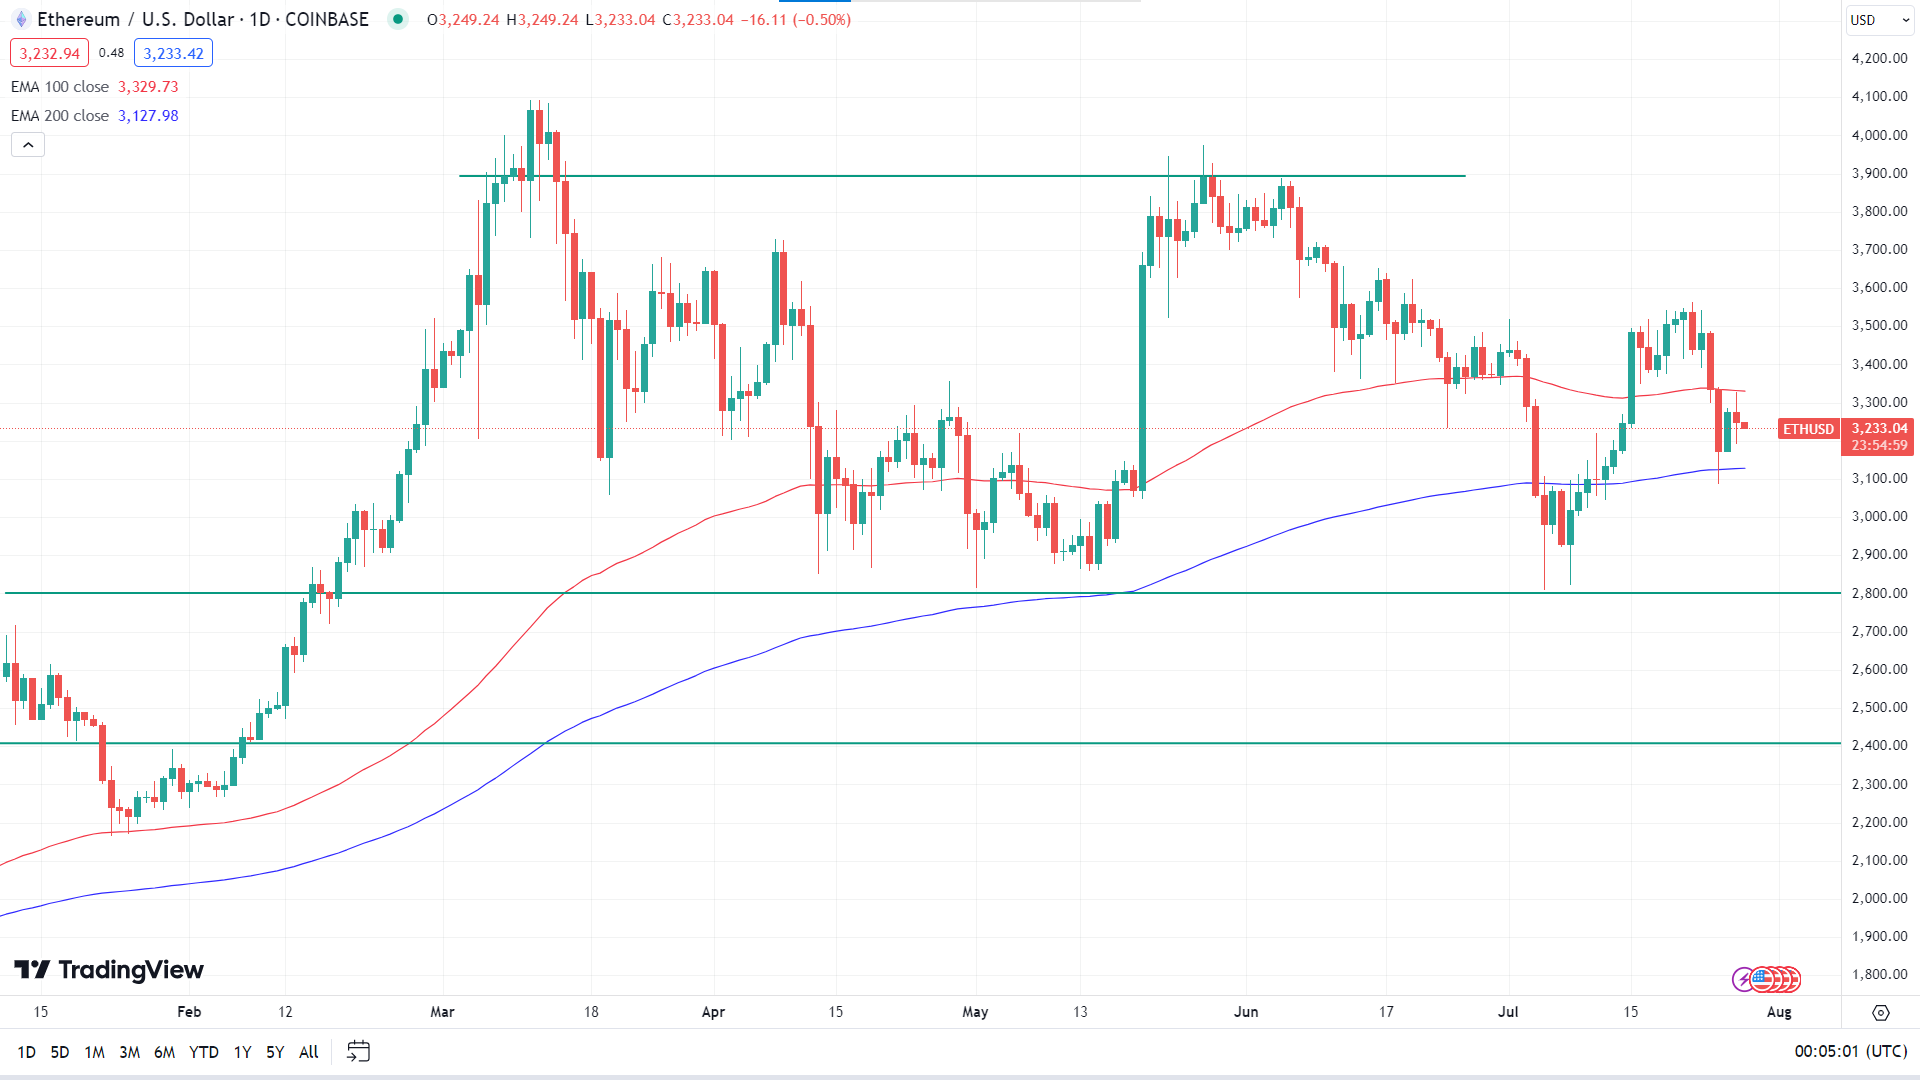
The price is floating between the EMA 100 and EMA 200 lines, where the EMA 200 line acts as dynamic support and the EMA 100 line acts as dynamic resistance. If the price exceeds the EMA 100 line, it can hit the primary resistance of 3538.64, followed by the next resistance near 3856.52.
Meanwhile, if the price declines below the EMA 200 line, it will indicate significant bearish pressure, which can trigger the price toward the primary support near 3010.29, followed by the next support near 2847.06.
Nvidia Stock (NVDA)
Fundamental Perspective
Nvidia introduced its AI Foundry service, designed to support Meta's (META) Llama 3.1, which allows developers to create large language models using open-source tools. In June, Nvidia announced plans to launch its most advanced AI platform in 2026, featuring next-generation memory to enhance processing speed.
Despite competition from Google's tensor processing units, Nvidia continues to dominate the data center AI chip market. Although analysts have raised their price targets for Nvidia, the stock holds an Accumulation/Distribution Rating of D+, indicating limited buying interest from mutual funds. Nvidia remains a trailblazer in AI technology, with its chips widely used across industries such as healthcare and robotics, highlighting its pivotal role in technological innovation.
Technical Perspective
The last weekly candle finished red, posting two consecutive losing weeks, reflecting seller activities, indicating the next candle might be a bearish one.
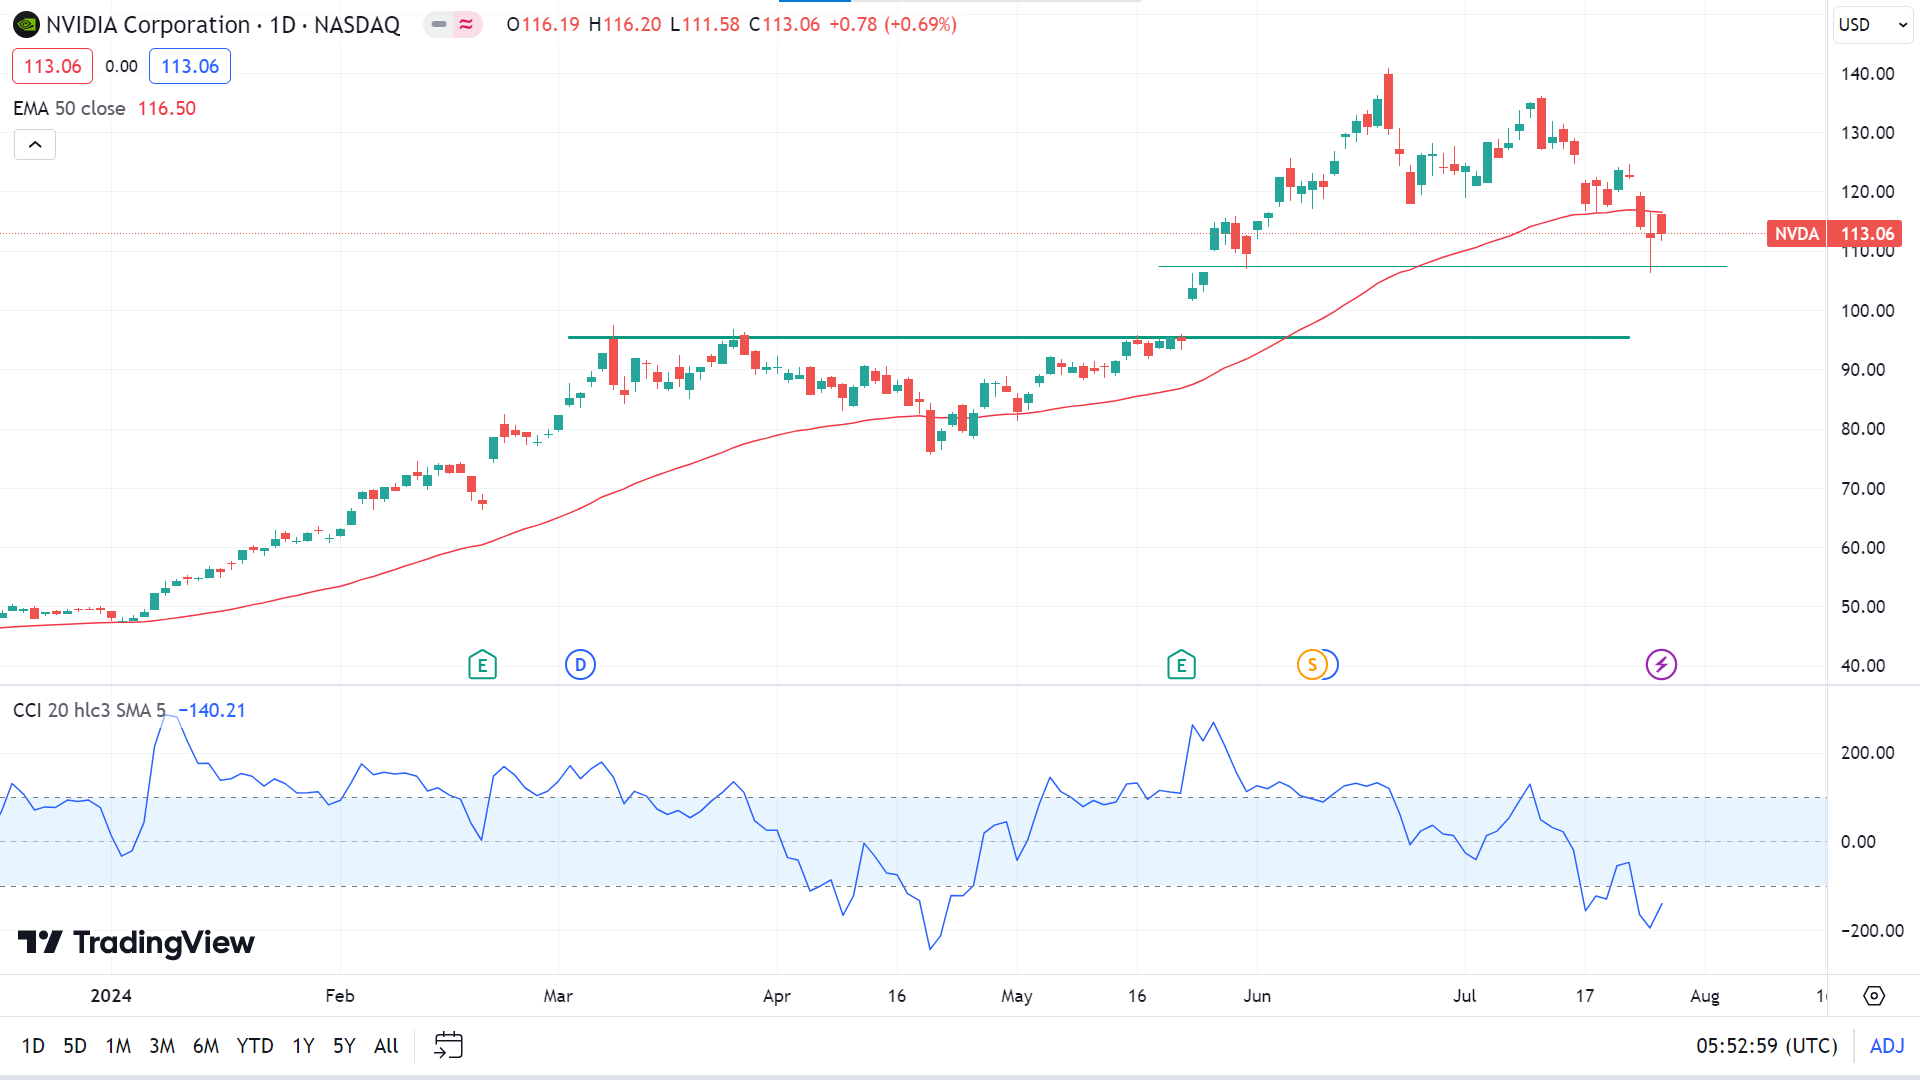
The NVDA stock price is floating below the EMA 50 line on the daily chart, supporting the current bearish pressure, whereas the CCI indicator suggests buyers' activities. According to the CCI indicator, if the bullish pressure keeps increasing, the price may hit the primary resistance of 120.30, surpassing the EMA 50 line, followed by the next resistance near 125.47.
Meanwhile, if the price remains below the EMA 50 line, it can reach the nearest support at around 107.38, followed by the next support near 100.40.
Tesla Stock (TSLA)
Fundamental Perspective
Tesla (TSLA) received its fourth downgrade to a sell rating last Friday following a disappointing report of a more than 40% drop in second-quarter earnings. Although the company's revenue surpassed expectations due to a surge in regulatory credits, TSLA shares declined slightly on Friday.
Jonathan Woo, an analyst at Phillip Securities, downgraded Tesla from a sell rating to a reduced rating and cut his price target from 145 to 135. Woo highlighted concerns about narrowing margins amid soft pricing and European Union tariffs on Chinese exports. He also criticized Tesla's management, particularly CEO Elon Musk, for failing to address these issues adequately during the earnings call.
Woo expressed doubt about Tesla's focus on ambitious projects like the robotaxi and Optimus robot, which he believes are still 3-5 years away from making a meaningful impact on the company's growth.
The downgrade followed others from KGI Securities and New Street, which issued neutral ratings with price targets of 236 and 225, respectively. Cantor Fitzgerald had downgraded Tesla to neutral earlier in the week, citing a more conservative valuation after TSLA shares surged over 70% in the last three months. Despite achieving record quarterly revenues, Tesla's gross margins fell, with auto margins excluding regulatory credits falling below expectations.
Technical Perspective
On the weekly chart, the last candle closed red, posting two consecutive losing weeks after a doji candle, which suggests that the next candle might be another red one.
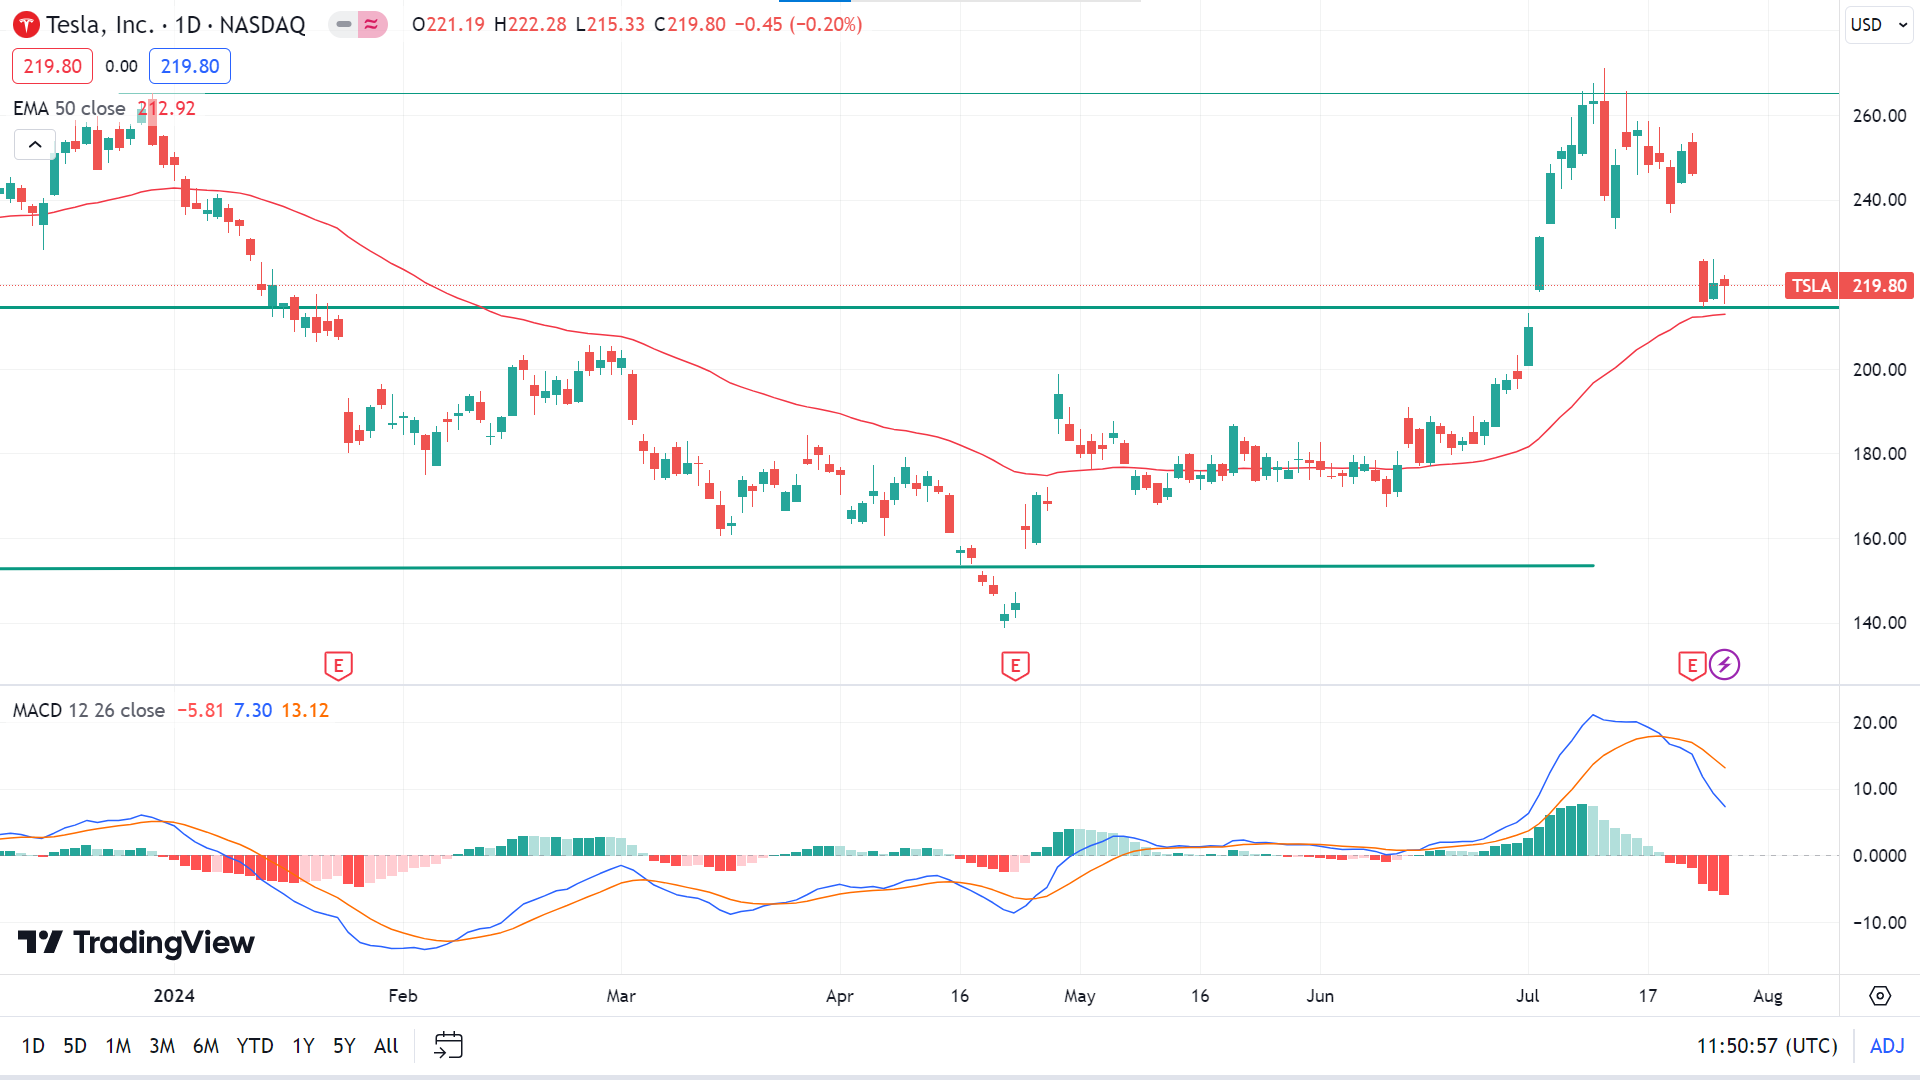
On the daily chart, the TSLA stock price is floating above the EMA 50 line, declaring positive price pressure on the asset. Meanwhile, the MACD indicator window shows sell pressure on the asset. If the price stays above the EMA 50 line, it can hit the primary resistance of 234.69, followed by the next resistance near 265.13.
Meanwhile, according to the MACD indicator reading, if the price drops below the EMA 50 line, it can reach the nearest support of 202.39, followed by the next support near 182.19.
WTI Crude Oil (USOUSD)
Fundamental Perspective
Crude oil prices declined on Friday, reflecting persistent concerns over sluggish global economic growth and political uncertainty in the U.S. Additionally, there are long-term worries about OPEC's intentions to ease its production cuts in the coming quarters. These factors overshadowed mid-week gains driven by a bullish EIA report and Russia's promise of additional production cuts.
Russia announced plans on Wednesday to implement further crude production cuts in October and November 2024 and from March to September 2025. This move aims to counteract its recent overproduction, and Russia confirmed that July's output would meet its OPEC+ quota, providing some support for oil prices.
Gasoline prices remained buoyant due to the closure of Exxon's Chicago-area refinery after a tornado disrupted operations on July 15. Although the refinery regained power on July 23, it remains closed for repairs, with no reopening date announced. Additionally, Canadian wildfires threatened to disrupt nearly 500,000 barrels of crude oil sands output per day, further supporting prices.
Meanwhile, OPEC+'s plan to gradually restore crude production from October raised fears of a global supply glut. Concerns about the Hamas-Israel conflict and potential regional escalations, along with attacks on commercial shipping in the Red Sea, continued to threaten global crude supplies, adding an element of geopolitical risk to the oil market.
Technical Perspective
The last weekly candle finished red, posting three consecutive losing weeks, leaving optimism for sellers for the next week.
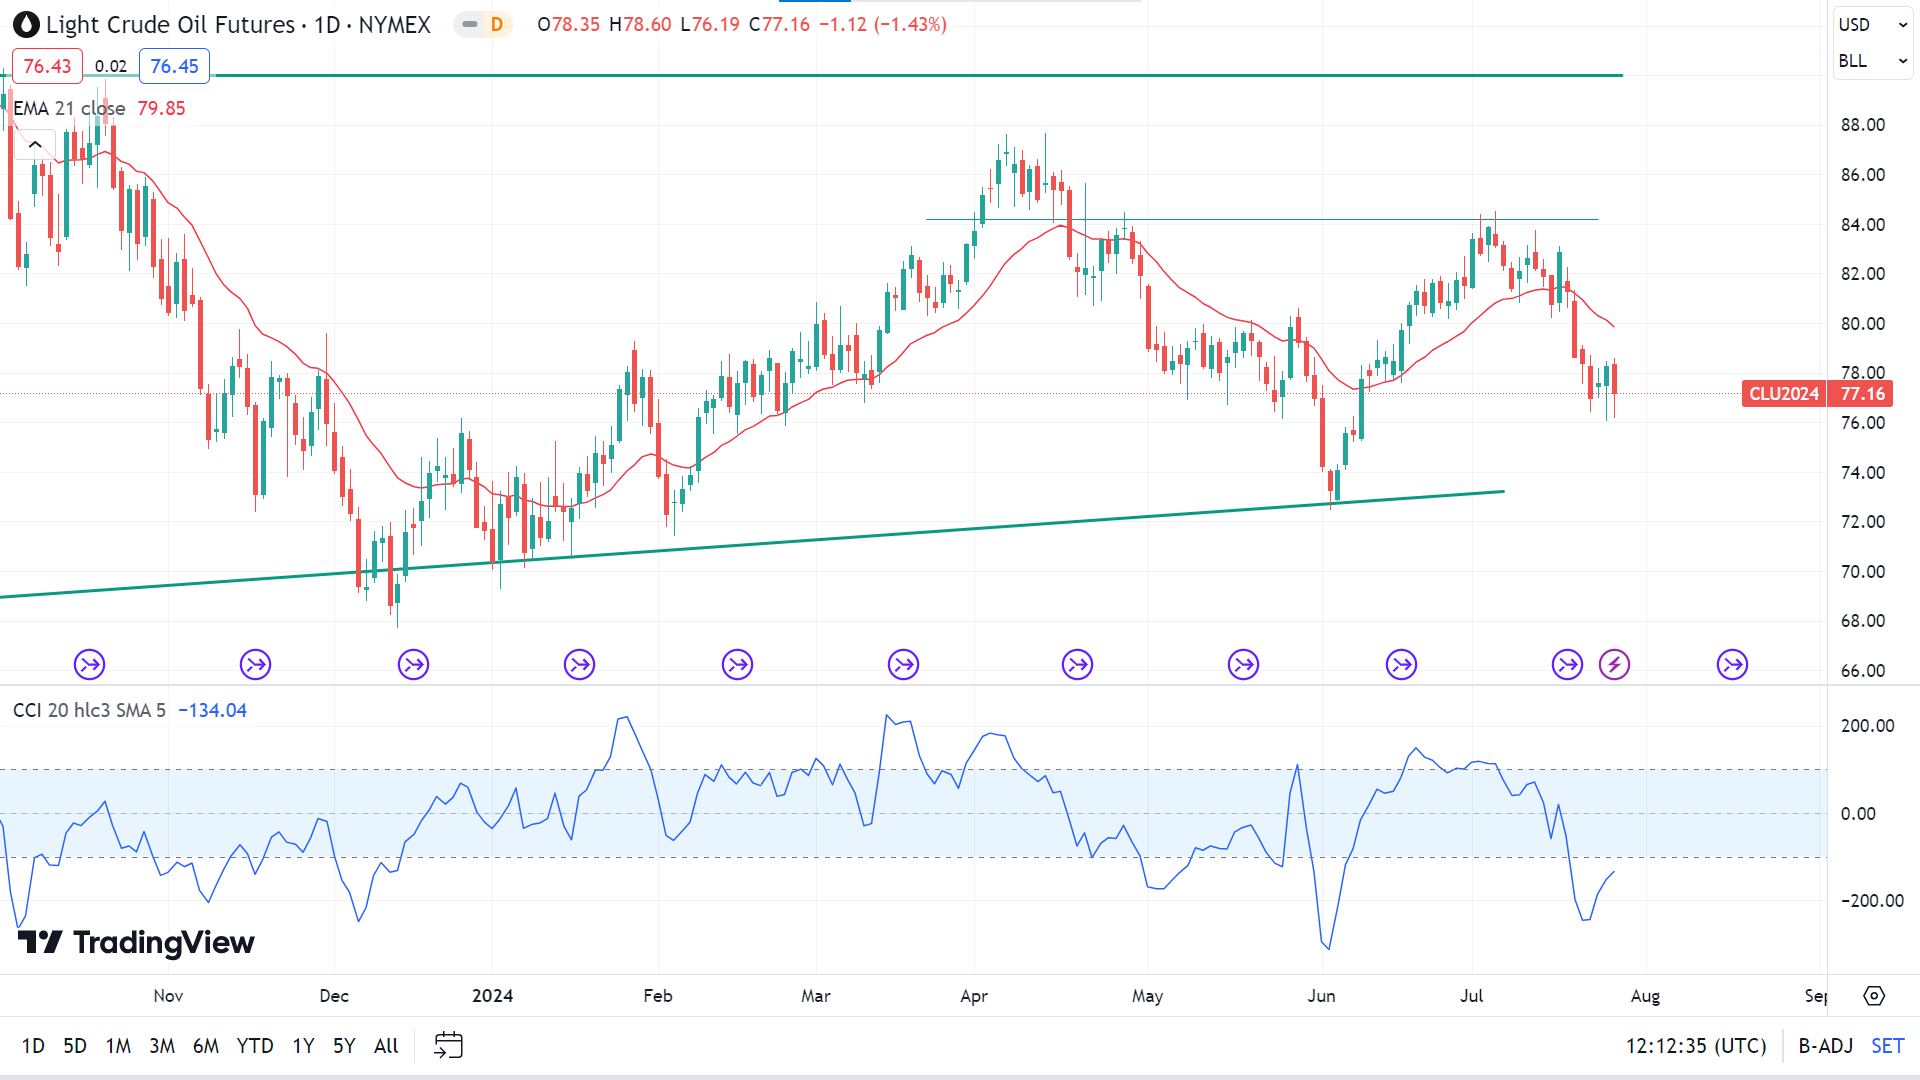
The price below the EMA 21 line on the daily chart supports the recent bearish pressure, while the CCI indicator suggests some fresh bullish pressure. So, the price can reach the nearest support of 75.82, followed by the next support near 73.13, according to the EMA 21 reading.
However, as the CCI indicator suggests, with increasing bullish pressure, the price can reach the primary resistance near 79.85 (EMA 21), and any breakout can trigger the price toward the next resistance near 83.06.


