
EURUSD
Fundamental Perspective
The EURUSD pair traded steadily around 1.0700 throughout the week, showing little reaction even after releasing the US Personal Consumption Expenditures (PCE) Price Index. The Federal Reserve's preferred inflation gauge met expectations, with the annual rate dipping to 2.6% in May from 2.7% in April and the monthly reading hitting the forecast of 0.0%. Core annual inflation was 2.6%, while the monthly core PCE Price Index increased by 0.1%. Although these figures initially caused the US Dollar to lose some ground, it quickly regained stability at around 1.0700 against the Euro.
Market sentiment leaned towards caution due to political uncertainties in the Eurozone, notably in France, ahead of upcoming snap elections. The Federal Reserve's hawkish stance contrasted sharply with the more dovish approaches of the European Central Bank (ECB) and the Bank of Canada, both of which have started easing monetary policies. The Fed seems determined to delay interest rate cuts, with recent comments suggesting only one 25 basis points cut this year. Meanwhile, Germany's economic data, including a contraction in the IFO Business Climate Survey and declining consumer confidence, further limited the Euro's appeal.
Across the Atlantic, the US economy showed resilience, with GDP growth for the first quarter slightly exceeding initial estimates at an annualized rate of 1.4% and Durable Goods Orders increasing by 0.1% in May. As markets await significant data releases next week, including Germany and Eurozone inflation figures and various US employment reports, the insights from Fed and ECB leaders at the ECB Forum on Central Banking will be crucial. These developments are poised to offer further direction for the EUR/USD pair, which has remained within familiar levels amidst the ongoing macroeconomic uncertainties.
EURUSD Forecast Technical Perspective
The last weekly candle closed green after three consecutive losing weeks, reflecting bulls may get back at this place, indicating the next candle might be another green one.
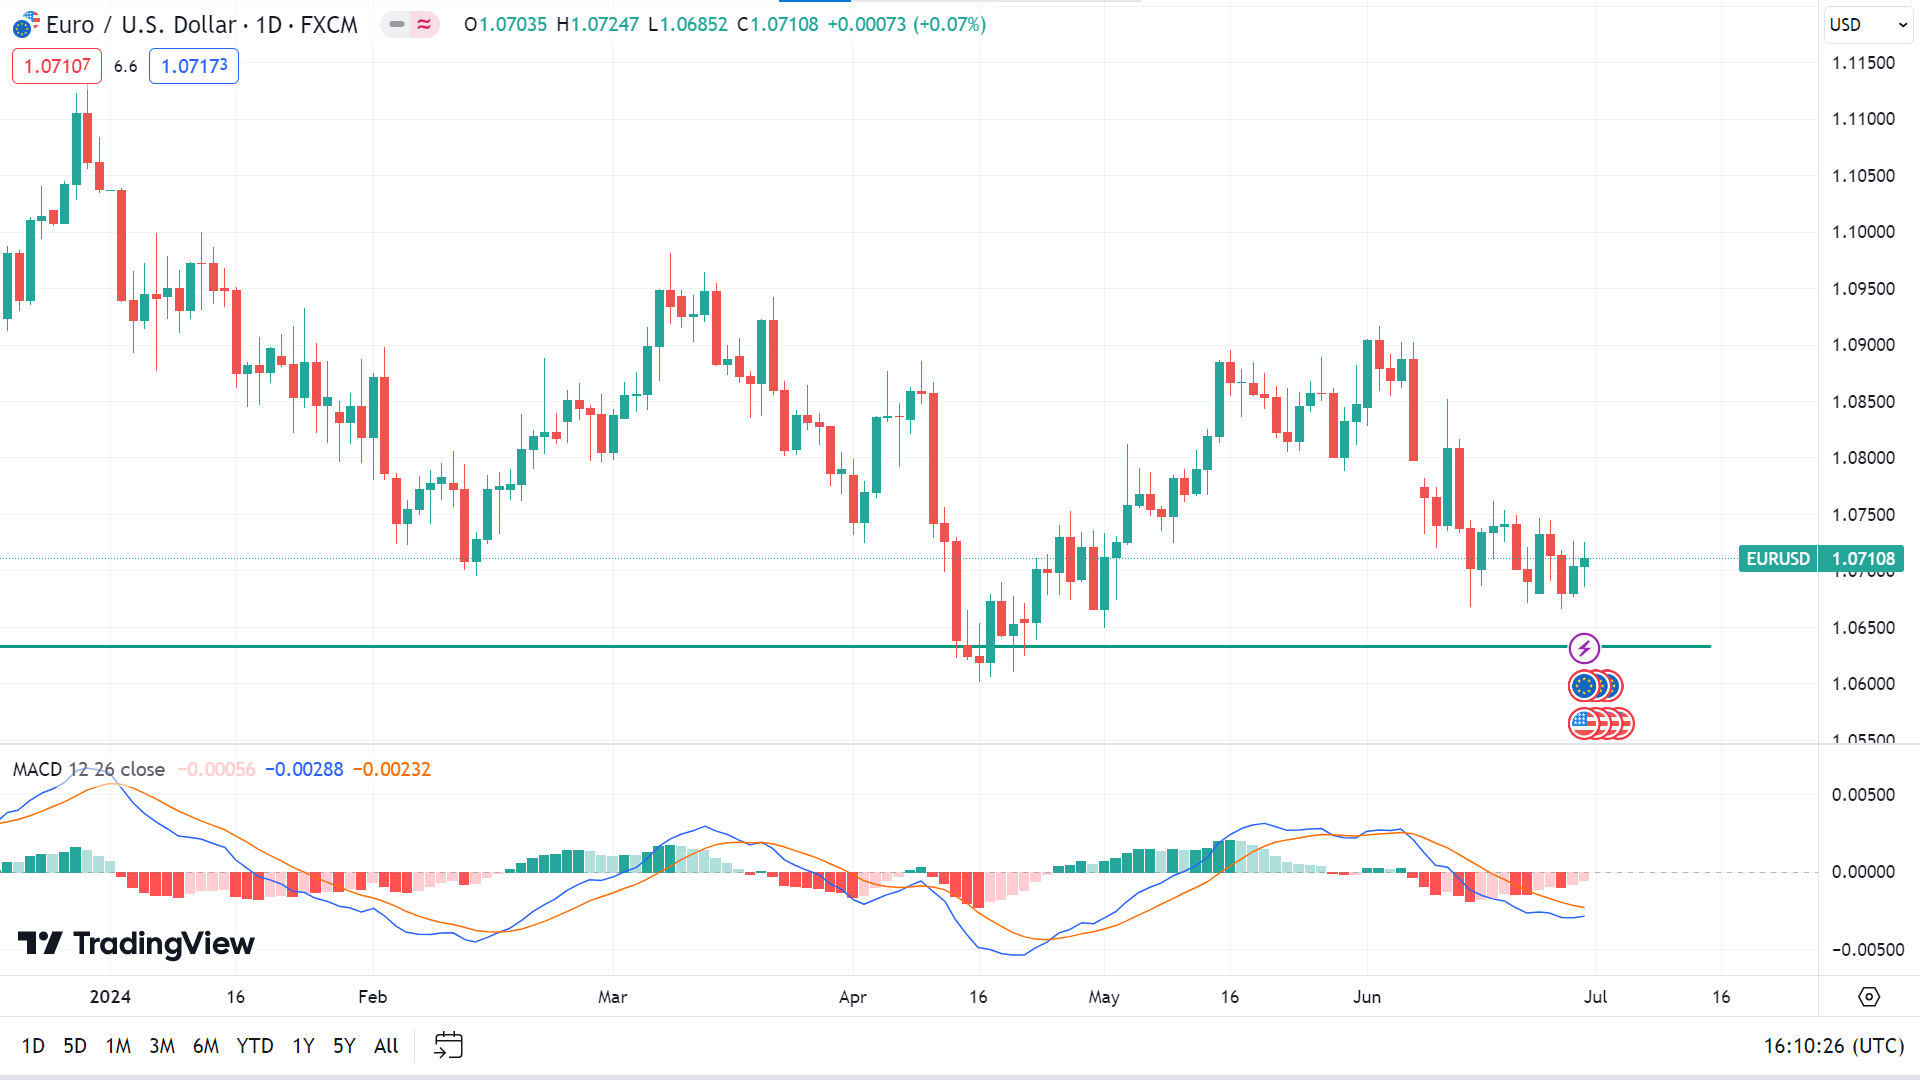
On the daily chart, the MACD indicator reading shows the price is still in negative territory and can continue to decline toward the primary support near 1.0625, followed by the next support near 1.0507.
Meanwhile, the red histogram bars are fading at the MACD window, which reflects decreasing sell pressure. A pause can trigger the price to the primary resistance near 1.0807, whereas the next resistance is near 1.0912.
GBPJPY
Fundamental Perspective
The Japanese Yen (JPY) continued declining, reaching a historic low of 161.27 on before falling below 161.00. Despite repeated assurances from Finance Minister Shun'ichi Suzuki that the Japanese cabinet is “watching the FX moves with a high sense of urgency,” these statements have lost their impact. The market has increasingly ignored the Ministry's warnings, choosing instead to act independently.
In contrast, the Pound Sterling strengthened against all its peers following a revised Q1 GDP report from the UK Office for National Statistics (ONS). The report showed the economy grew by 0.7% quarter-on-quarter, an upward revision from the initial estimate of 0.6%. On an annualized basis, growth was revised to 0.3% from 0.2%. This positive data supported the Pound, though uncertainty remains ahead of UK elections and the Bank of England's (BoE) potential rate cut.
Exit polls suggest the Opposition Labour Party may defeat the Conservative Party led by Prime Minister Rishi Sunak, adding to the uncertainty. Investors are focused on the BoE's August 1 monetary policy meeting, where a rate cut is anticipated. Policymakers like Swati Dhingra and Deputy Governor Dave Ramsden favor reducing interest rates, contingent on whether other members concur. The prospect of a rate cut has risen with inflation returning to the BoE's 2% target, though persistent service sector price pressures complicate the decision.
GBPJPY Forecast Technical Perspective
The last candle finished solid green on the weekly chart, posting consecutive gaining weeks, which reflects strong bullish pressure on the asset price. The next candle might be another green one.
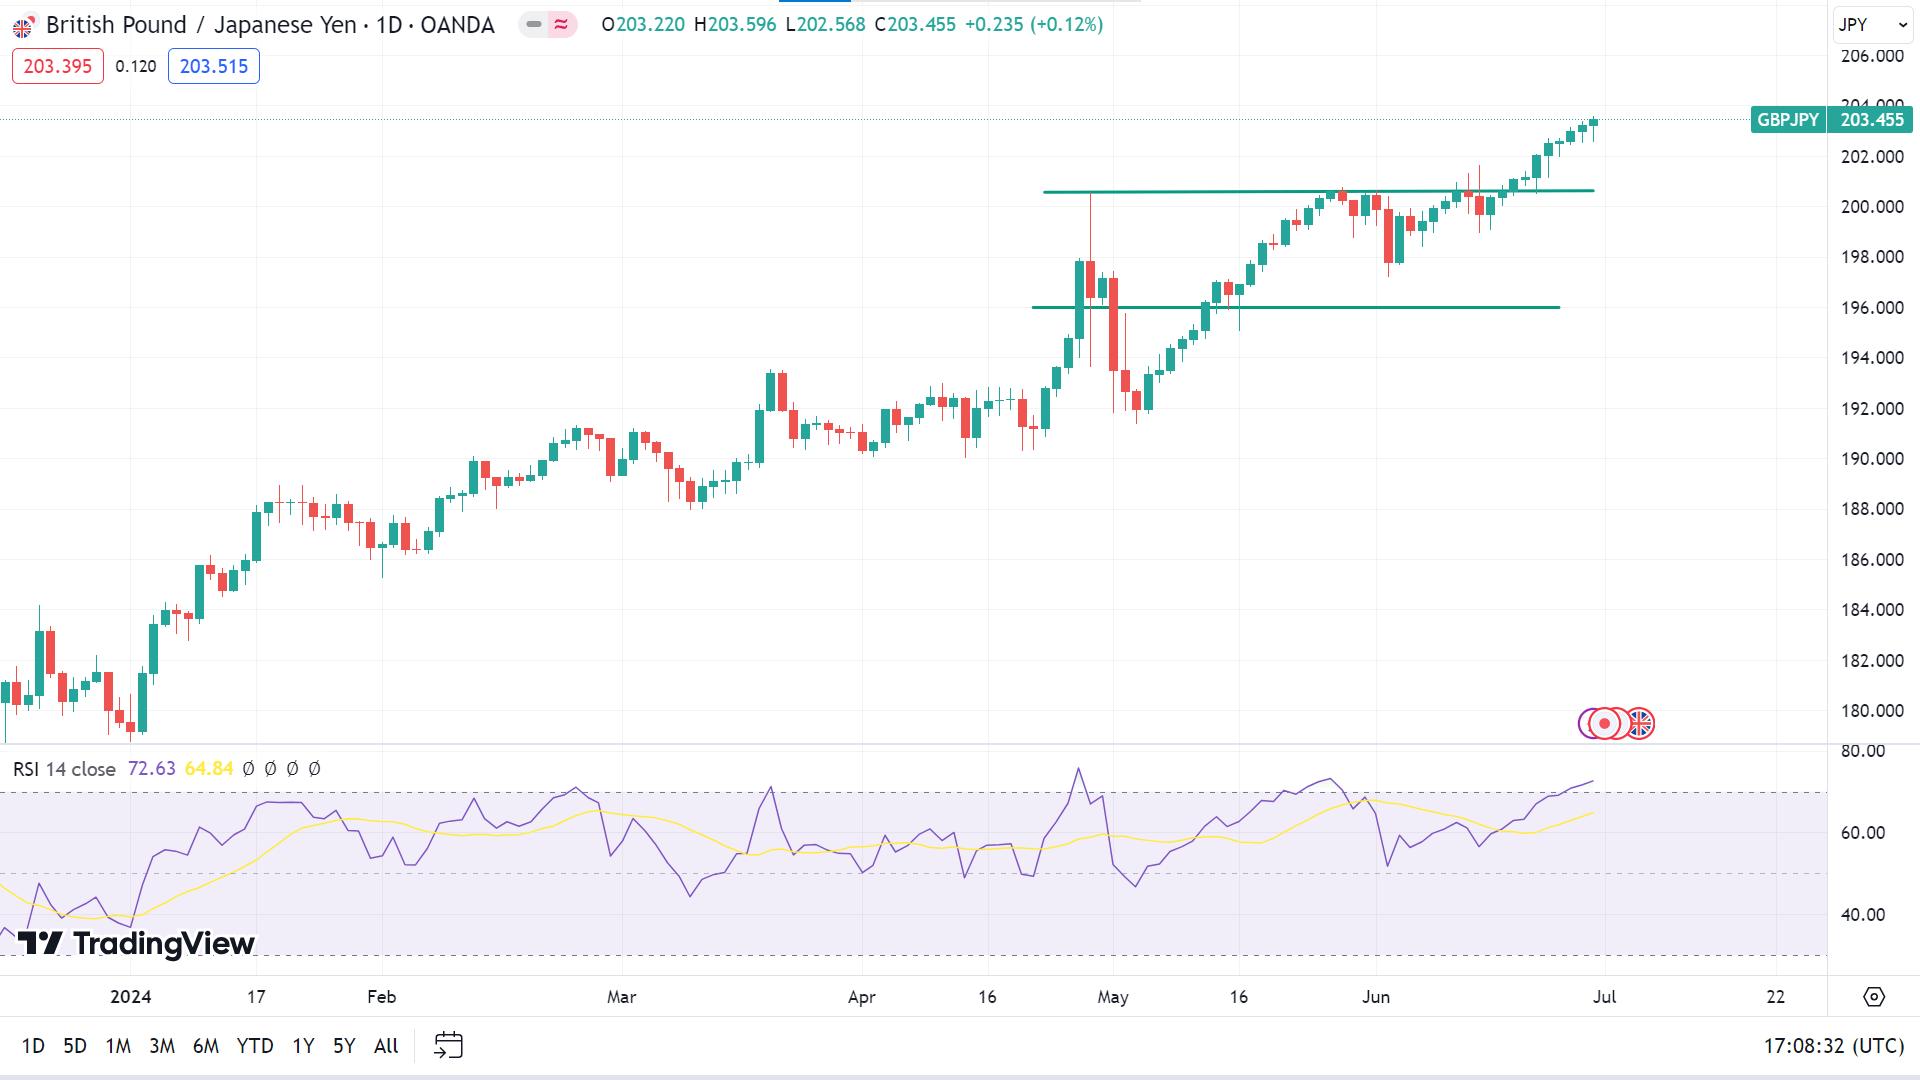
The price remains on an uptrend, as the RSI indicator reading remains neutral. Moving smoothly at the overbought territory, it indicates it may hit the nearest resistance of 104.50, followed by the next resistance near 206.89.
Meanwhile, the RSI signal line in the overbought territory signals an upcoming correction. Any correction in the current uptrend can lead the price to drop to the nearest support near 201.23, followed by the next support near 199.71.
Nasdaq 100 (NAS100)
Fundamental Perspective
U.S. monthly inflation held steady in May, a promising sign after a significant price surge earlier this year raised concerns about the Federal Reserve's effectiveness of monetary policy. The Commerce Department also reported a slight uptick in consumer spending, fueling optimism that the central bank might achieve the desired "soft landing" for the economy.
Following the release of the personal consumption expenditures price index, bets on a September rate cut rose to 66%, according to LSEG FedWatch data. Despite the Fed's projection of just one cut this year, traders remain hopeful for two, anticipating continued cooling inflation.
San Francisco Fed President Mary Daly acknowledged the cooling inflation, recognizing it as "good news that policy is working." However, Fed Governor Michelle Bowman emphasized that the central bank would maintain its course as its inflation target has yet to be achieved.
This week's key earnings releases are Constellation Brands, Inc. (STZ), MSC Industrial Direct Company (MSM), and Simulation Plus Inc. (SLP).
Technical Perspective
The last weekly candle closed as a doji, posting two doji candles after a solid green candle, reflecting a pause in the current bullish trend. So, the room for buyers is wide open, and the next candle can be another green one.
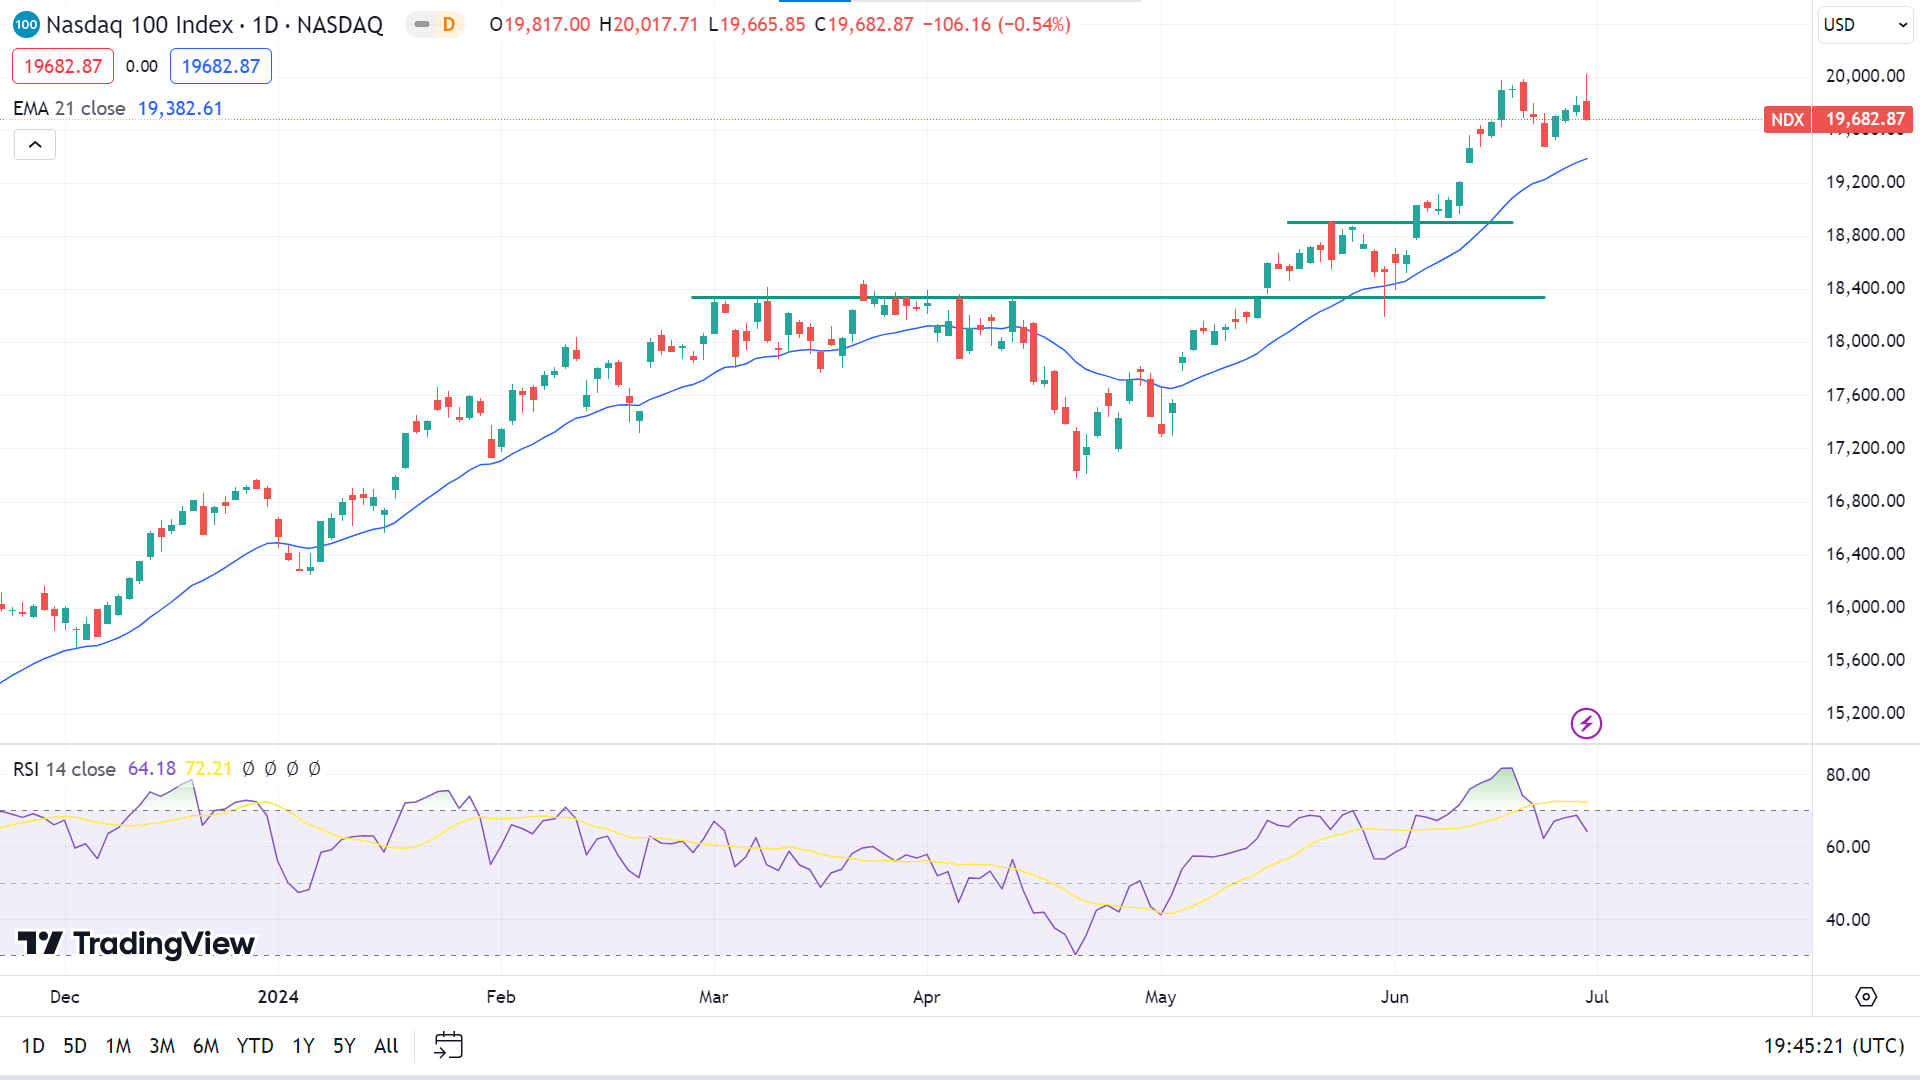
The price remains above the EMA 21 line on the daily chart, supporting the bullish trend. The RSI indicator reading remains neutral, with the signal line starting a sloping downside. According to the EMA 21 line, the price can regain the nearest peak of $20,017.71, followed by the next resistance near $21,489.21.
On the negative side, if the RSI signal line continues to slope downside, the price can drop to the primary support of $19,382.61, followed by the next support level near $18,902.21.
S&P 500 (SPX500)
Fundamental Perspective
The U.S. stock market surged in the first half of 2024, with the S&P 500 achieving a double-digit gain and ending June near its all-time high. This was driven by a 14.5% rise this year fueled by soaring Big Tech stocks. Despite signs of economic slowing, the U.S. economy continues to expand, dispelling fears of an imminent recession.
Mike Skordeles, head of U.S. economics at Truist, noted that economic growth is "cooling but not weak," with inflation easing according to recent data. The Federal Reserve's efforts to cool the economy aim to reduce inflation to its 2% target without triggering a recession. In line with Wall Street's expectations, May's inflation reading showed the personal consumption expenditures price index remained flat while the year-over-year rate slowed to 2.6%. Core inflation, excluding food and energy prices, edged up 0.1% but also eased to 2.6% over the past year.
Kevin Gordon, senior investment strategist at Charles Schwab, highlighted that recent data dispel fears of persistent inflation. He noted that inflation appears to be returning to the 2% target. Despite concerns for lower-income consumers, overall resilience remains strong, supported by a solid labor market and low unemployment.
Technical Perspective
The last weekly candle closed as a doji with a long upper wick after a solid green candle declaring a pause in the bullish trend, leaving buyers optimistic for the next week.
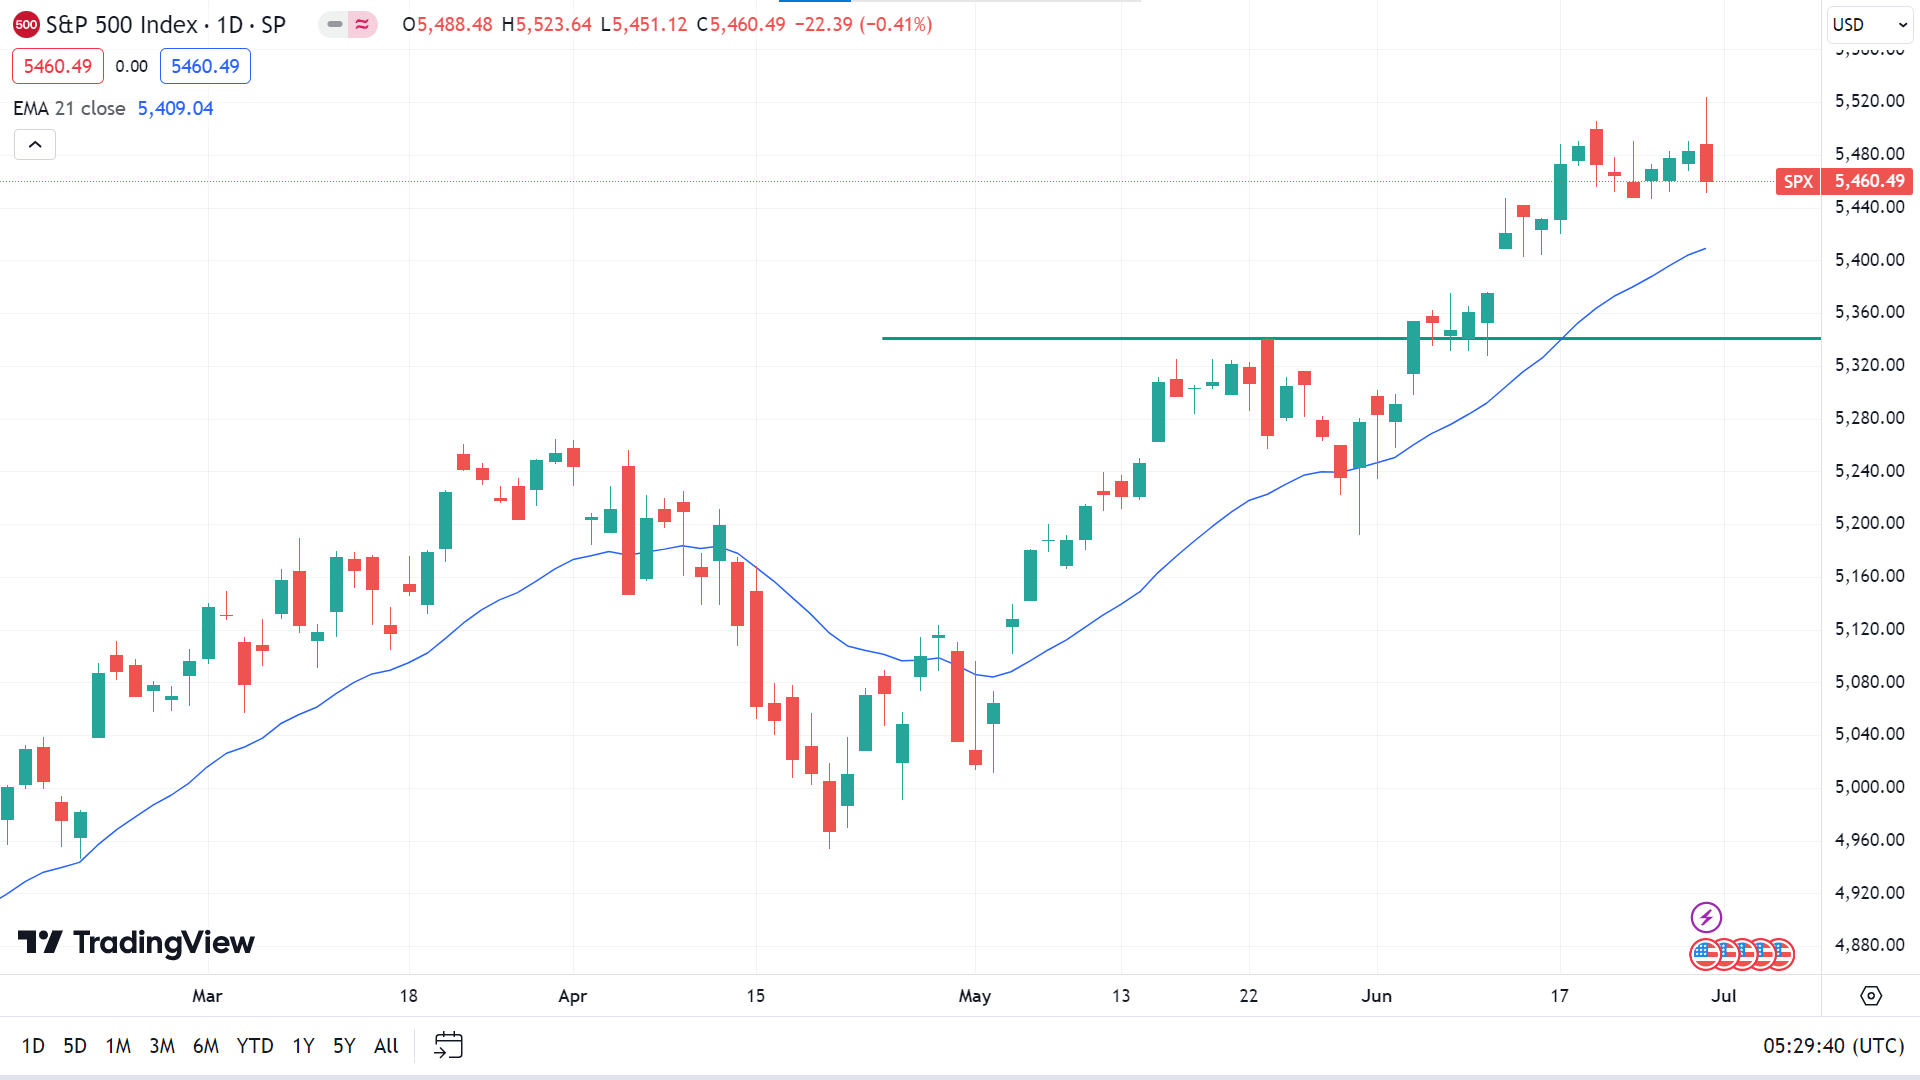
The price has been hovering above the EMA 21 line on the daily chart, supporting the bullish pressure on the asset price, which indicates the price may regain the ATH of $5523.64 or above.
Meanwhile, if the price reaches below the EMA 21 line, it will indicate it may drop to the primary support of $5341.14, followed by the next support near $5232.16.
Gold (XAUUSD)
Fundamental Perspective
Gold (XAU/USD) experienced bearish pressure, dropping below $2,300 on Wednesday after a calm start to the week. However, it recovered its losses on Thursday, stabilizing above $2,320. The upcoming speech by Federal Reserve (Fed) Chairman Jerome Powell at the European Central Bank's Forum on Central Banking and key US macroeconomic data, including the June jobs report, could influence Gold's direction next week.
Early in the week, a lack of significant macroeconomic data and hawkish comments from Fed officials kept the US Dollar resilient, making it difficult for Gold to gain traction. The US Conference Board's Consumer Confidence Index fell slightly to 100.4 in June, while the Present Situation Index improved to 141.5. Fed Governor Michelle Bowman indicated that it isn't yet appropriate to cut interest rates and expressed willingness to raise rates if inflation progress stalls or reverses.
The 10-year US Treasury bond yield gained momentum late Tuesday, pushing XAU/USD below $2,300. Mixed US data allowed Gold to rebound on Thursday. The Bureau of Economic Analysis (BEA) revised Q1 GDP growth to 1.4%, with Durable Goods Orders Defense down 0.2% and Pending Home Sales down 2.1% in May, indicating housing market weakness.
Last Friday, the BEA reported US inflation, as measured by the Personal Consumption Expenditures (PCE) Price Index, edged lower to 2.6% annually in May. This data struggled to bolster the USD, allowing Gold to maintain its gains. Upcoming key US data and Powell's speech will be crucial for Gold's direction.
Gold Price Prediction Technical Perspective
The last weekly candle closed as a doji with a green body, whereas the previous one had a red body, declaring the consolidation phase, leaving mixed signals. So, the next candle can be green or red.
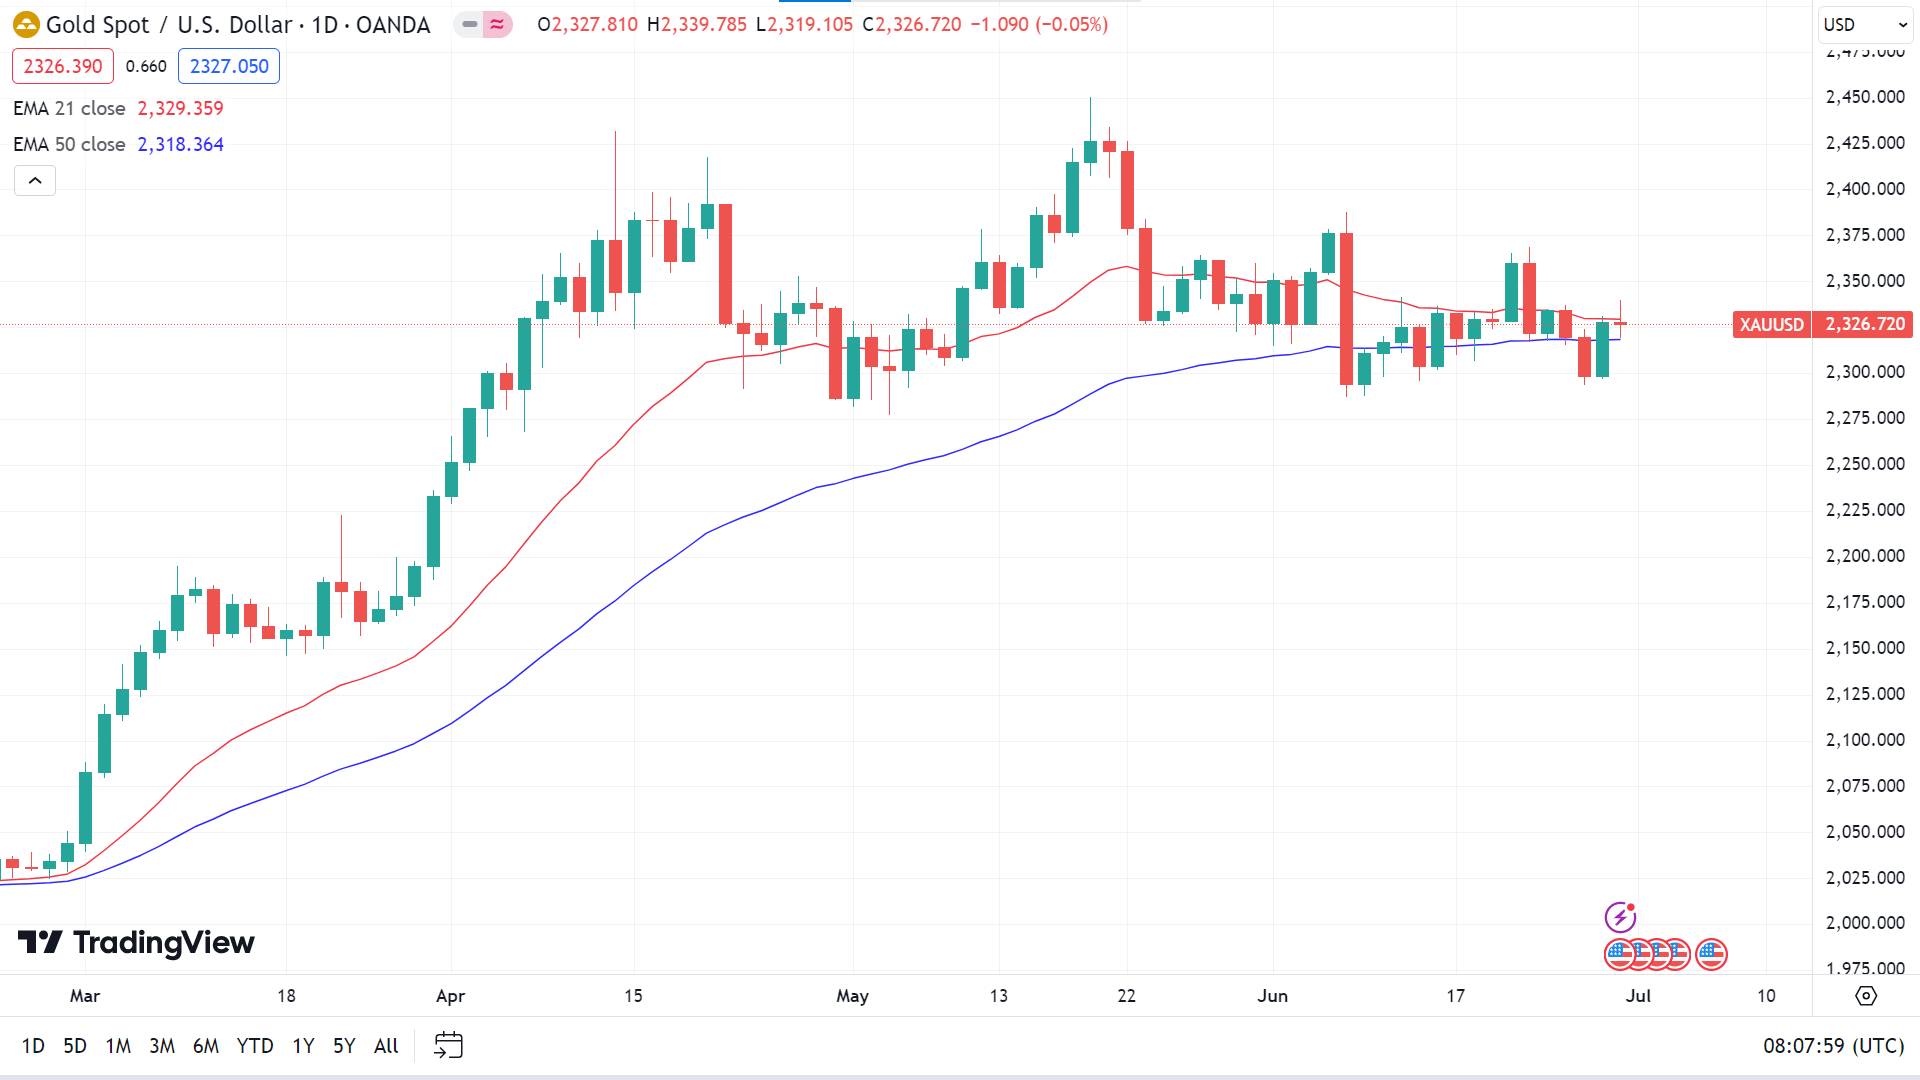
The price floats between the EMA 21 and EMA 50 lines on the daily chart. The EMA 21 line acts as a short-term resistance level, and the EMA 50 line is a short-term support level. So, if the price exceeds the EMA 21 line, indicating fresh bullish pressure, the price might hit the nearest resistance of $2366.53, followed by the next resistance near $2430.20.
On the other hand, if the price reaches below the EMA 50 line, indicating seller domination, it can trigger the price to get to the primary support of $2285.55, followed by the next support near $2244.77.
Bitcoin (BTCUSD)
Fundamental Perspective
As Bitcoin (BTC) floats above the $60,500 mark after rebounding from a recent dip, the cryptocurrency market closely watches the interplay between recent U.S. economic data and Bitcoin price predictions. The lower-than-expected inflation data suggests easing inflationary pressures, potentially reducing the need for aggressive Federal Reserve rate hikes. This scenario could favor Bitcoin, indicating a more supportive environment for risk assets.
However, the dip in consumer sentiment reflects concerns about the overall economic outlook, tempering investor enthusiasm. Bitcoin's price action mirrors this mixed sentiment. After bouncing off the psychological support level of $60,000, it is now trading above $60,500 as of June 29th. This rebound indicates that while the market interprets the economic data as moderately negative, it is not as detrimental as some had feared.
The key economic data release has had a mixed impact on Bitcoin, with the cryptocurrency showing resilience by maintaining its position above the $60,000 support level. While this data may indicate a less aggressive Fed in the near term, investors should remain cautious, closely monitoring the evolving macroeconomic landscape and regulatory environment. The recent price stability offers a glimmer of optimism amidst a complex economic backdrop, though uncertainty remains.
Bitcoin Price Prediction Technical Perspective
The last weekly candle closed as a hammer candlestick with a red body and a lower wick, posting three consecutive losing weeks, still leaving hope for sellers in the upcoming week.
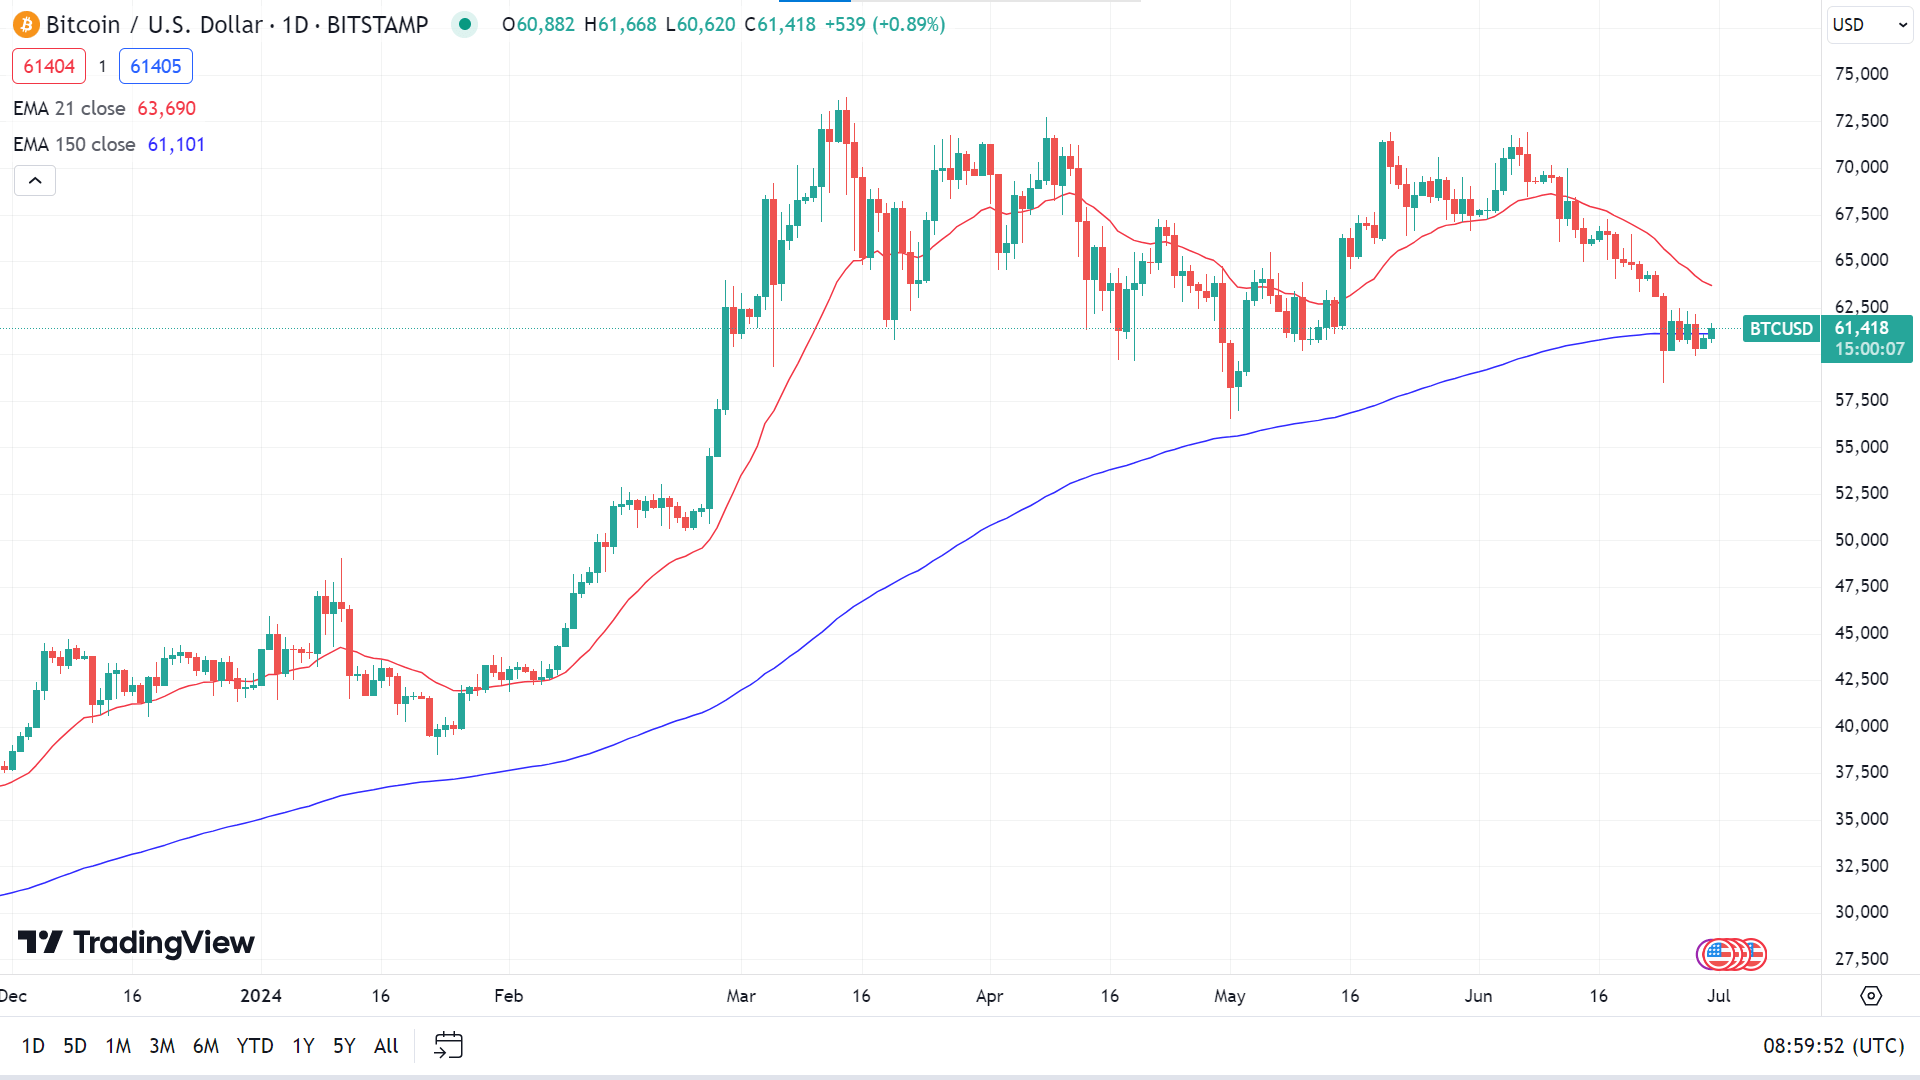
The price moves sideways on the daily chart, floating between the EMA 21 and EMA 150 lines. Thus, the EMA 21 and EMA 150 lines act as dynamic resistance and support levels. If the price exceeds the EMA 21 line, it can hit the primary resistance of $65,771, followed by the next resistance near $71,295.
Meanwhile, if the price drops below the EMA 150 line, it can reach the nearest support of $59,099, followed by the next support near $56,770.
Ethereum (ETHUSD)
Fundamental Perspective
The cryptocurrency market is excited as the U.S. Securities and Exchange Commission (SEC) has authorized the launch of 10 Ethereum (ETH) spot ETFs in July 2024. Galaxy Digital believes that the SEC's approval of all 19b-4 filings on May 23, 2024, is a significant milestone in the cryptocurrency industry, with the potential to garner substantial investor interest.
The performance of Bitcoin ETFs, introduced on January 11, 2024, has established a precedent for Ethereum ETFs. By mid-June 2024, the net inflows of Bitcoin ETFs had already reached $15.1 billion.
Analysts anticipate that Ethereum ETFs could generate 20-50% of Bitcoin ETF net inflows within the initial five months, with a monthly target of $1 billion. It is anticipated that independent investment advisors and those affiliated with banks or broker-dealers will constitute the primary market for these ETFs. Ethereum's price is more susceptible to ETF inflows than Bitcoin due to its distinctive attributes, including significant portions bound in staking, bridges, and smart contracts.
Ethereum Price Prediction Technical Perspective
The last weekly candle closed as a doji with a small red body after four consecutive losing weeks, reflecting a pause in the current bearish trend. The next candle might be another red one.
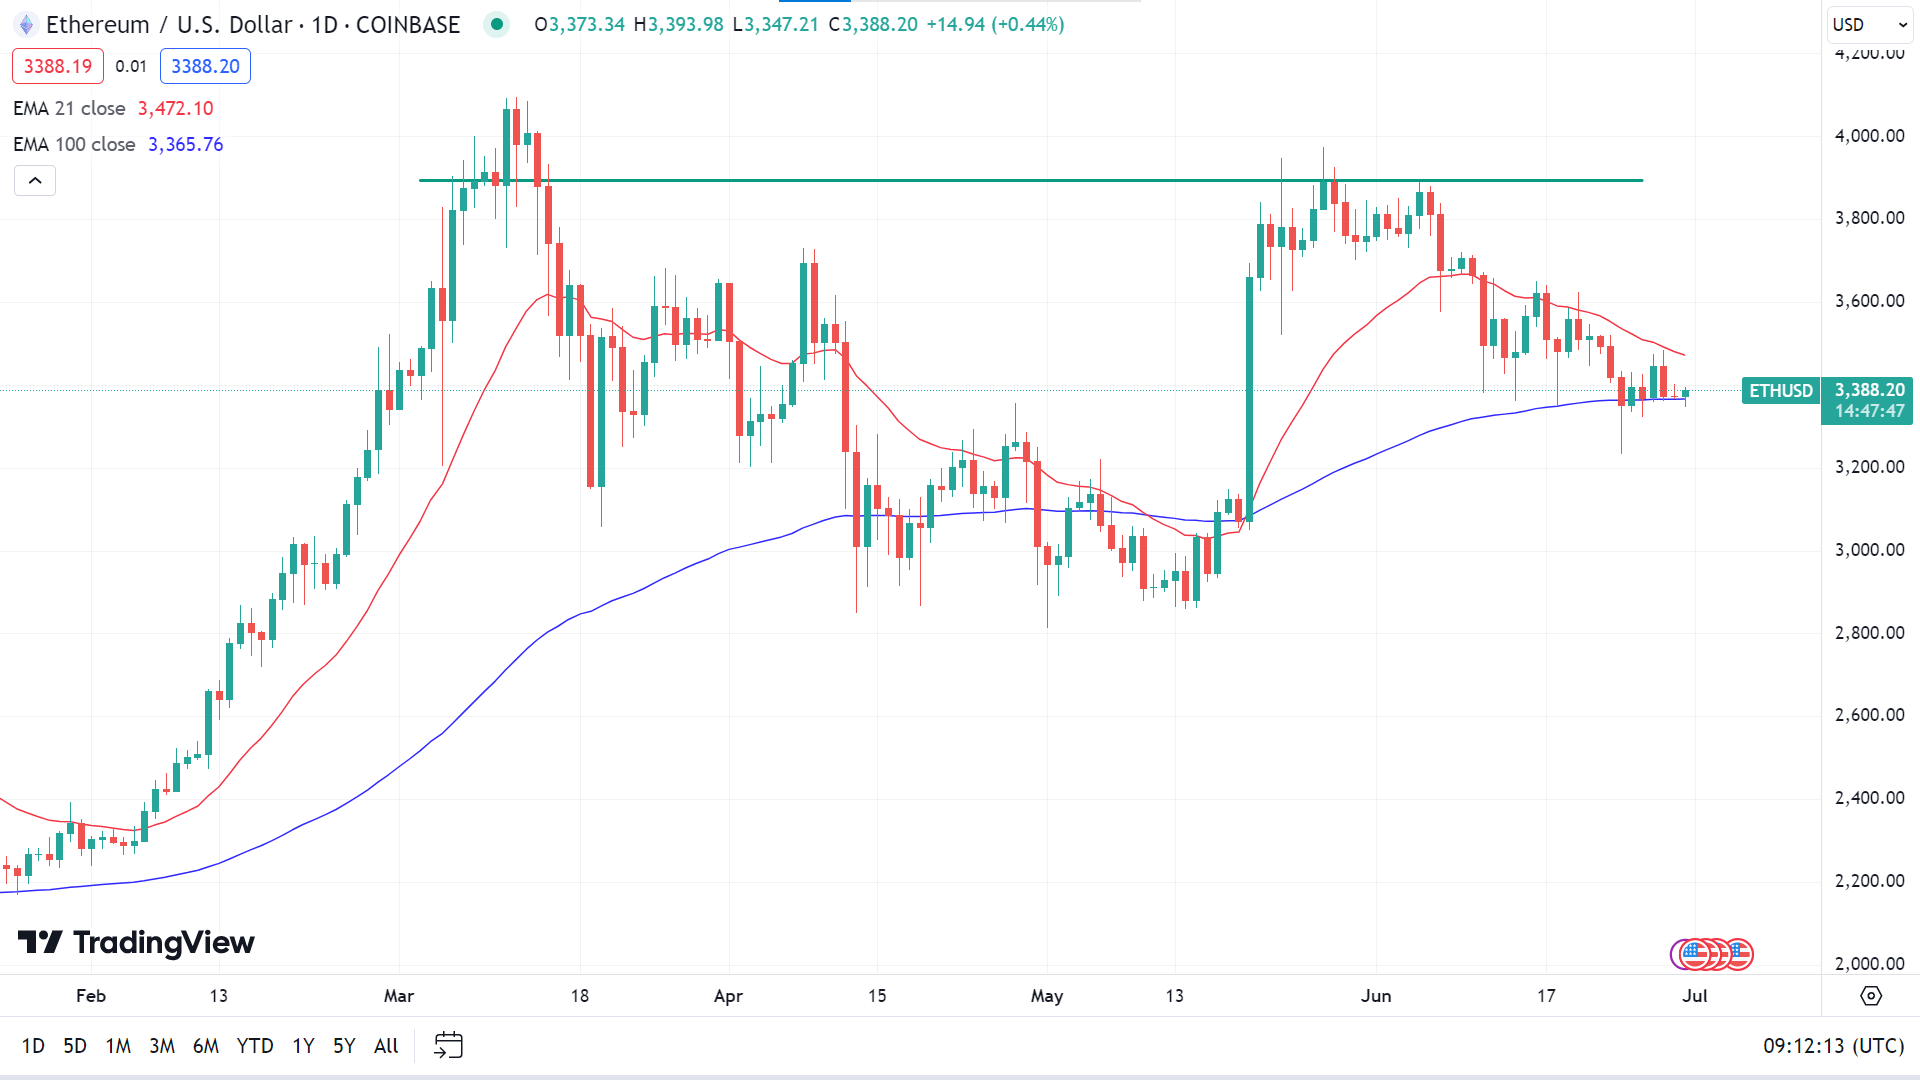
On the daily chart, the price hovers between the EMA 21 and EMA 100 lines at the time of writing. If the price exceeds the EMA 12 line, it can reach the primary resistance of $3656.14, followed by the next resistance near $3894.25.
On the negative side, if the price drops below the EMA 100 line, it will indicate the price may decline to the nearest support of $3242.57, followed by the next support near $3038.62.
Tesla Stock (TSLA)
Fundamental Perspective
Tesla (TSLA) stock rose above $200 for the first time in nearly three months, a significant milestone ahead of the EV maker's second-quarter delivery report.
Tesla's stock had not traded above $200 since March 1. “Getting through $200 can be psychologically significant,” says Frank Cappelleri, a technical analyst and founder of CappThesis. Investors often view round numbers as key milestones.
The stock has risen about 18% from its June lows, driven by the reapproval of CEO Elon Musk's 2018 compensation package, which includes 300 million incentive-laden stock options. This vote alleviated investor concerns, fueling recent gains. However, the rally increases the likelihood of volatility after Tesla reports its second-quarter delivery results on Tuesday.
Wall Street estimates suggest deliveries of around 420,000 vehicles, down from 466,000 in the second quarter of 2023. Exceeding this number could boost the stock while falling short might trigger a decline. Technical analyst Will Tamplin notes that surpassing the 200-day moving average of $207 could propel shares to $220-$225, especially with strong delivery results. Conversely, a weak outcome could send shares back toward $170.
Tesla Stock Forecast Technical Perspective
On the weekly chart, the last candle ended solid green after several weeks of sideways movement, leaving optimism for buyers for the next week.
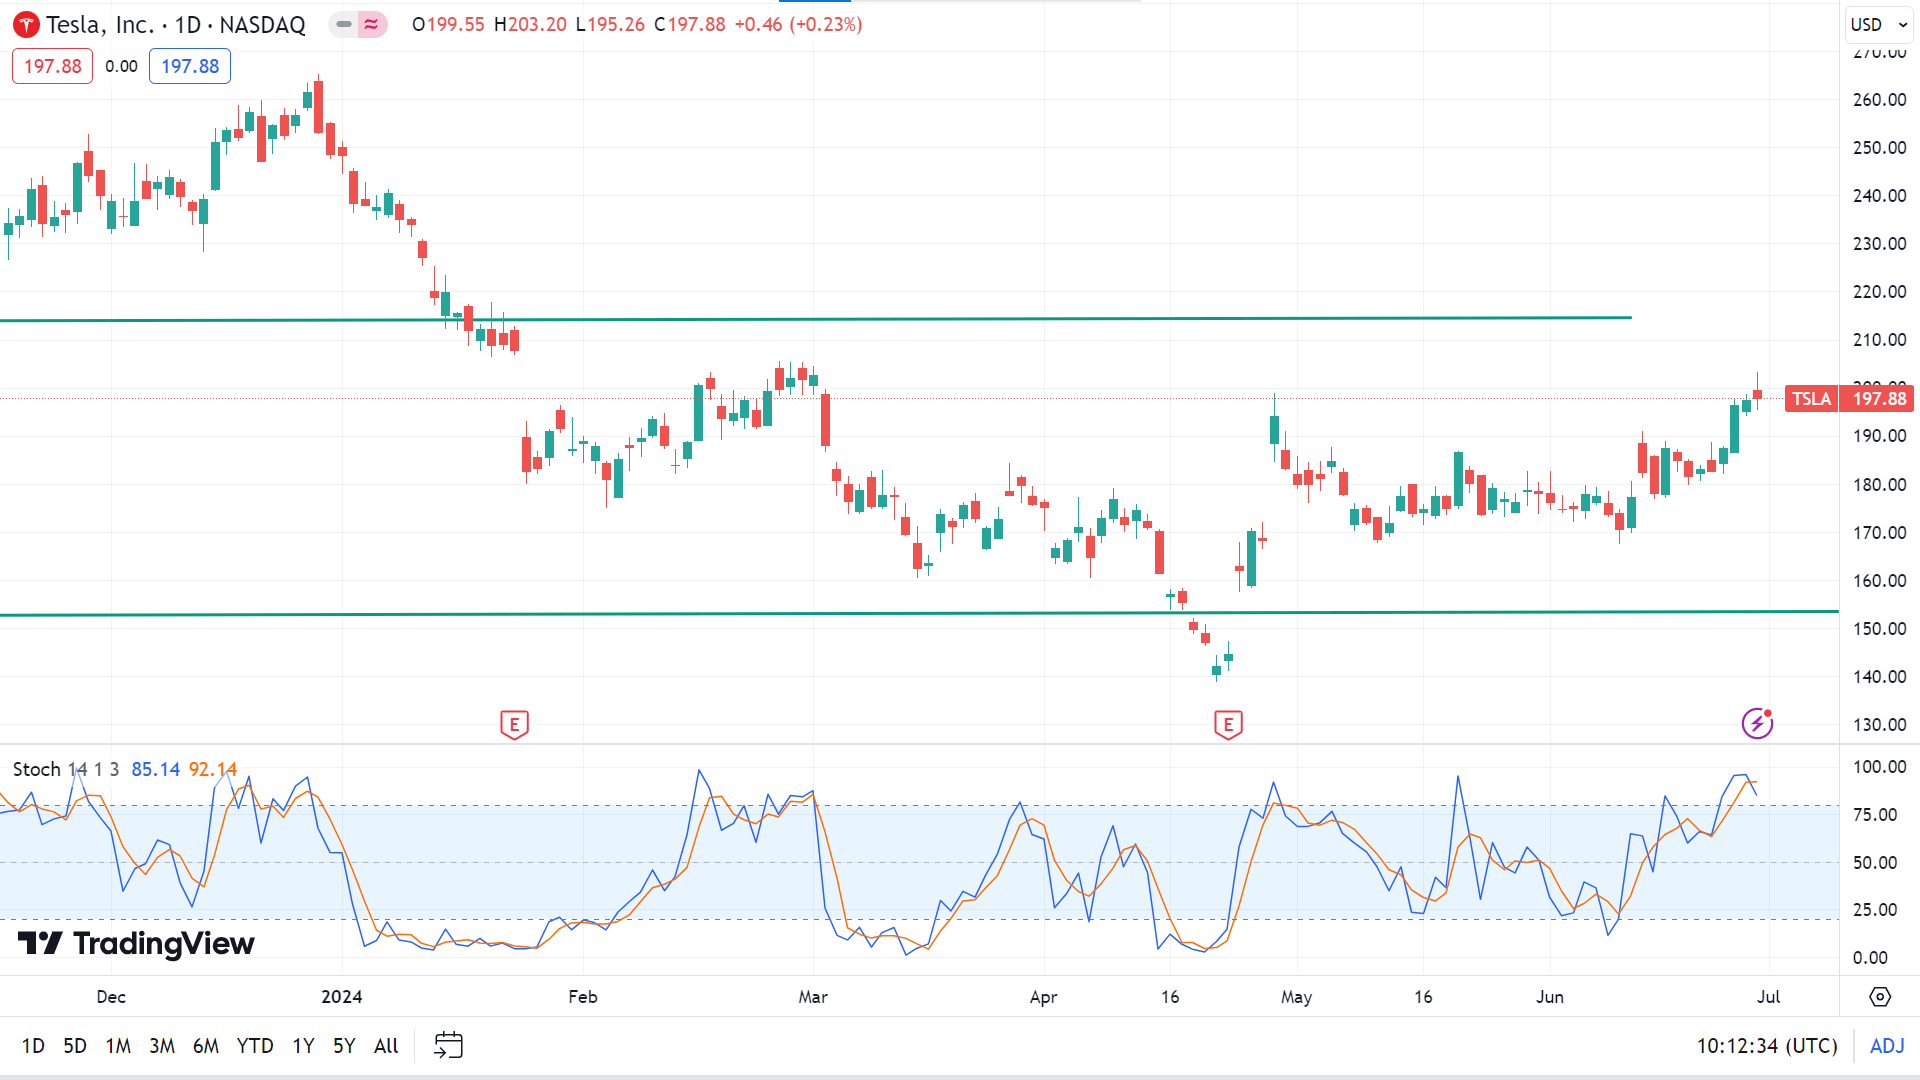
On the daily chart, the price is moving in an uptrend, as the Stochastic indicator window suggests. The signal lines on the Stochastic window move in overbought territory, creating a bearish crossover, so the reading remains neutral. So, the price may regain the nearest peak of $203.20, followed by the next resistance near $214.24.
Meanwhile, as the signal lines of the Stochastic window create a bearish crossover, it signals fresh sell pressure, leaving optimism for sellers that the price may drop to the primary support of $190.29, followed by the next support near $177.82.
Nvidia Stock (NVDA)
Fundamental Perspective
In the first half of 2024, the Wall Street Journal reported that Nvidia's stock surged by an impressive 150%, vastly outperforming the broader market's 15% gain. The surge underscores Nvidia's pivotal role in the AI chip sector, where it is poised to capitalize on burgeoning demand driven by applications like AI chatbots.
Analysts foresee robust demand for AI chips, projecting the market to grow from $200 billion in 2023 to $400 billion annually by 2027. Given its dominant market position and technological prowess in AI, this growth trajectory favors Nvidia.
Major tech giants like Alphabet, Microsoft, Meta Platforms, and Amazon, which heavily leverage AI technologies, have significantly boosted their market returns. For instance, increased demand for AI-driven software and cloud services fueled Microsoft's strong sales performance. At the same time, Amazon and Meta Platforms capitalized on AI innovations in their respective sectors.
Despite potential challenges and risks associated with generative AI, including concerns about accuracy and implementation, investors remain optimistic about its transformative potential across various industries. It echoes sentiments that we are still in the early stages of a long-term AI-driven growth phase.
Nvidia Stock Forecast Technical Perspective
The last weekly candle closed doji after a red hammer candle reflects sellers in control. So, the next candle can be another green one.
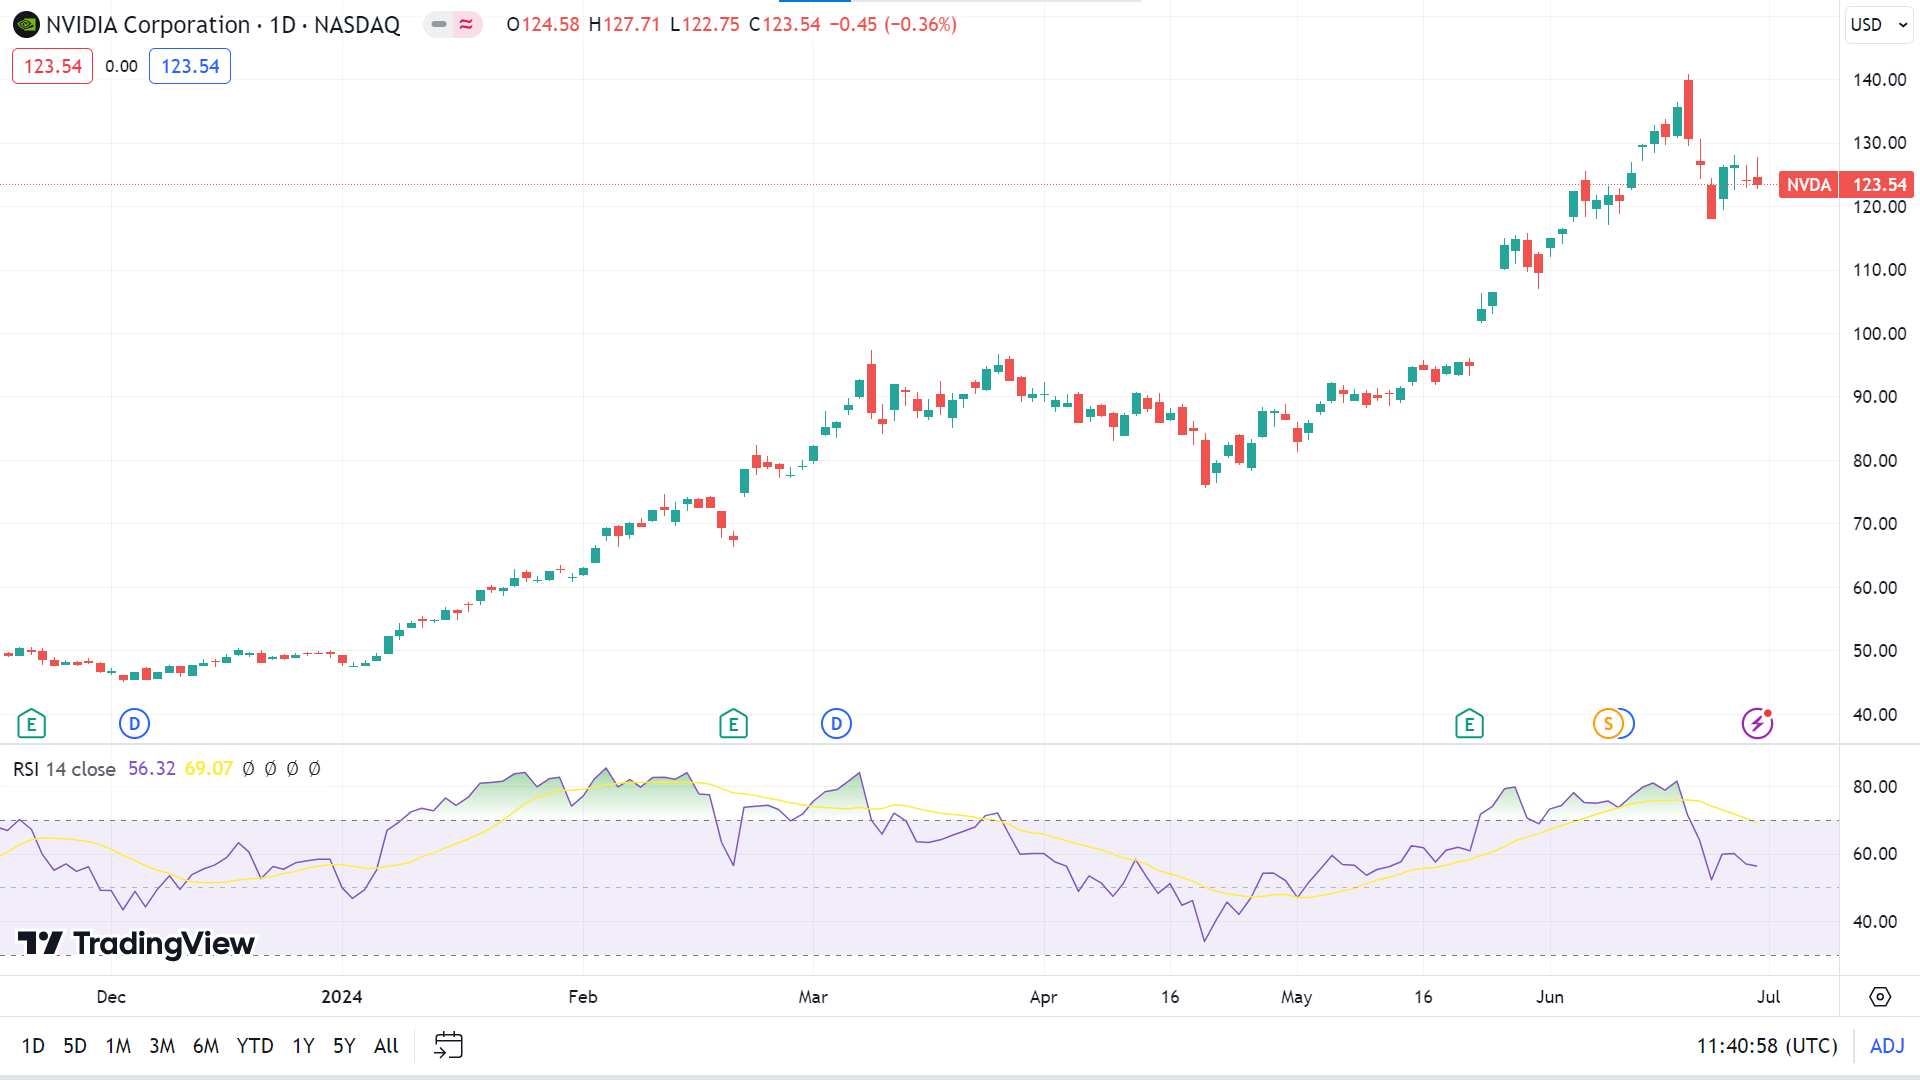
The RSI indicator reading remains neutral as the signal line moves sideways above the midline of the indicator window at the daily chart. If the RSI signal line slops on the upside, the price may head to regain the ATH of $140.76 or above.
On the downside, the price can drop toward the primary support of $112.57, followed by the next support near $107.31. Meanwhile, the RSI signal line will also slope down.
WTI Crude Oil (USOUSD)
Fundamental Perspective
West Texas Intermediate (WTI) surged to an eight-week high, driven by renewed risk appetite across the broader market. However, momentum faded during the US trading session, causing Crude Oil prices to retreat from their peak. The Energy Information Administration (EIA) reported a modest increase in overall fossil fuel demand but highlighted a persistent decline in gasoline consumption alongside robust US production levels.
Despite market hopes for increased Crude Oil demand during the summer, consumer uptake of fossil fuels has consistently fallen short of expectations. The EIA noted that while US inventories of Crude Oil and petroleum products reached their highest levels since December, elevated production levels, which peaked at 13.25 million barrels per day (bpd) in April, have outweighed supply reductions.
Additionally, consumer gasoline demand declined to 8.83 million bpd in April, marking its lowest since February. These trends underscore ongoing difficulties in aligning market forecasts with consumer behavior, highlighting the complex dynamics influencing Crude Oil prices amidst broader economic uncertainties.
Oil Prices Forecast Technical Perspective
The last candle closed green on the weekly chart, posting three consecutive gaining weeks, indicating the next candle might be another green one.
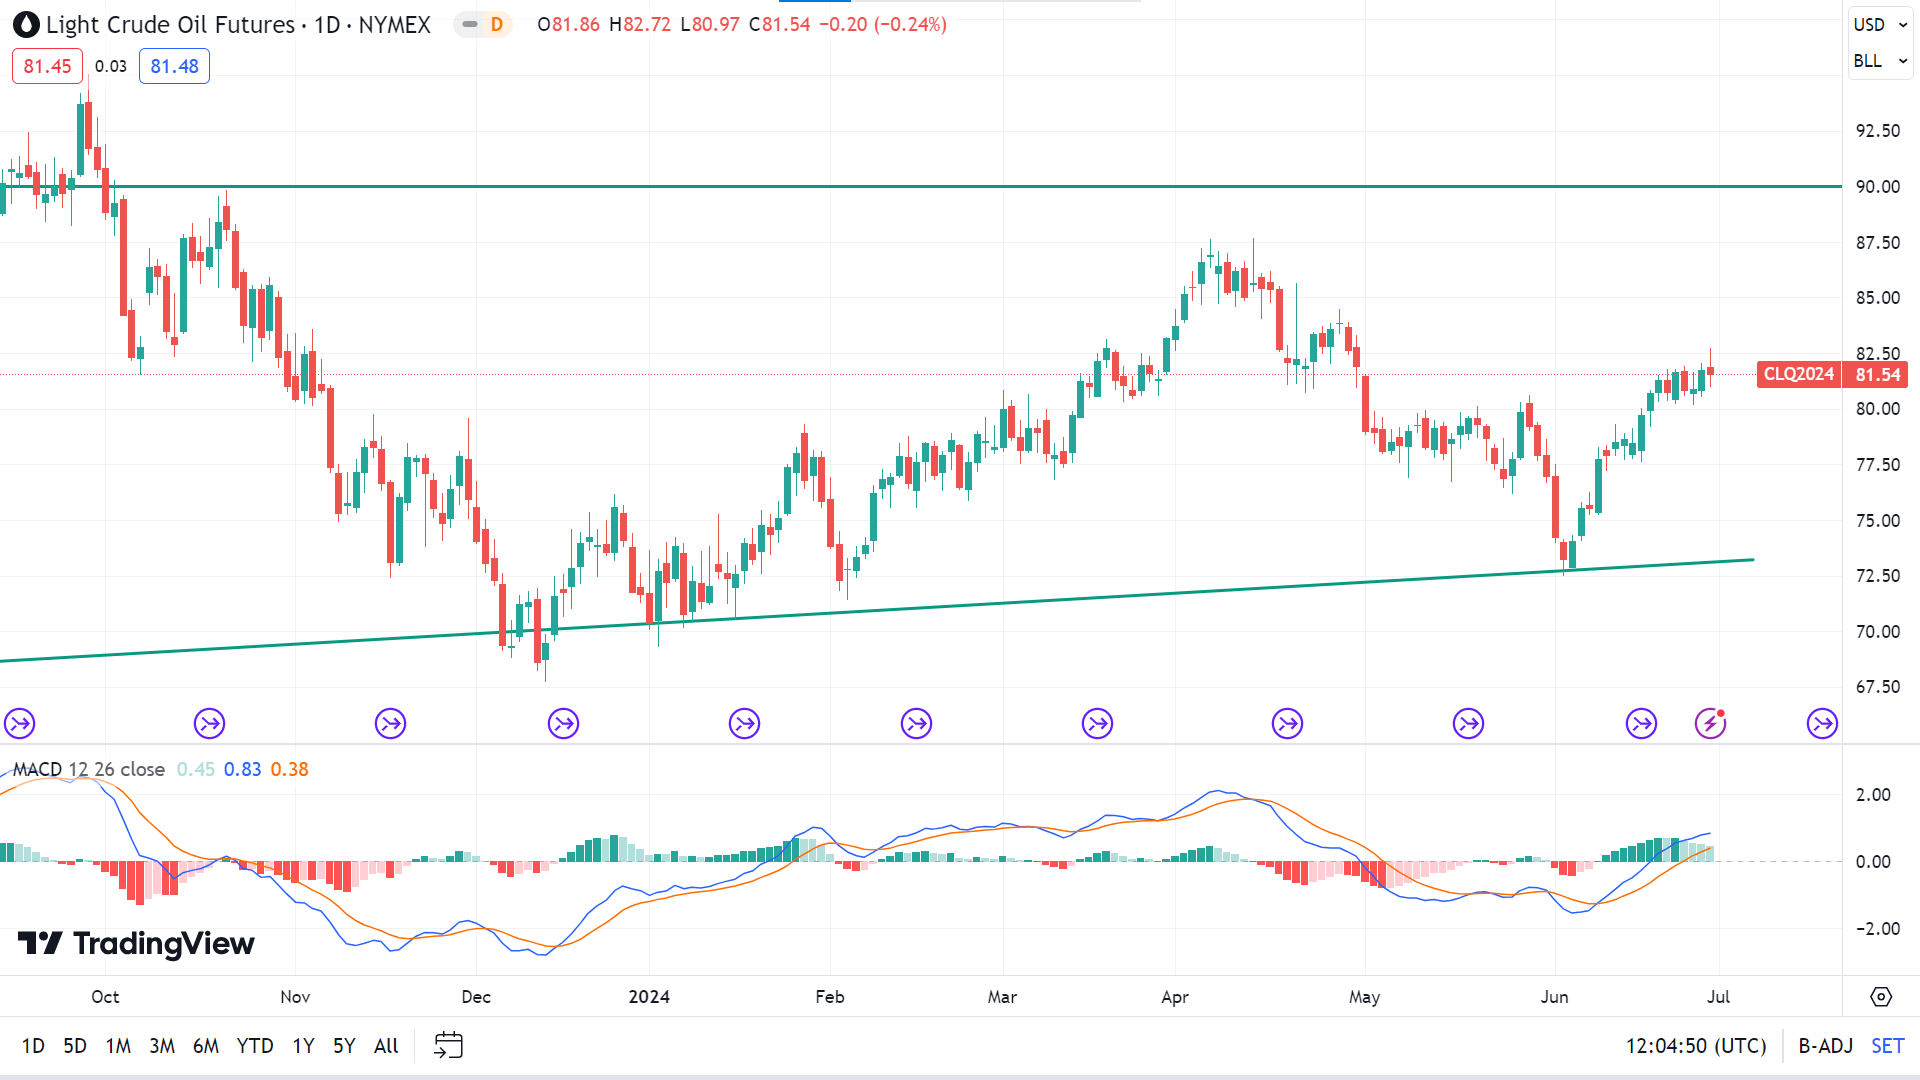
Looking at the daily chart, the MACD window shows bullish pressure as the signal lines move upward, crossing the midline. This indicates that the price may hit the primary resistance of $83.66, followed by the next resistance near $86.88.
Meanwhile, the green histogram lines fade at the MACD window, indicating bullish pressure may be looming. Any correction can lead the price to drop to the nearest support of $77.87, followed by the next support near $73.50.


