
EURUSD
Fundamental Perspective
Last week, the EUR/USD pair dropped below 1.0900 because people in the market preferred the US Dollar. Financial markets decide things based on two main reasons. First, investors took back some bets on the United States (US) lowering rates in March, as data showed the local economy staying strong. Second, worries came up due to slow Chinese data and problems in the local housing market, making investors avoid high-yield investments.
In Europe, the Federal Statistics Agency Destatis reported a 0.3% decrease in Real Gross Domestic Product (GDP) for 2023. The ZEW Survey showed things getting worse in the current economic situation in January, with the index going down to -77.3. But the feelings about the economy improved to 15.2 in the country and 22.7 in the EU. Also, Germany confirmed that prices went up 3.8% compared to last year in December, and the EU prices went up 2.9%, just like they thought.
In the US, December had a good 0.6% increase in Retail Sales and fewer unemployment claims, with 187K in the week ending January 12. Also, Industrial Production in December was better than expected, going up by 0.1%. But the numbers related to manufacturing didn't meet expectations, showing that this part of the economy has known problems.
Technical Perspective
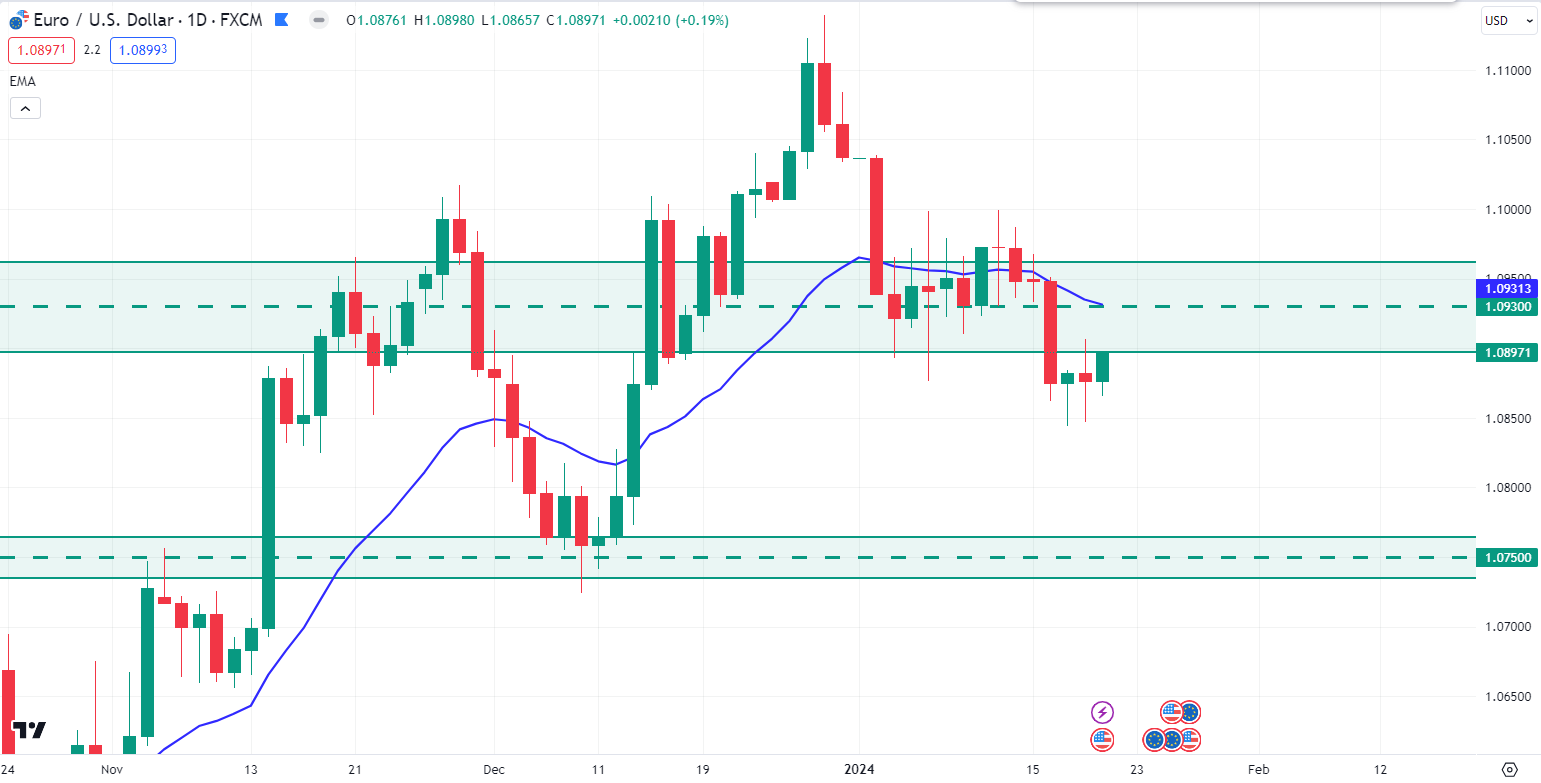
Source: TradingView
In the weekly chart, the EURUSD shows a downside continuation after the Doji but failed to move below any significant level.
On the daily timeframe, the price broke below the 20-day EMA with a strong bearish daily candle. Following the channel extension, the price may retrace to the upside toward the 1.0930 psychological event area.
On the bearish side, if the price retraces to the 1.0930 psychological event area and rejects with an impulsive daily bearish candle, bears may continue the bearish pressure toward the 1.0750 support area.
GBPJPY
Fundamental Perspective
The GBP/JPY pair fell from a recent eight-year high of 189.00 during the early New York session. This drop is happening because Retail Sales in the United Kingdom took a big hit in December, even with the festive season.
The Office for National Statistics (ONS) says there was a significant fall in sales at food stores and early Christmas shopping, causing an even sharper decline in overall consumer spending. Additionally, higher consumer spending was affected by a deep cost-of-living crisis caused by higher interest rates and stubborn price pressures. Annual Retail Sales had a steep decline of 2.4%, while experts expected a strong growth of 1.1%. This significant drop in consumer spending has raised concerns about a possible recession in the UK economy.
It's important to know that the UK economy shrank by 0.1% in the third quarter of 2023, according to revised estimates from the UK ONS. The Bank of England (BoE) predicts that the economy won't show any growth in the final quarter of 2023. If the Gross Domestic Product (GDP) contracts in Q4, it would mean the UK economy is technically in a recession.
Technical Perspective
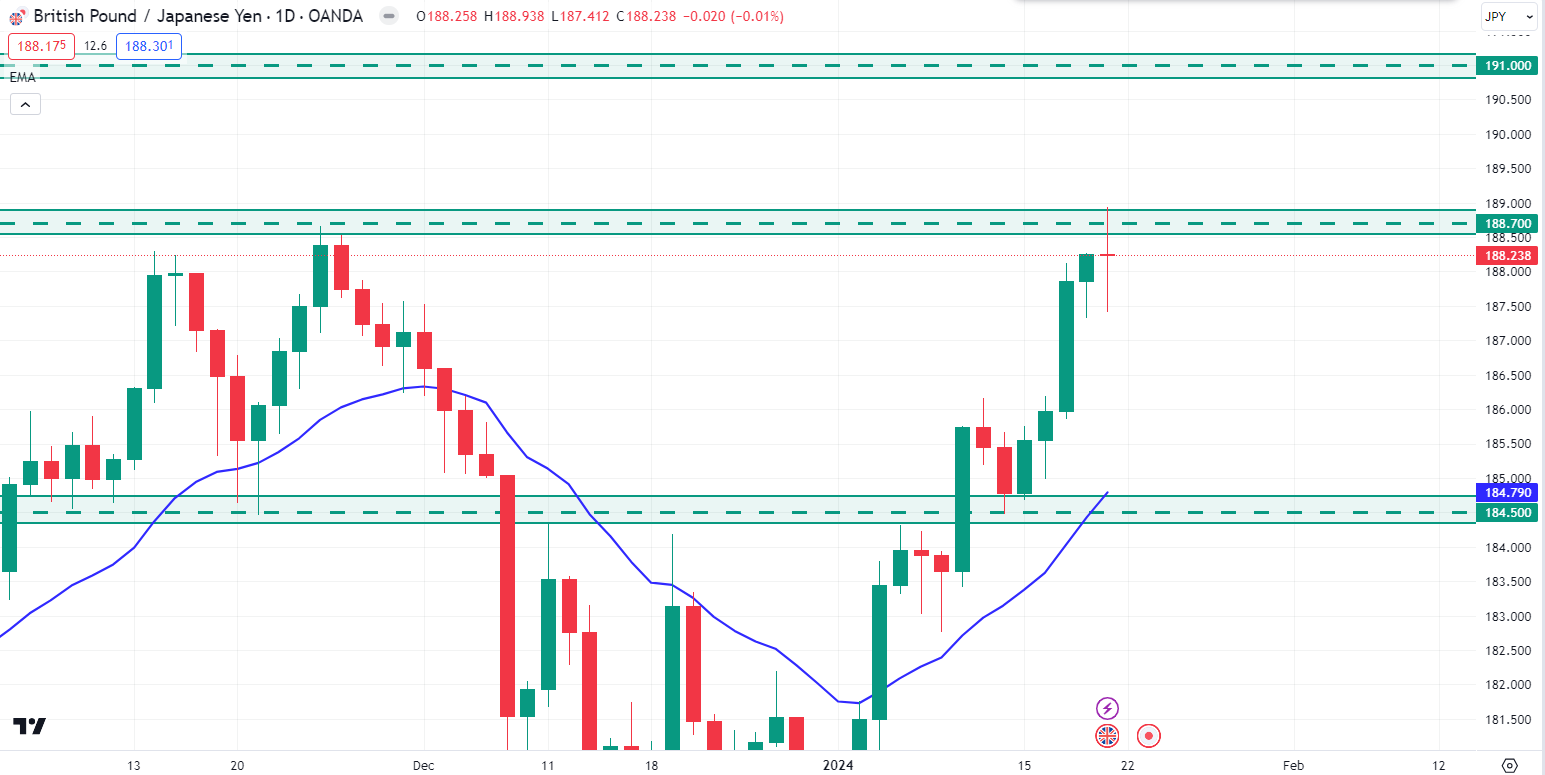
Source: TradingView
GBPJPY bulls failed to break above the 188.70 psychological level but the recent recovery could be a pre-breakout structure.
Last week Friday, after bouncing from the 185.50 support level GBPJPY bulls pushed the price higher and had an indecision candle close. So, in the upcoming week, if the price can break the 188.70 level with a daily bullish candle close, bulls may sustain the bullish pressure toward the 191.00 price area.
On the bearish side, if the price can break below the indecision candle low, bears may regain momentum and push the price down to the 184.50 support area.
Nasdaq 100 (NAS100)
Fundamental Perspective
The week of January 22–26, 2024, appears to be when the NAS100 might see some volatility. a favorable attitude appears to be fuelled by favorable economic indicators and company profit reports, according to recent statistics. The euphoria is fueled by good news about technology companies and a reduction in global tensions. But given the uncertainty surrounding world events and possible market volatility, prudence is urged.
Important economic announcements should be watched by traders, and they should be alert for any abrupt changes in market mood. During this volatile trading week, it is advised to keep updated by using reputable news sources and adjusting strategy as necessary.
Technical Perspective
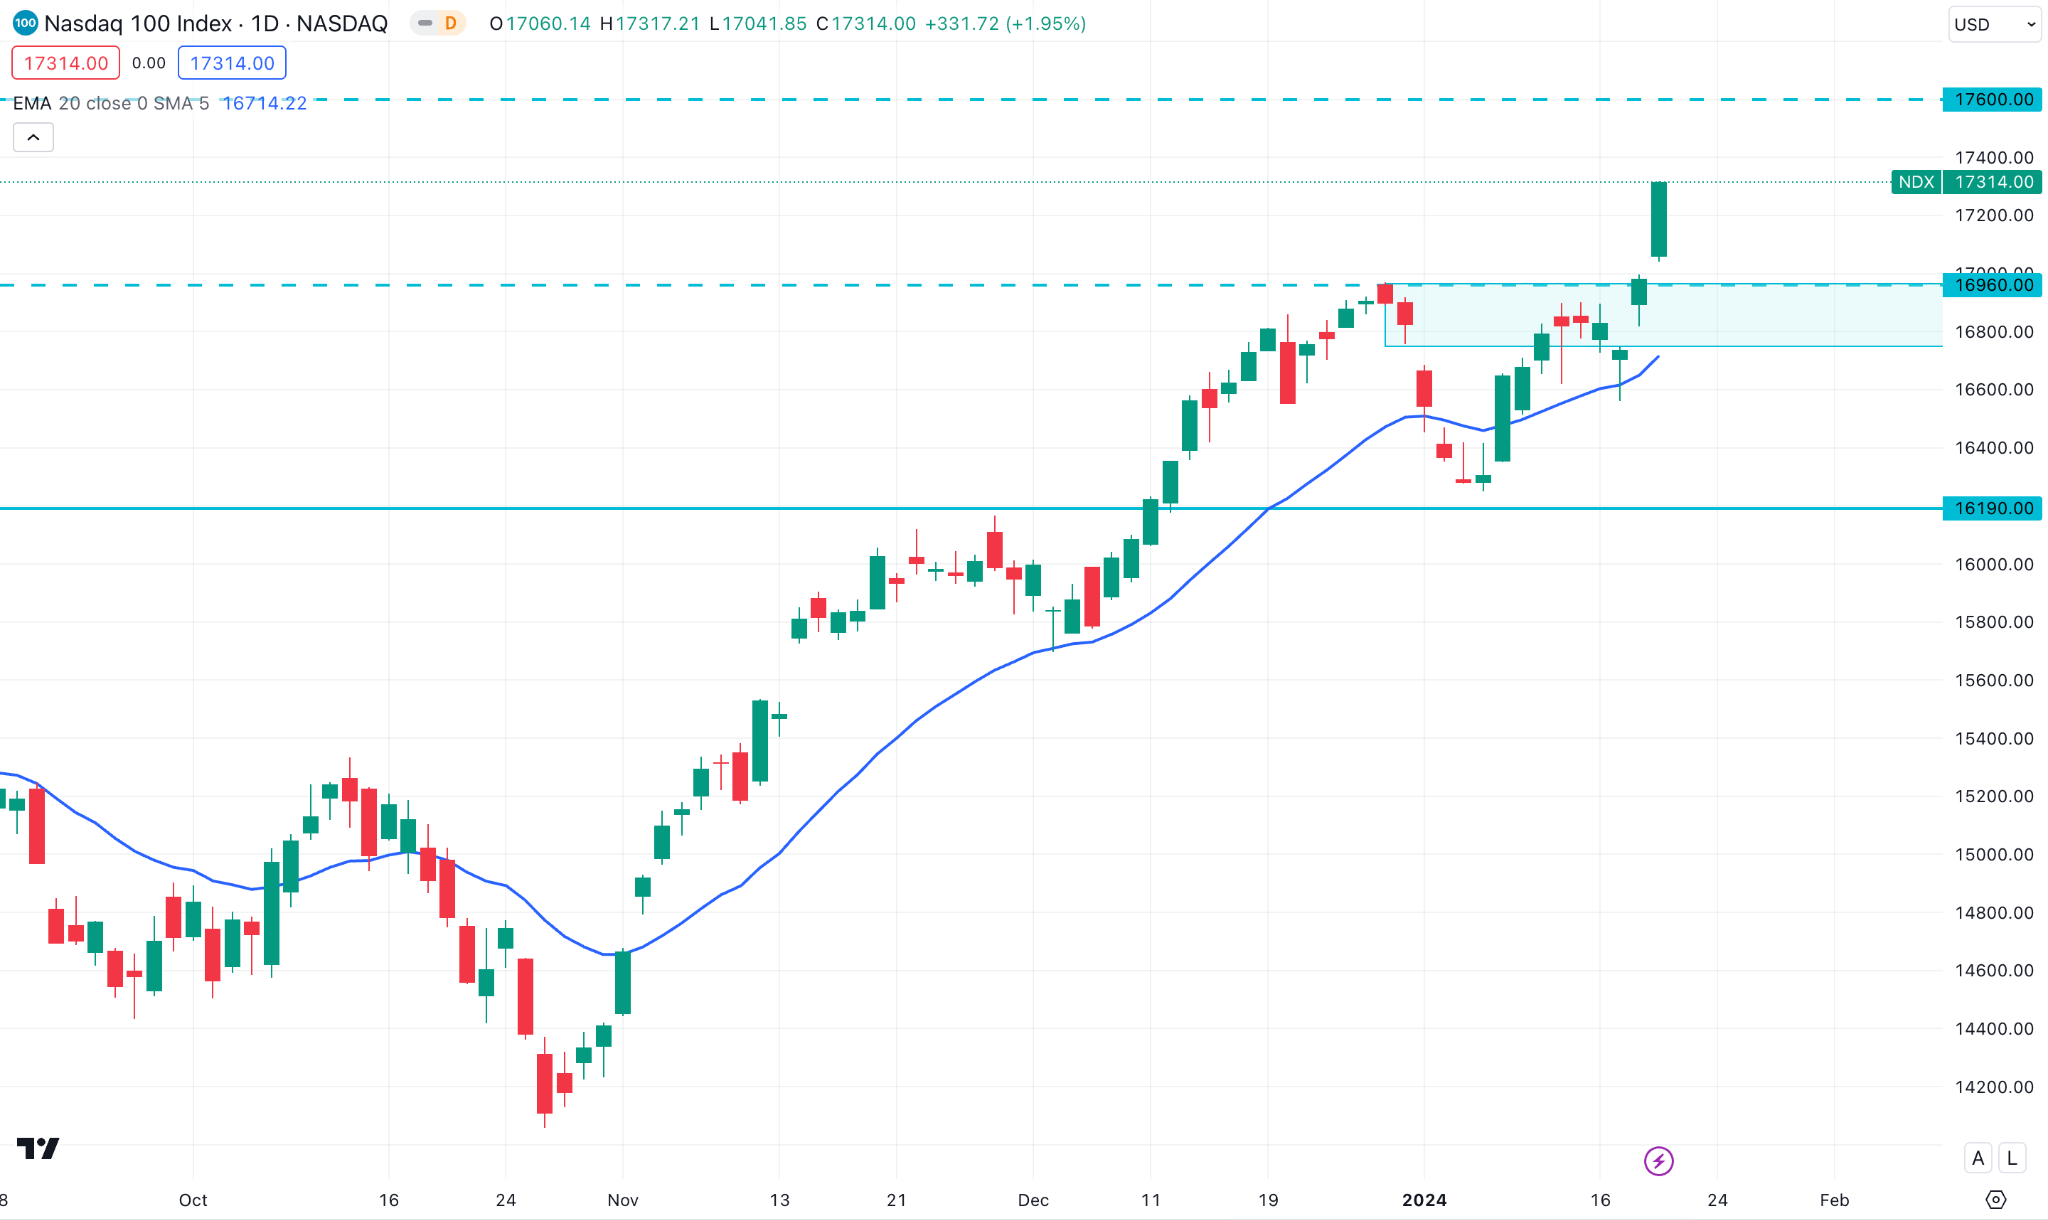
Source: TradingView
NAS100 hit an all-time high of $17336 and had a weekly bullish candle close above the $17000.0 psychological level.
In the daily chart, after an impulsive bullish momentum, the price may retrace down to $16965.0 - $16765.0 price area. So, if the price retraces down to the $16965.0 - $16765.0 price area and bounces higher with a daily bullish candle close, bulls may continue the bullish trend toward the $17600.0 price area in the days ahead.
From a bearish perspective, if the price breaks below the $16765.0 price area with a daily bearish candle close, bears may take over the market and push the price down to the $16200.0 price area.
S&P500 (SPX500)
Fundamental Perspective
The S&P 500 is subject to a variety of factors that might impact its performance as the week of January 22–26, 2024 approaches. An overall hopeful attitude is bolstered by recent strong corporate earnings reports and economic indicators. Strong consumer spending and improved employment figures are important markers. On the other hand, uncertainty may be introduced by worries about inflation and prospective interest rate changes. Investors looking for insights should keep a close eye on Federal Reserve remarks and data reports. The state of the market may also be impacted by geopolitical changes, particularly in trade relations.
This week will be quite volatile for the S&P 500, so being informed and maintaining flexibility in trading tactics will be necessary.
Technical Perspective
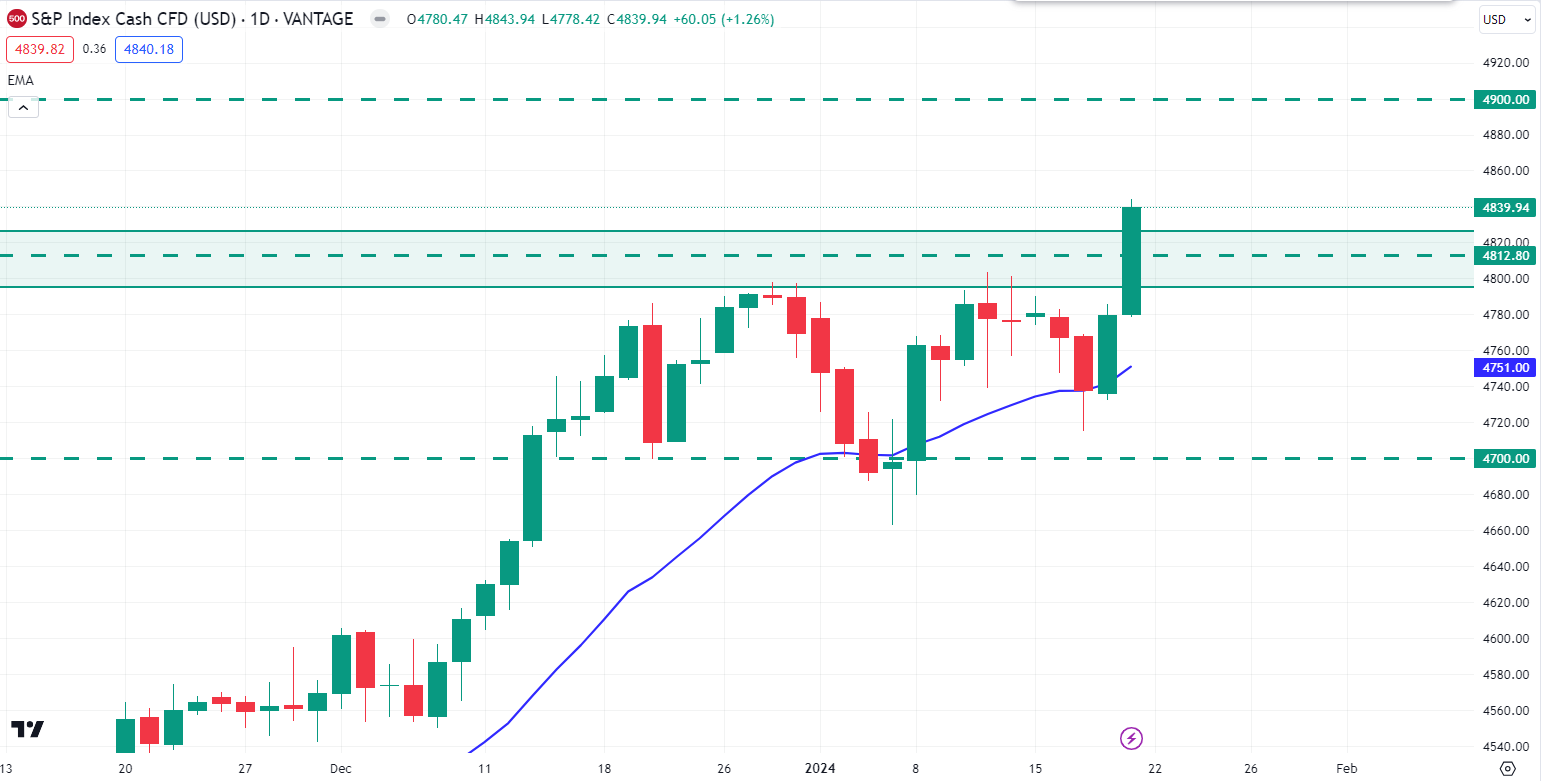
Source: TradingView
In the weekly chart, the S&P 500 price broke an all-time high and maintained a long-term upward trend.
In the daily chart, a downside correction is pending toward the $4812.80 price area before continuing the bullish trend. So, the primary trading idea could be to find a retrace to the $4812.80 price area. However, a daily bullish candle close from this zone could sustain the trend toward the $4900.00 key price area.
On the other hand, if the price breaks below the $4812.80 price area with an impulsive daily bearish candle close, bears may regain momentum and push the price down to the $4700.00 price area in the days ahead.
Hang Seng Index (HK50)
Fundamental Perspective
In the coming week, the HK50 shows hints of sustainability amid global economic turmoil. Positive momentum has been seen recently, fueled by stronger economic indicators and better trade partnerships. Positive feeling is also fueled by Hong Kong's economic resurgence, which is bolstered by robust retail sales and export data. However, given the possible geopolitical concerns that might affect the market, care is required.
Traders must keep an eye on important economic indicators and be updated on changes in the dynamics of global commerce. During this volatile week, managing the HK50 will require flexibility in trading methods and awareness of outside influences.
Technical Perspective
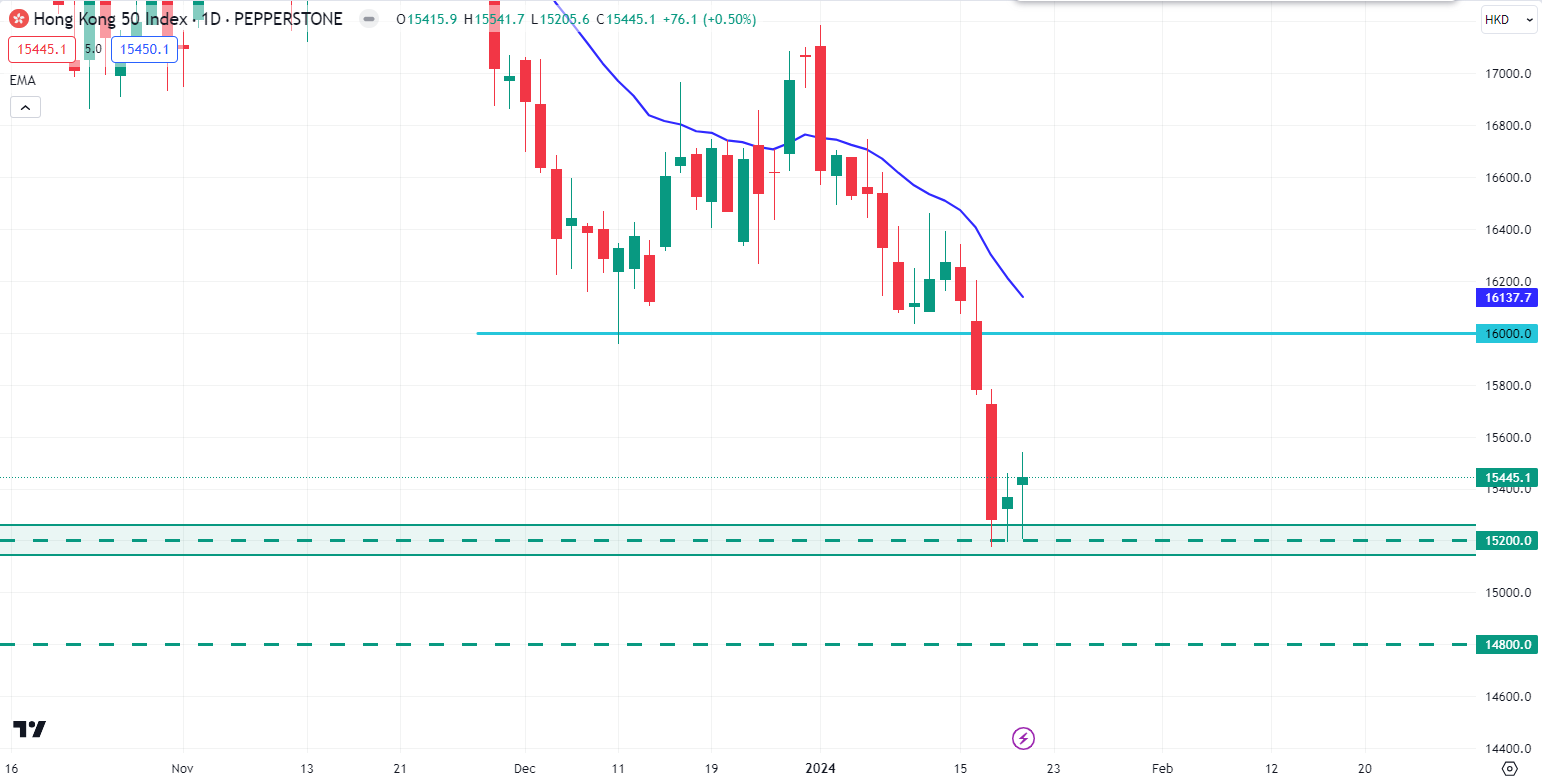
Source: TradingView
HK50 price nose dive below the $15500.0 price level as the overall momentum of the price is still bearish. After rejecting the $17250.0 price area, bears pushed the price down quite impulsively and hit the $15200.0 price area.
As per the daily timeframe, the price had a bullish indecision candle close after bouncing from the $15200.0 price level. So, if the price can break above the indecision candle’s high with a daily bullish candle close, bulls may push the price higher toward the $16000.0 price area in the coming days.
On the bearish side, if the price breaks below the indecision candle’s low and has a daily bearish candle close below the $15200.0 support level, bears may push the price down to the $14800.0 price area in the day ahead.
Bitcoin (BTCUSD)
Fundamental Perspective
Bitcoin saw a capital inflow of $27.5 billion, ranking second among commodity ETFs, just behind Gold. Tether and MicroStrategy, while holding no Ethereum, are consistently increasing their Bitcoin holdings. Despite institutional accumulation, the Bitcoin price dropped to $41,148 on Friday.
As of now, Bitcoin's price remains at $41,148, and institutions like Tether and MicroStrategy continue to focus on accumulating BTC. Bitcoin ETFs have become the second-largest commodity, surpassing Silver, although they haven't sparked a rally in Bitcoin's price. The dominance of Bitcoin is decreasing, with altcoins gaining momentum in the current cycle.
The approval of Bitcoin ETFs by the US Securities and Exchange Commission (SEC) attracted institutional investors. Both Tether and MicroStrategy, holding no Ethereum, are actively adding BTC to their portfolios. BTC ETFs are currently valued at $27.5 billion, outpacing Silver's $11.5 billion and approaching Gold's $96 billion.
Technical Perspective
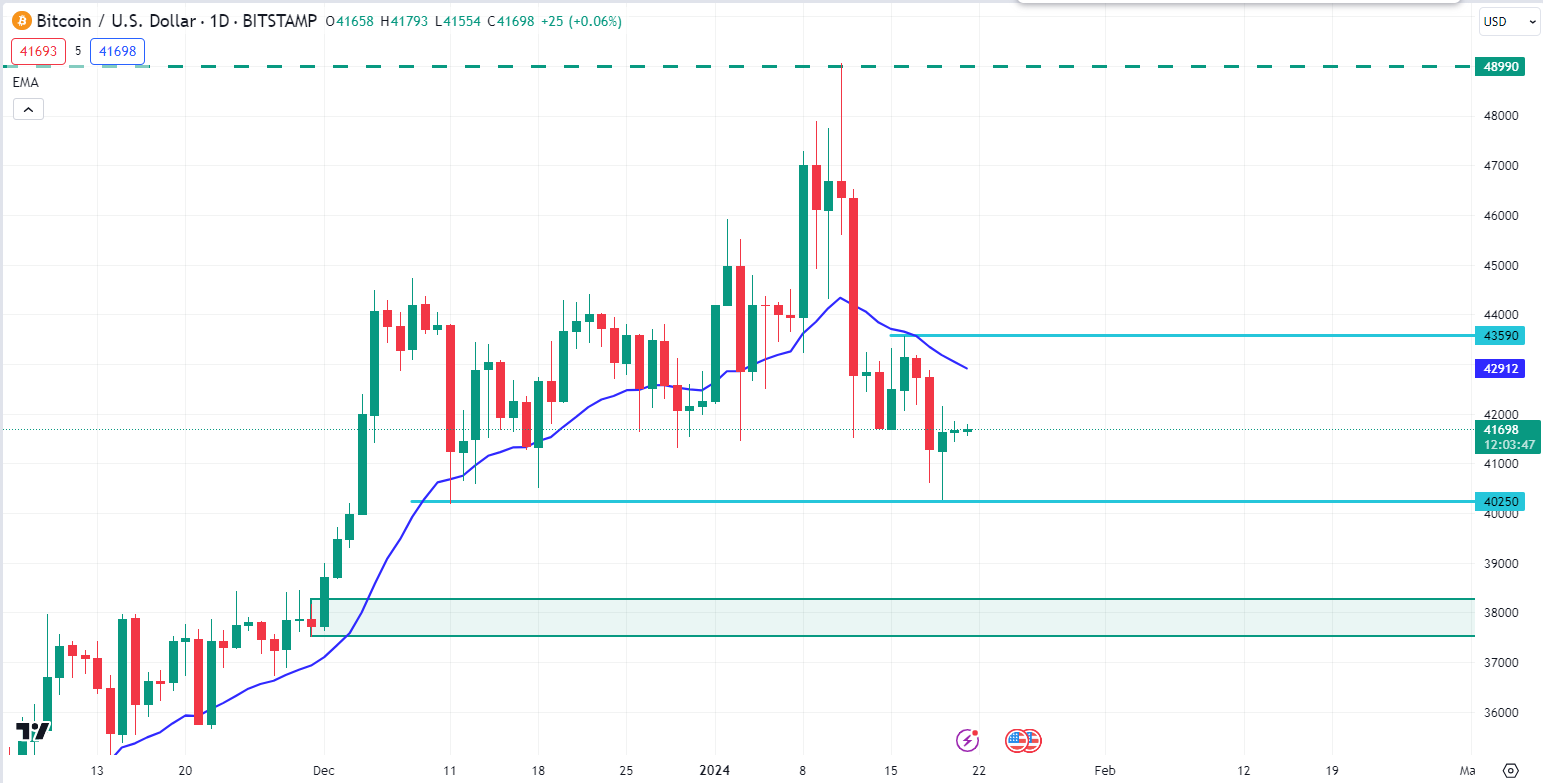
Source: TradingView
After an impulsive bearish pin bar close BTC bears failed to push the price further lower and had an indecision candle close inside the bearish pin bar last week.
In the daily chart, the BTC price is residing below the dynamic level of 20 EMA, which indicates that momentum on the daily chart is still bearish. So, if the price can break below the daily bullish pin bar low and close below the $40250 price area, bears may push the price lower toward the demand zone area, which is around the $38000 price level.
On the contrary, if the price pushes further higher and breaks above the $43590 price area, bulls may continue the bullish pressure toward the $47000 price area.
Ethereum (ETHUSD)
Fundamental Perspective
The Securities and Exchange Commission (SEC) has postponed its decision on Fidelity's Ethereum ETF, according to a recent filing. Despite the approval of the Bitcoin ETF setting a precedent, the SEC mentioned the need for more time to consider the issues raised during the evaluation. As expected from past responses, the new deadline is now March 8.
Ethereum's price remained at around $2,450, unaffected by the decision, but it is struggling to regain strength to reach $2,500. After a lengthy battle over the approval of the Bitcoin ETF, the SEC seemed to have set a precedent for such exchange-traded products (ETP). However, Ethereum now faces a similar situation as the SEC steps back after rejecting the spot ETH ETF application.
The SEC's decision delay was announced in a recent filing, and the final deadline is set for March 8, with a potential extension considering the current circumstances. There is a possibility that the SEC might not obstruct the process this time, possibly influenced by its legal encounters last year, notably Grayscale's lawsuit against the regulator.
Technical Perspective
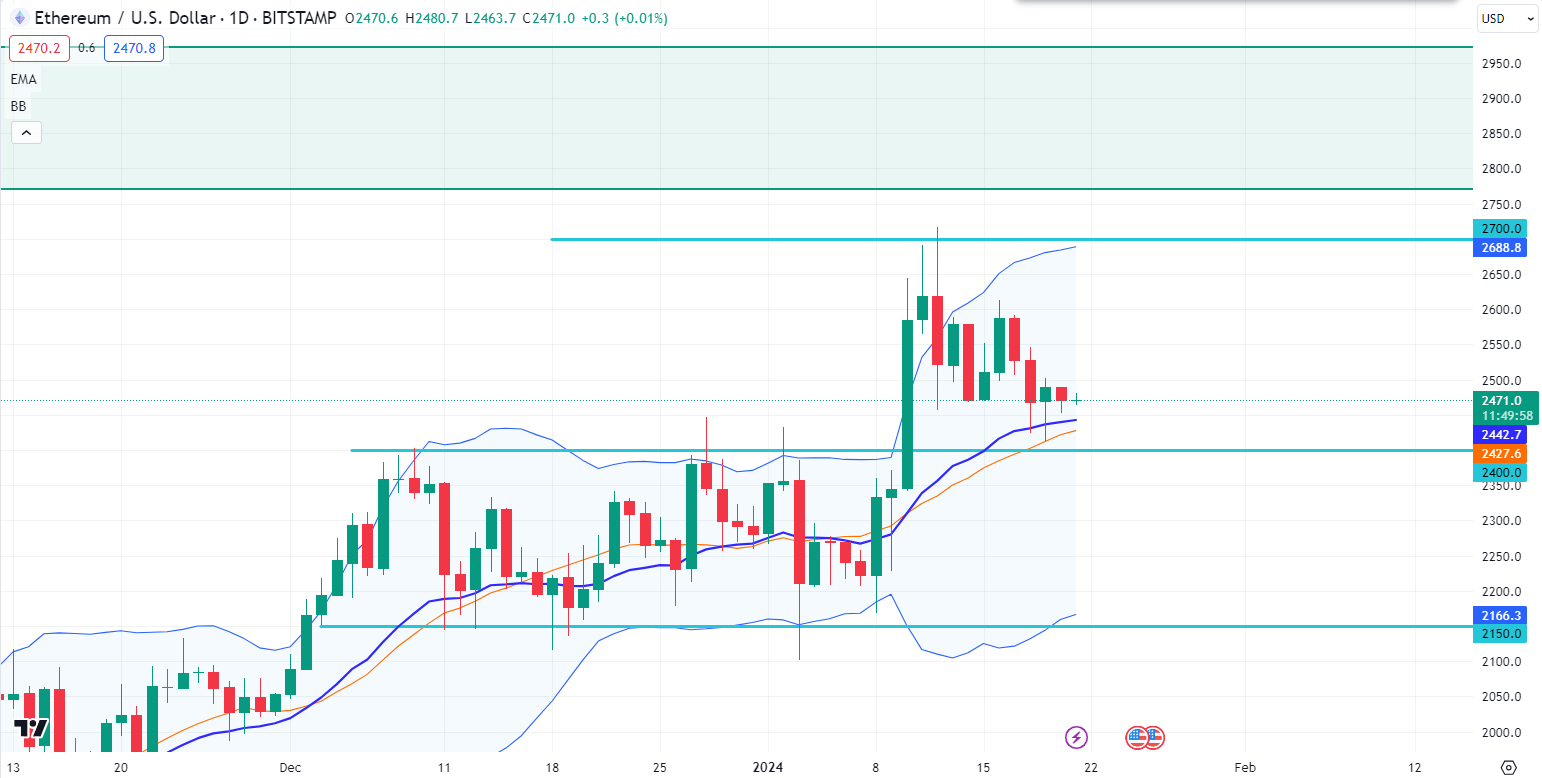
Source: TradingView
The ETH price faced strong rejection from the $2700.0 price area and had a weekly candle close below it. However, the price has broken the range of $2150.0 - 2400.0 price area.
As the price broke the $2400.0 resistance level with a strong daily bullish candle close, there is a chance that ETH may continue further higher. So, if the price can break above the $2700.0 price area with an impulsive daily bullish candle, bulls may push the price higher toward the $2900.0 supply zone area.
On the other hand, if the price breaks below the Bollinger Band's middle band with a daily bearish candle close, bears may regain momentum and push the price lower toward the $2150.0 price area again in the coming days.
Tesla Stock (TSLA)
Fundamental Perspective
A fascinating week is ahead for Tesla (TSLA) as fresh revelations come to light. Positive feelings are still strong in the media about the massive electric vehicle (EV) industry. Investor confidence is still high due to Elon Musk's emphasis on technology improvements, including in artificial intelligence and self-driving capabilities.
Notwithstanding, there are still obstacles to overcome, such as problems with the global car supply chain. The stock of TSLA may be volatile due to changes in regulations and macroeconomic conditions. Pay attention to any announcements on the launch of new products as well as quarterly financial reports. Its success will also be impacted by global EV trends and Tesla's placement in the market.
As always, before making any decisions, prospective investors should do extensive research and take into account both short-term volatility and long-term development prospects.
Technical Perspective
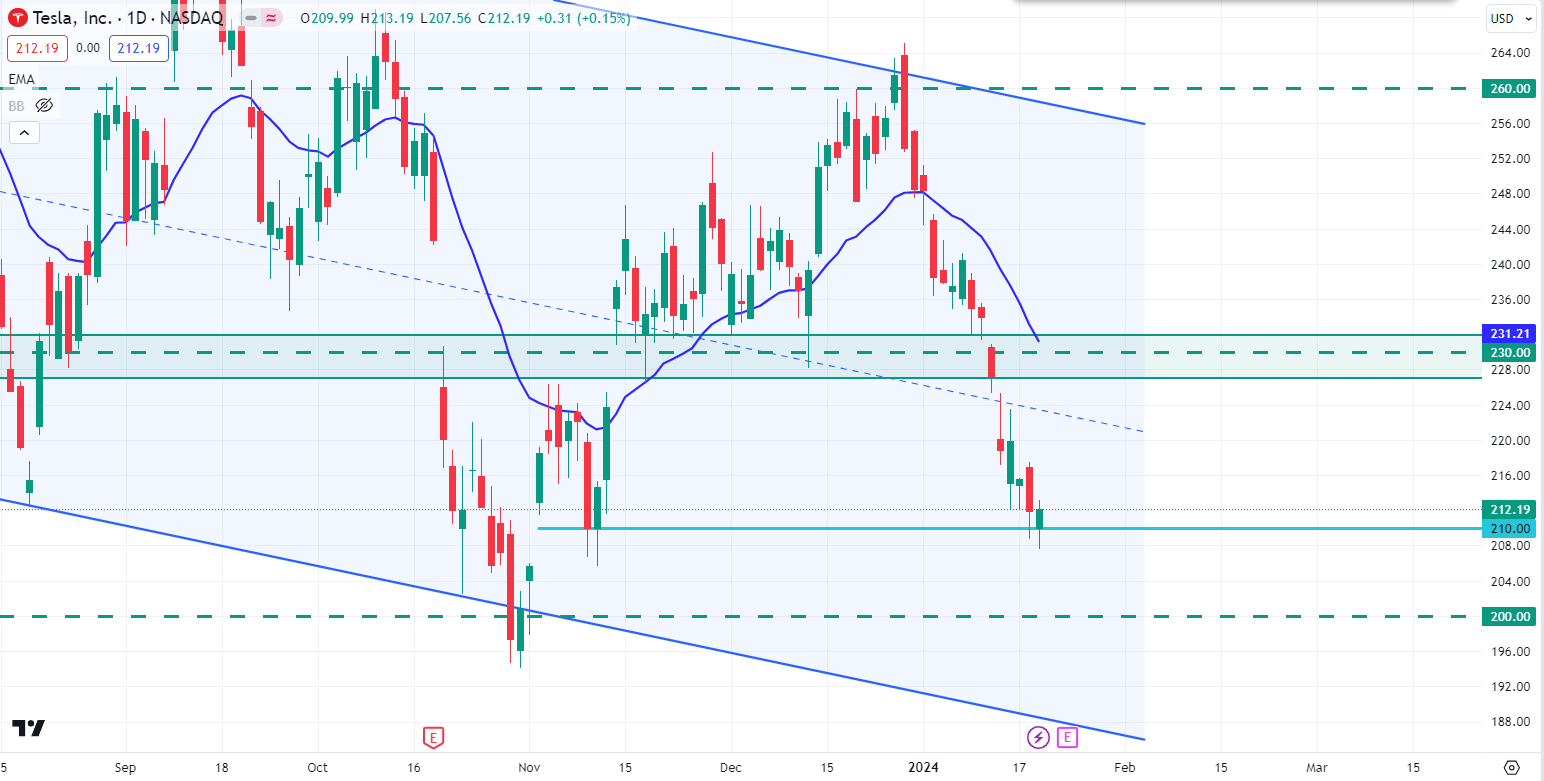
Source: TradingView
TSLA stock price dropped to the $210.00 price area without a retracement. However, the price is still trading inside the bearish channel on the weekly chart.
In the daily chart, the price had a daily bullish pin bar close after bouncing from the $210.00 psychological price area. So, if the price can break above the pin bar’s high there is a high chance that TSLA stock may recover higher toward the $230.00 resistance area in the coming days.
On the bearish side, if the price retraces toward the $230.00 price area and rejects with an impulsive daily bearish candle close, bears may sustain the bearish bias toward the $210.00 price area as a first target. Our second target will be a $200.00 price area.
GOLD (XAUUSD)
Fundamental Perspective
The week started on a downbeat note for gold as demand for the US Dollar surged, and US yields rose strongly. Disappointing Chinese data reinforced doubts about an economic recovery in China, causing both gold and risk-related assets to decline. This decline coincided with the US Dollar gaining momentum and reaching yearly peaks around 103.70 on January 17.
Another factor impacting gold was the ongoing strength of the US economy, supported by robust data readings, including better-than-expected Retail Sales, Industrial Production, and the Philly Fed Manufacturing gauge. These positive readings led to a reconsideration of bets on a potential interest rate cut by the Federal Reserve in March.
Technical Perspective
Source: TradingView
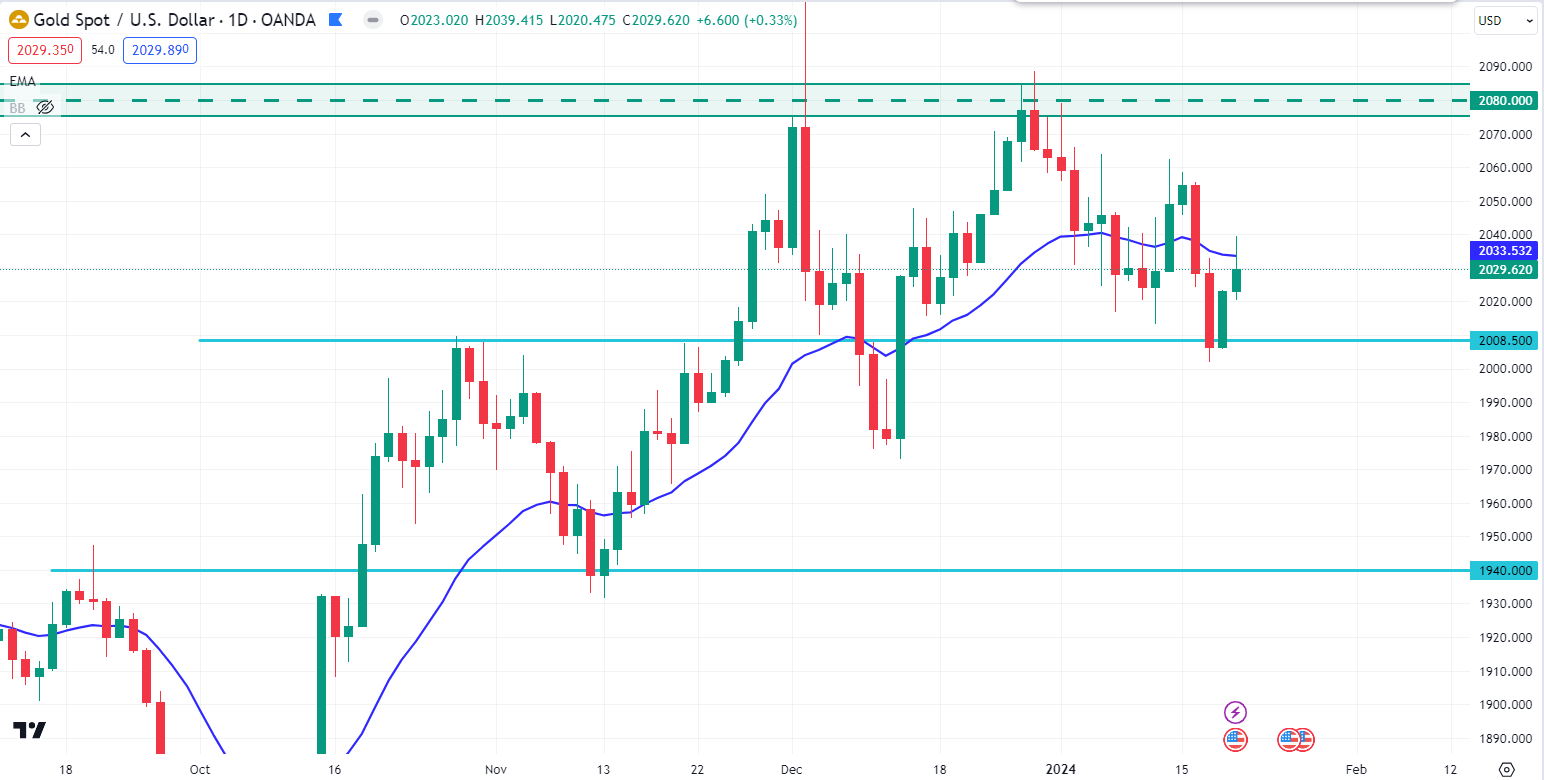
Gold price is still trading inside the bearish mother bar on the weekly chart. However, bulls are still optimistic as the dynamic level of 20 EMA is holding the price as strong support.
Based on the daily chart, the price bounced from the $2008.50 support level and had two consecutive bullish candle closes. As per the current situation, if the price can break above the 20 EMA with a daily bullish candle close, bulls may sustain the bullish pressure toward the $2080.00 resistance area in the coming days.
On the contrary, if the price rejects the 20 EMA and has a close below the $2008.50 support level, bears may regain momentum and push the price down to the $1940.00 price area.
WTI Crude Oil (USOUSD)
Fundamental Perspective
Crude oil markets reached a new high for the week before settling back on Friday. West Texas Intermediate (WTI) crude oil fluctuated between $74.50 and $73.00. The week saw a mix of ups and downs, with WTI settling near $73.60, showing a 5.6% or $3 spread between the late peak on Friday at $74.60 and Wednesday's weekly low at $70.62.
Concerns about production caps from the Organization of the Petroleum Exporting Countries (OPEC) that troubled energy markets in the third quarter of 2023 have mostly disappeared. Instead, worries have shifted to Iran-backed Houthi rebels attacking ships in the Red Sea, raising concerns about global supply lines between Europe and Asia. Despite the bullish crude oil prices due to supply concerns, there is significant downside pressure. The US has achieved record levels of crude oil production in 2023, and there are expectations of continued growth in barrel output. Canada is also poised to reach new production highs, especially as the Trans Mountain pipeline nears completion, making it easier to transport crude oil to the US.
Technical Perspective
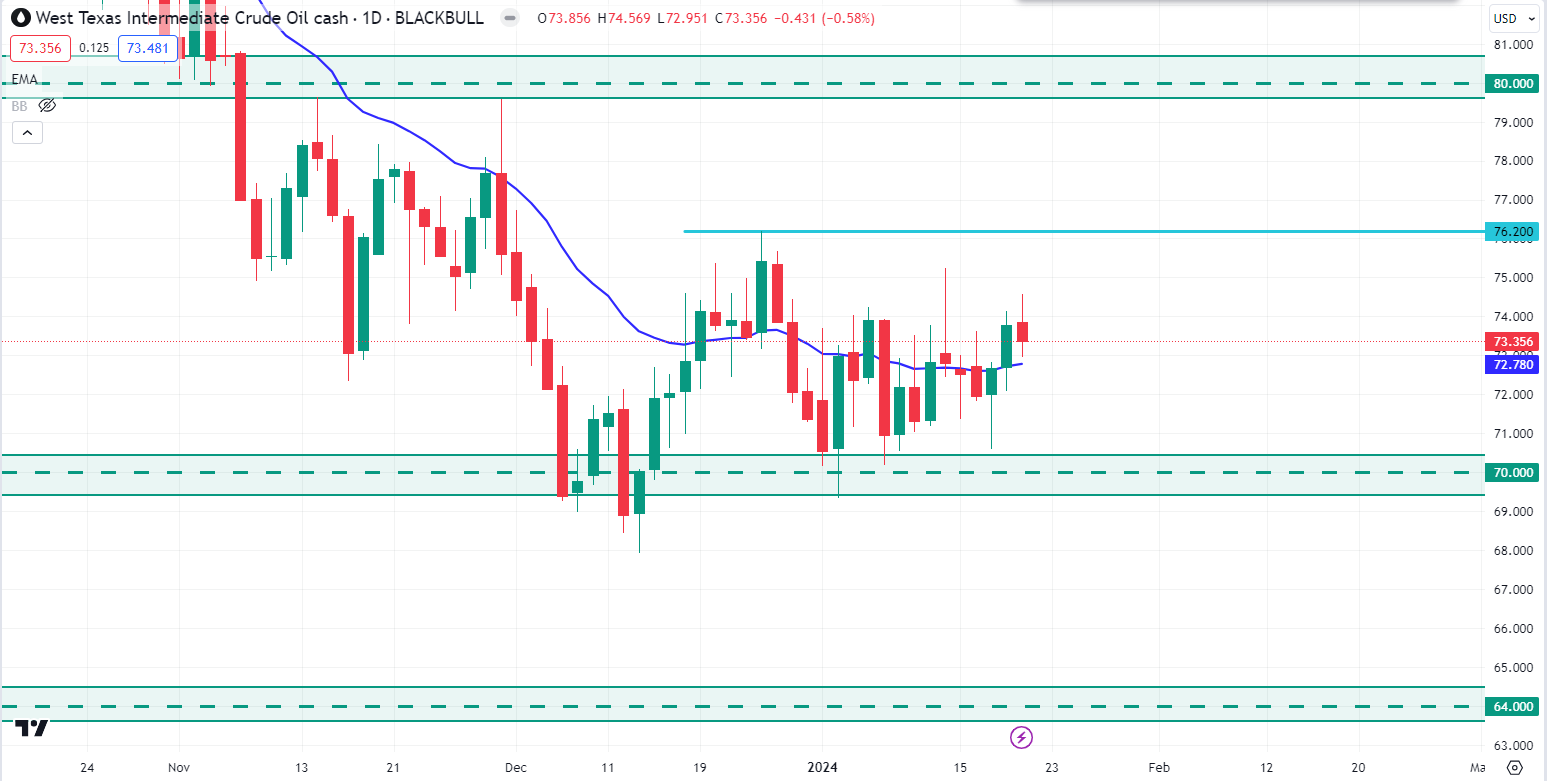
Oil price is still ranging between $70.00 - $76.20 price area on the weekly chart. Bears tried several times to break below the $70.00 support level but failed every time and had a bullish indecision candle close above it last week.
Source: TradingView
On the daily timeframe, if the bulls can push the price further higher and break above the $76.20 resistance level with a daily bullish candle close, the Oil price may recover higher toward the $80.00 price area.
From the bearish perspective, if the price can break below the $70.00 support level with a daily bearish candle close, bears may continue further down toward the $64.00 price area in the coming days.


