
EURUSD
Fundamental Perspective
Before the announcement of the US Consumer Price Index (CPI), the US Dollar was lower as investors anticipated softer numbers to justify prospective rate reduction by the Federal Reserve (Fed). The December CPI, which came in at 3.4% YoY and 0.3% MoM, beat forecasts. Core annual inflation fell to 3.9% from 4%, which was still higher than the projected 3.8%. The US Dollar and bond rates rose, initially raising fears about rate cuts, while equities fell. But speculative interest changed its mind and started to bet on a rate drop as early as March. The US Producer Price Index (PPI), issued on Friday, showed a 0.1% MoM decrease and a 1.0% YoY increase in December, less than expected. The core annual rate was 1.8%, less than the 1.9% predicted and the 2% before.
However, the Euro could not take advantage of the early weakness of the USD. Inconsistent European statistics suggested a longer recovery path. Though European Central Bank (ECB) spokespeople delivered generally hawkish statements, they failed to bolster the common currency. Notably, ECB policymaker Francois Villeroy de Galhau stressed that the ECB will wait until inflation expectations are "solidly anchored" at 2% and alluded to a possible rate decrease in 2024, subject to underlying factors.
Technical Perspective
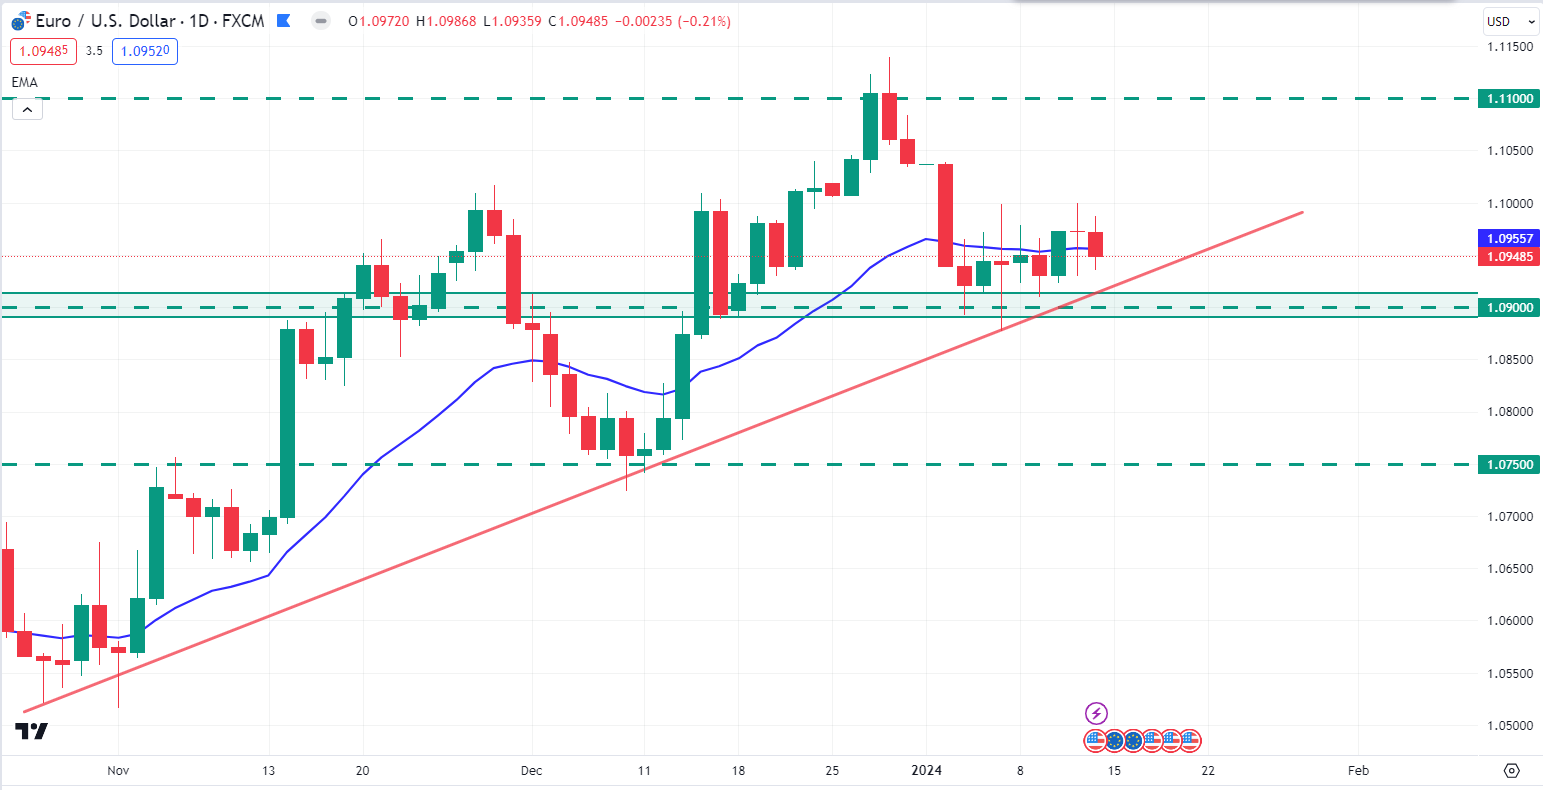
Image: TradingView
In the weekly chart, EURUSD bears struggled to break below the 1.0900 price area and had a weekly indecision candle close.
The price has bounced from the daily bullish trend line, signalling buyers’ presence in the market. So, if the price can have an strong daily bullish candle above the 20 DMA, bulls may sustain the upward bias toward the 1.1100 price area.
On the bearish outlook, a break below the bullish trend line with a daily close may regain momentum and push the price down to the 1.0750 price area in the days ahead.
GBPJPY
Fundamental Perspective
The GBP/JPY fell on Friday, retreating from the weekly high 186.17. This resulted from the Japanese Yen (JPY) seeing a rise in demand and the Pound Sterling (GBP) generally weakening. Japan's current account showed less growth than anticipated on Friday, with net exports and imports for November coming in at ¥1,925.6 billion, below October's ¥2,582.8 billion and below the projection of ¥2,385.1 billion.
On Friday, the UK Manufacturing & Industrial Production report had conflicting findings. MoM Manufacturing Production did not meet yearly projections in November, although it slightly surpassed expectations. YoY Industrial Production fell in the interim. The Gross Domestic Product (GDP) of the United Kingdom increased by 0.3% in November, above forecasts and reversing a 0.3% decline in October.
Technical Perspective
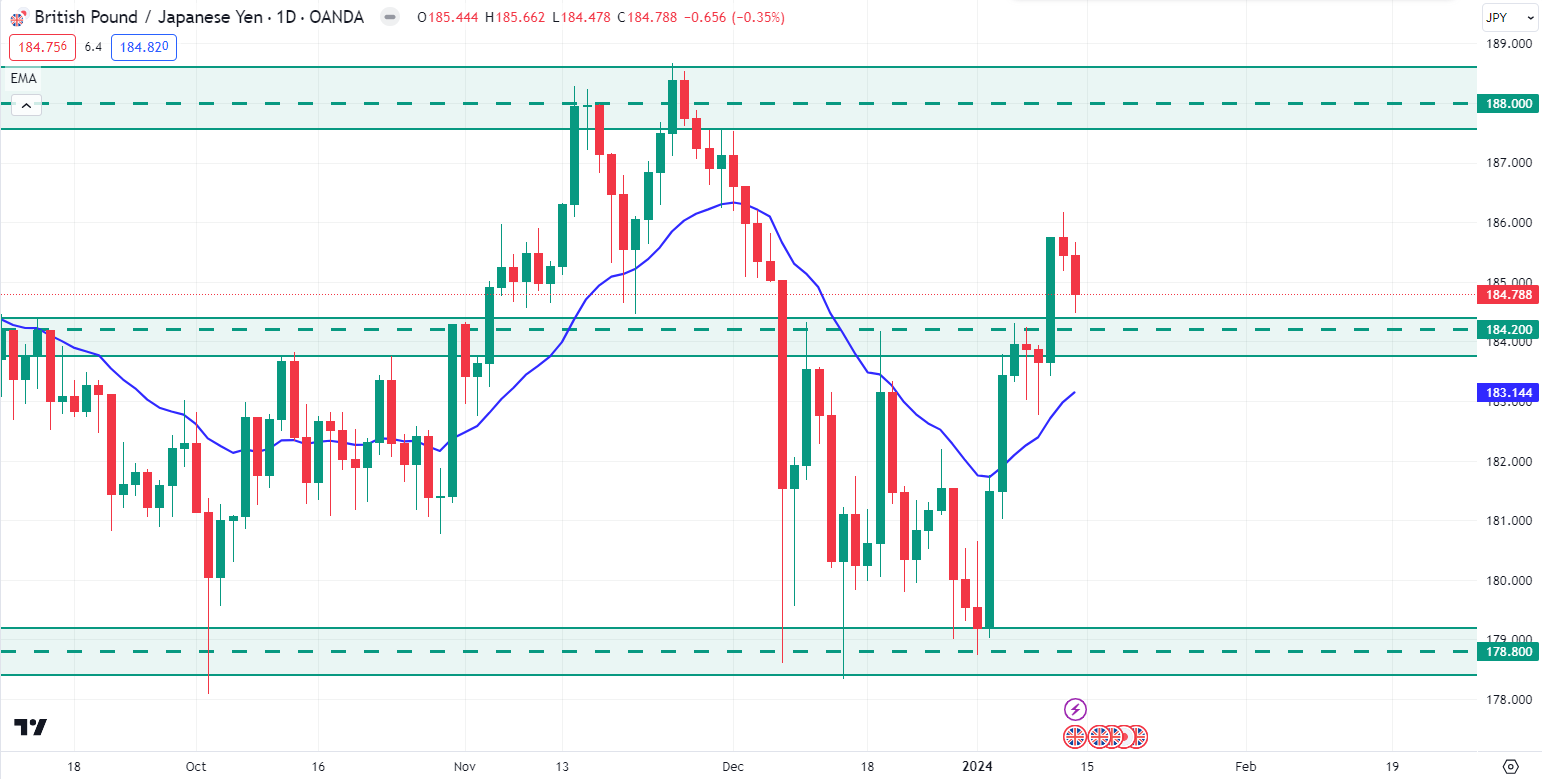
Image: TradingView
In the weekly outlook, GBPJPY bulls pushed the price higher and had a weekly bullish candle close above the 184.20 psychological event level.
In the daily chart, the price may retrace down to the 184.20 support level. So, if the price retraces down to the 184.20 support area and bounces with a daily bullish candle close, bulls may recover higher toward the 188.00 price area in the days ahead.
On the bearish side, if the price breaks below the 184.20 support level and has a daily bearish candle close below the 20 EMA, bears may regain momentum and push the price down to the 178.80 price area.
Nasdaq 100 (NAS100)
Fundamental Perspective
The week of January 15–19, 2024, is scheduled to be quite exciting for the NASDAQ 100 (NAS100). According to recent market reports, positive IT sector momentum and impressive corporate results are driving an optimistic outlook. To keep an eye on important economic indicators that might affect the index, investors are urged to keep an eye on employment statistics and inflation rates. Furthermore, the NAS100 might be impacted by changes in the dynamics of global commerce. Nonetheless, market players watch for possible chances as the economy revives, exhibiting cautious optimism. Investors navigating the NAS100 environment in the coming week will need to pay close attention to these variables.
Technical Perspective
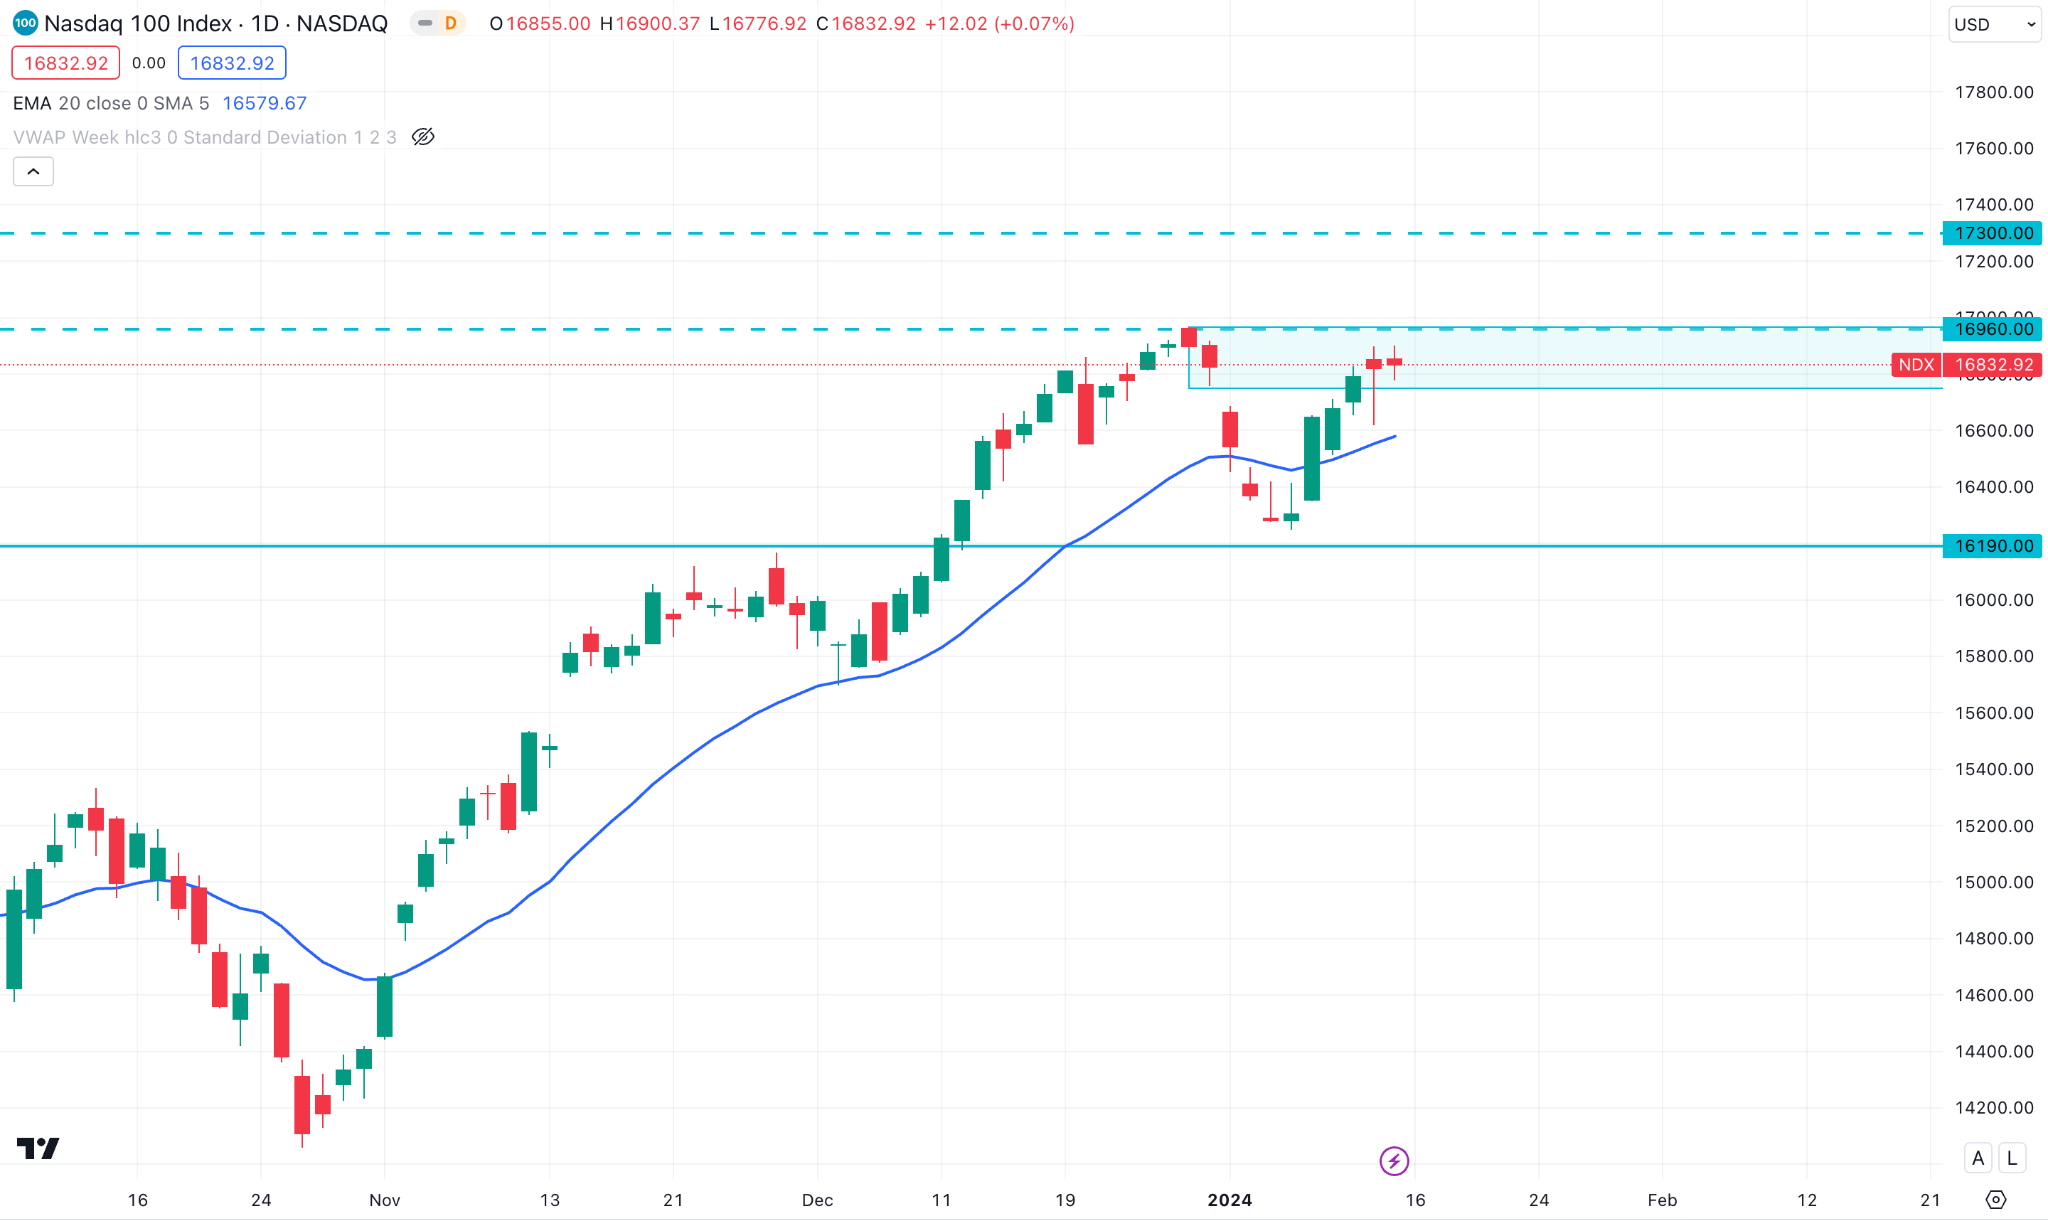
Image: TradingView
In the weekly timeframe, NAS100 bulls are still optimistic as the price found support around the $16190.0 area. However, the price is still residing inside the last weekly bearish mother candle.
In the daily chart, the NAS100 price was rejected from the daily supply zone area and had a daily indecision candle close last Friday. As per the current price action, if the price can have a daily bearish candle close below the indecision candle low, bears may regain momentum and push the price downward toward the $16190.0 support level in the coming days.
On the bullish side, if the price breaks above the $16960.0 resistance area with a daily bullish candle close, bulls may sustain the bullish trend toward the $17300.0 key level in the days ahead.
S&P500 (SPX500)
Fundamental Perspective
The S&P 500 is preparing for an important week that will take place from January 15–19, 2024. The most recent market insights point to a promising future, supported by solid company profits and hope for an economic rebound. With forecasts of stable growth, investors are keenly monitoring central bank announcements and critical economic data. But be cautious—global tensions may introduce volatility. Performance in the IT industry and inflationary pressures are also important to consider. Remaining aware of these variables throughout the week will be essential for investors who want to understand the dynamics shaping the S&P 500's future course.
Technical Perspective
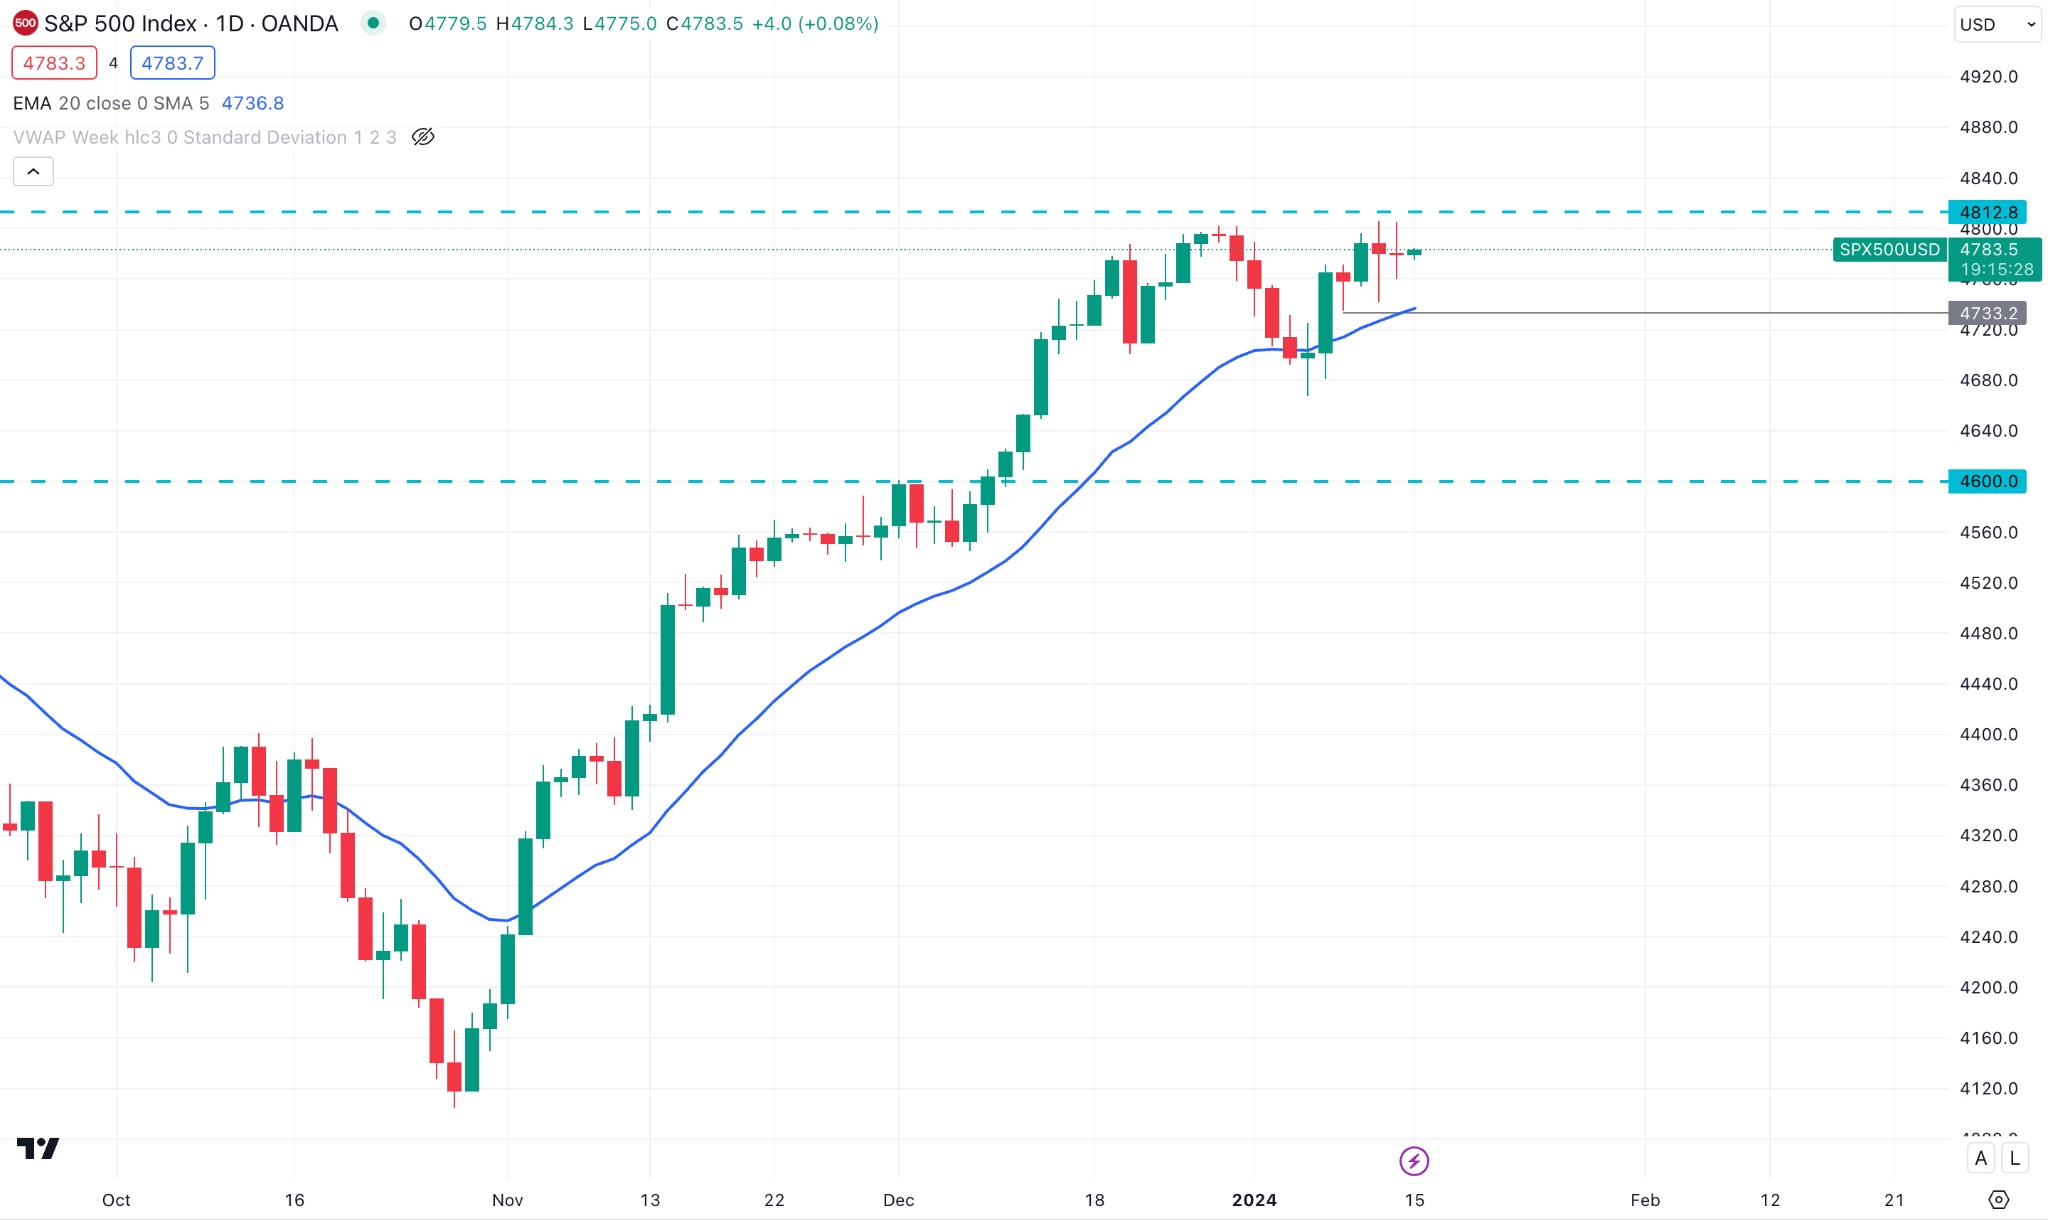
Image: TradingView
The S&P 500 price still resides in the weekly order block area in the weekly outlook. However, bulls are still optimistic about continuing further higher.
In the daily timeframe, if bulls continue further higher and break above the $4812.80 resistance area with a daily bullish candle close, the S&P500 price a strike further upward toward the $4900.00 key price area in the coming days.
On the other hand, if the price breaks below the last daily bullish candle’s low with a daily bearish candle close, bears may regain momentum and push the price down to the $4600.00 price area.
Hang Seng Index (HK50)
Fundamental Perspective
From January 15th to January 19th, 2024, the Hong Kong Hang Seng Index (HK50) is expected to have a thrilling week. The most recent data shows that market sentiment has been cautiously optimistic recently. The index is anticipated to benefit from encouraging signals from international markets and better trade connections. Regarding potential sources of volatility, investors are cautioned to keep an eye on remarks from central banks and geopolitical developments. Furthermore, individual equities may be impacted by economic indices and business earnings reports. The performance of the HK50 is closely associated with both domestic and international economic trends, so investors should be closely monitoring developments throughout the course of the next week.
Technical Perspective
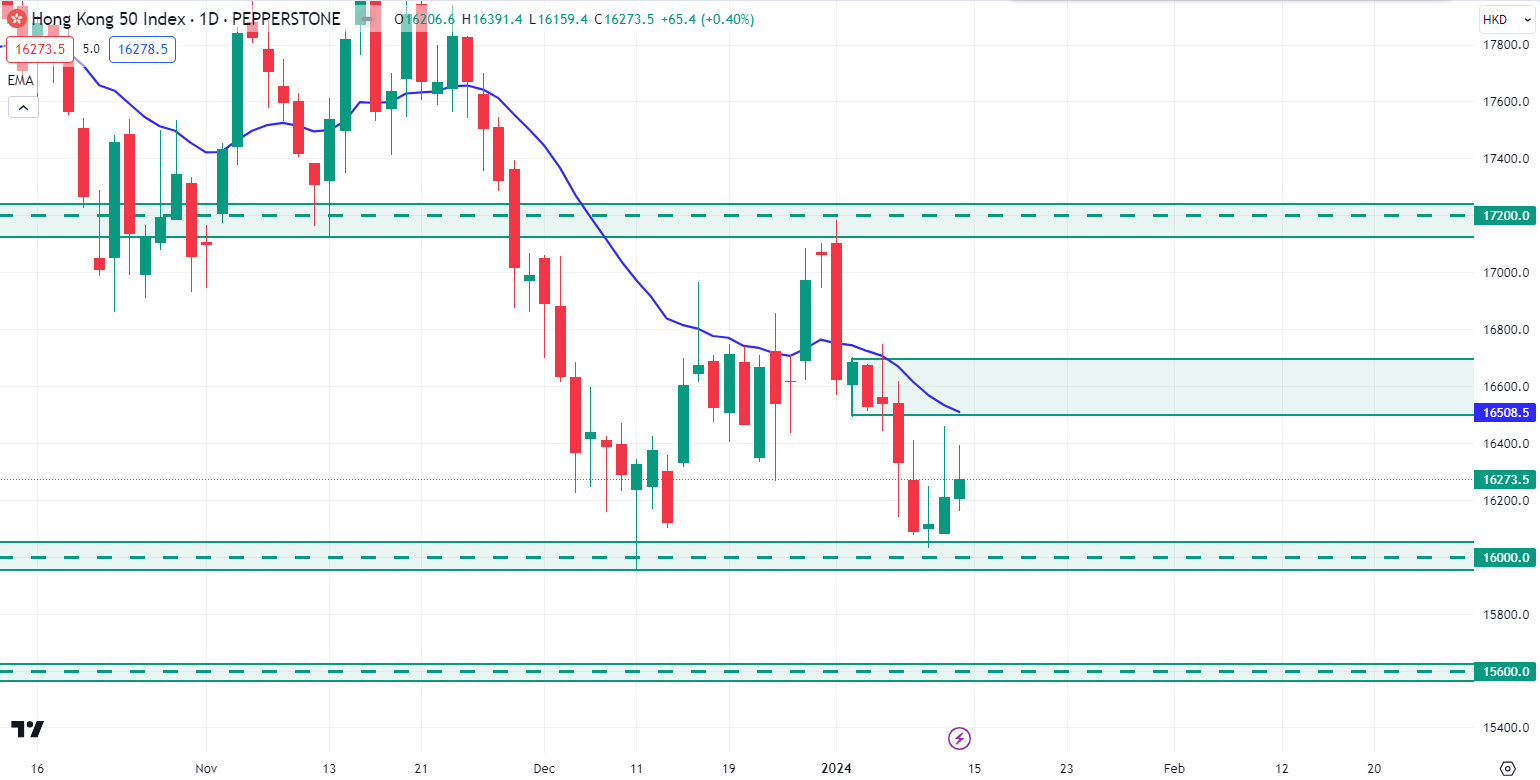
Image: TradingView
In the weekly chart, the HK50 price is still residing above the $16000.0 psychological support area. However, the overall momentum of the market is still bearish.
In the daily timeframe, the HK50 price may retrace upside toward the supply zone area. So, if the price retraces toward the supply zone area and rejects the dynamic level of 20 EMA with a daily bearish candle, bears may push the price down to $16000.0 support area as a first target. Our second target will be a $15600.0 price area.
On the bullish side, if the price breaks above the supply zone area with a daily bullish candle close, bulls may regain momentum and push the price upward toward the $17200.0 resistance area again in the coming days.
Bitcoin (BTCUSD)
Fundamental Perspective
Since the start of spot ETF trading on January 11, the price of bitcoin has seen substantial losses; on Friday, it fell by 8%. The selling down of Grayscale GBTC, which forced holders to use open redemption options, is partly to blame for the fall. Renowned economist warns that Bitcoin owners will have difficulties this weekend due to a 40% drop in trading volume and $13 million in liquidations. $112.84 million from long holdings and $17.57 million from short positions were liquidated. GBTC holders seized the chance to sell, lowering open interest by $1.19 billion. As per Bloomberg, GBTC had an outflow of $484 million, while other ETF players like ARK Invest saw inflows of up to $42.5 million. Analysts predict that selling pressure will persist, especially if new Bitcoin ETFs encounter a major dip on Monday.
Technical Perspective
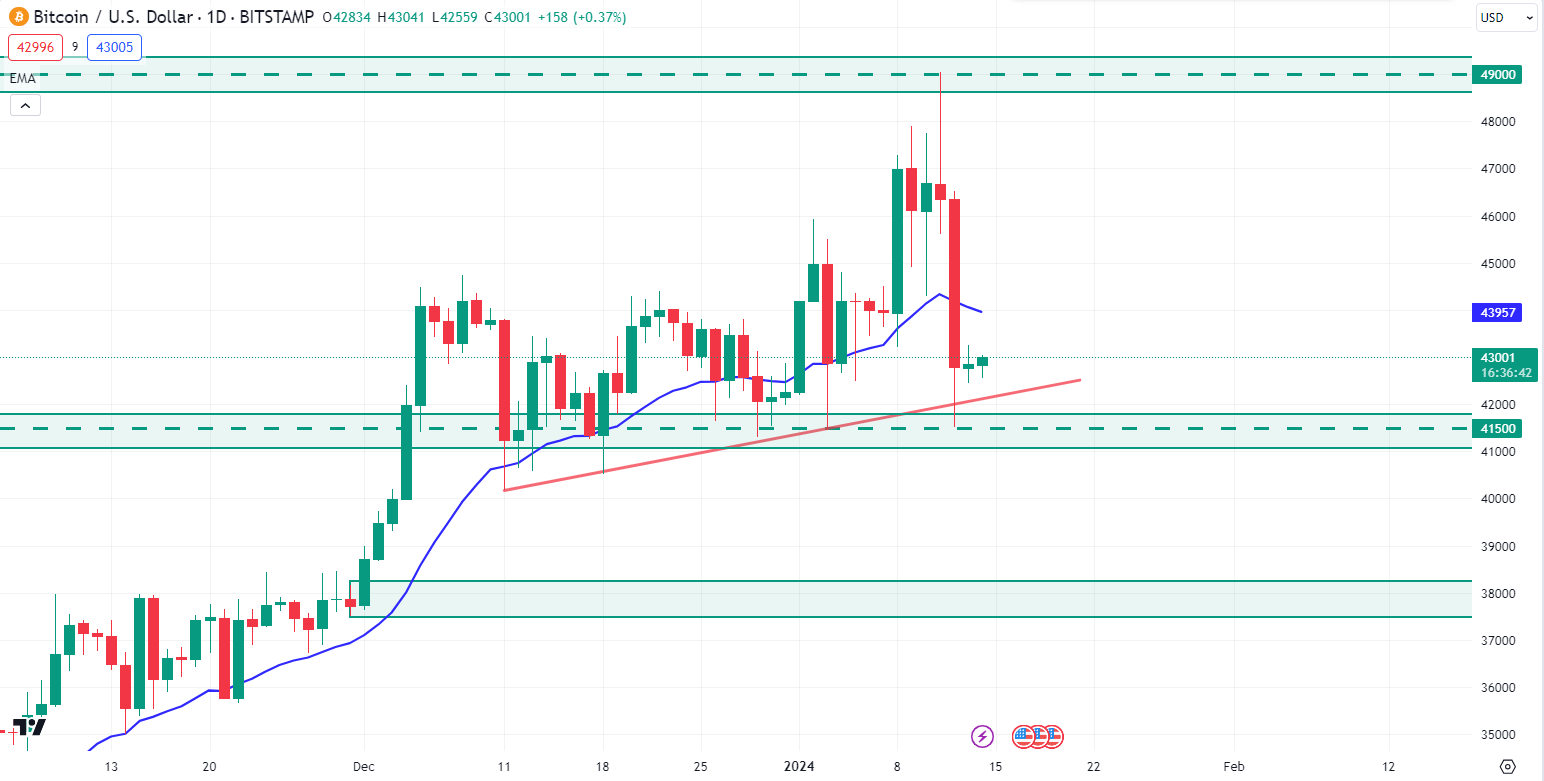
Image: TradingView
In the weekly outlook, BTC has a strong weekly bearish pin bar close after rejecting December 2021’s high. After bouncing from the $41500 support level, bulls impulsively pushed the price higher but failed to continue above the $49000 psychological price area.
In the daily chart, the BTC price found support at the daily bullish trend line. As per the current situation, if the price can break above the dynamic level of 20 EMA with a daily bullish candle close, bulls may push the price higher toward the $49000 price area again in the coming days.
On the bearish side, if the price can break below the bullish trend line and has a daily bearish candle close below the $41500 support level, bears may take over the market and push the price down to the $38000 psychological demand zone area.
Ethereum (ETHUSD)
Fundamental Perspective
Due to a flash loan attack on Wise Lending, 177 ETH is worth of about $464,000 were exploited. Thanks to a precise fund-draining exploit discovered by PeckShield, a blockchain security business, Wise Lending's share accounting logic was flawed. This event is the first exploit of 2024, which manipulates Oracle pricing through the use of a flash loan attack. 9,000 USDC, $2,000 USDT, $5,000 DAI, 18.51 WETH ($47,694), and other tokens associated with Pendle Finance were transferred by the exploiter during the attack, which was carried out through an unconfirmed contract that concluded with "...d82c."
Borrowing 1,110 stETH tokens (about $2.9 million) from the Aave lending protocol, the exploiter leveraged a largely empty market to raise the share price before borrowing most cash in the lending markets.
Technical Perspective
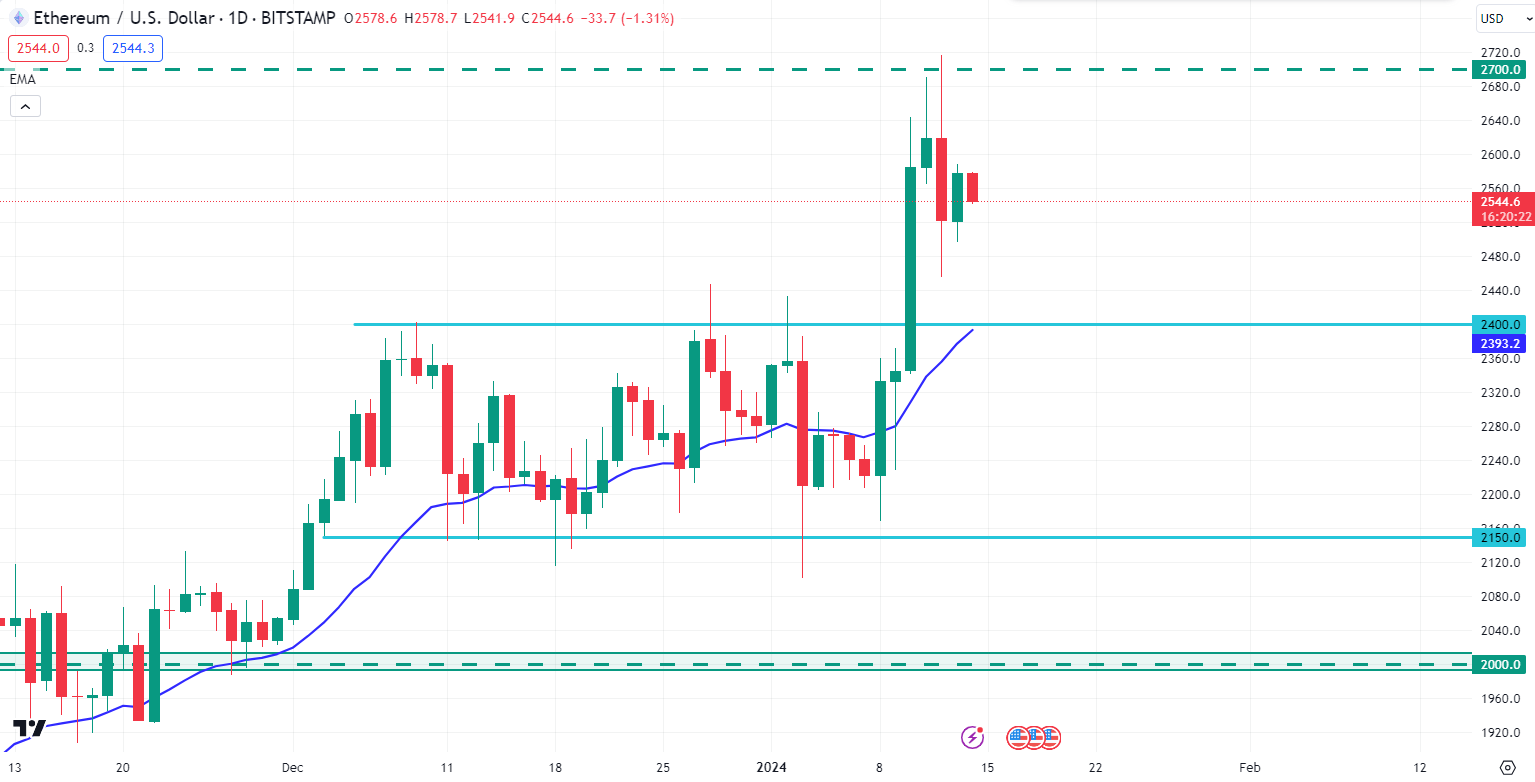
Image: TradingView
In the weekly chart, ETH price broke above the $2400.0 psychological resistance area with a strong weekly bullish candle close.
The price may retrace down to $2400.0 support area in the daily outlook. So, if the price retraces down to the $2400.0 support level and bounces with an impulsive daily bullish candle, bulls may push the price higher toward the $2700.0 price area again in the days ahead.
On the bearish side, if the price can break below the dynamic level of 20 EMA with a daily bearish candle and has a close below the $2400.0 price area, bears may push the price downside toward the $2150.0 price area.
Tesla Stock (TSLA)
Fundamental Perspective
Based on the most recent information available, Tesla (TSLA) is expected to have a very active week beginning on January 15, 2024. Based on the company's impressive Q4 2023 earnings report, which showed increasing production figures and significant revenue growth, analysts forecast a favourable trend. Tesla is in a good position in the industry because of its ongoing innovation in renewable energy and electric car technologies.
Recent alliances with significant IT companies further enhance positive attitudes. Nonetheless, since outside variables like uncertainty in the world economy can affect market behaviour, investors need to remain alert. For well-informed decision-making throughout this thrilling trading week, keeping an eye on real-time market developments is advised.
Technical Perspective
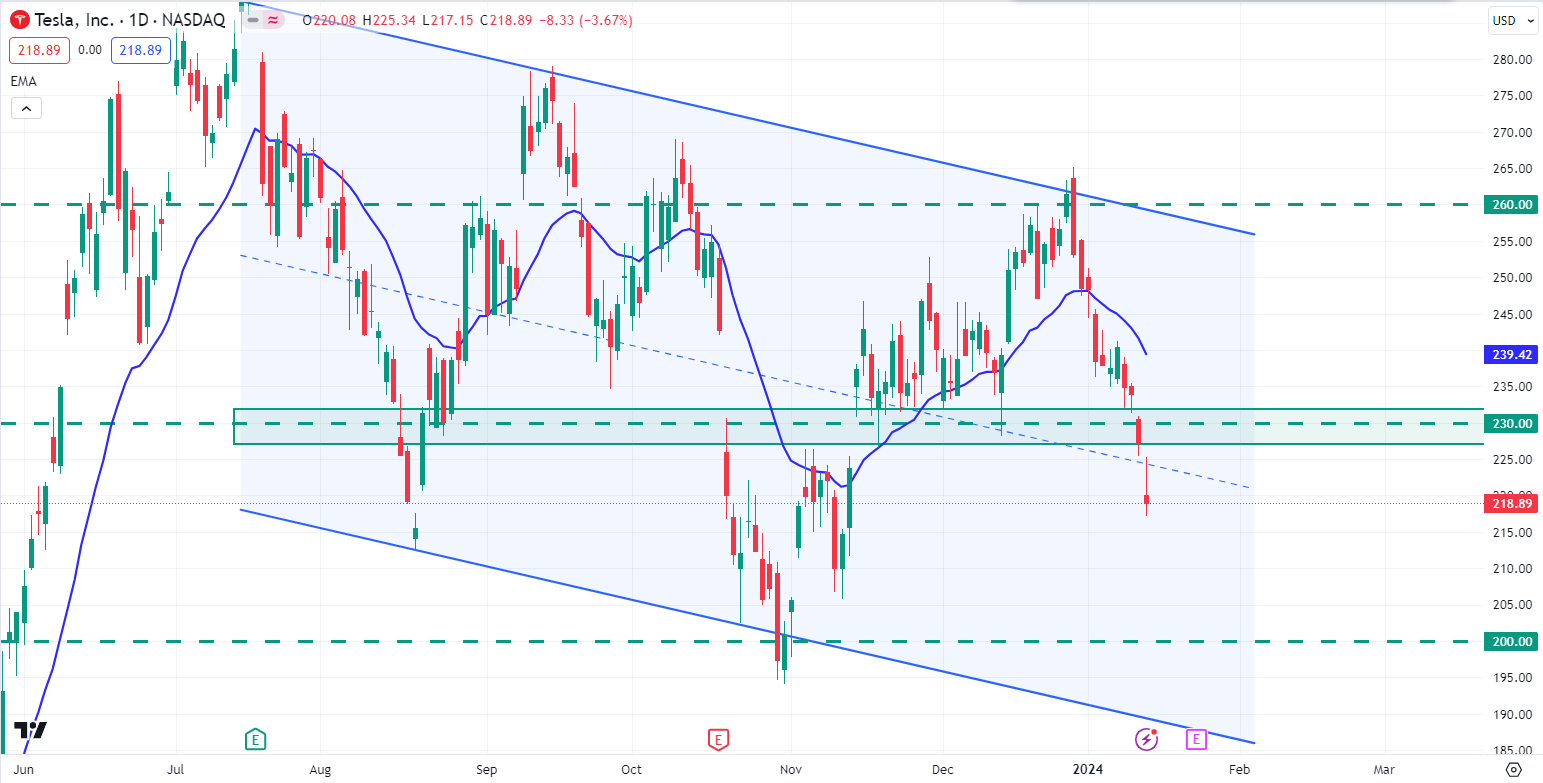
Image: TradingView
In the weekly chart, the TSLA stock price dropped below the $230.00 price area after rejecting the weekly dynamic level of 20 EMA.
In the daily timeframe, the price may retrace upside toward the $230.0 resistance area. So, if the price retraces toward the $230.0 resistance area and rejects with a daily bearish candle close, bears may continue further downside toward the $200.0 psychological support area in the coming days.
On the bullish outlook, if the price breaks above the $230.0 price area and has a daily bullish candle close above the dynamic level of 20 EMA, bulls may regain momentum and push the price higher toward the $260.0 resistance area again.
GOLD (XAUUSD)
Fundamental Perspective
Given that US markets will be closed on Monday in observance of Martin Luther King Jr. Day, gold is predicted to remain steady at the start of the week. Traders observing the Wednesday Asian session will intently observe China's fourth-quarter GDP figures, retail sales, and industrial production. Gold may enjoy an early increase if they point to a robust end to the Chinese economy's year.
US economic calendar highlights on Wednesday and Thursday include December Retail Sales and weekly Initial Jobless Claims statistics. A 0.3% increase in retail sales is expected, so it might not cause much of a stir, but a bad number might hurt the USD. Beginning on January 20, the Fed will enter a blackout period, when officials are unlikely to offer any direction for when to cut interest rates for the first time.
Investors will also be concentrating on reports about conflicts in the Middle East. Geopolitical unrest helps gold, but if the Red Sea issue worsens, energy costs might rise, and central banks' efforts to combat inflation would be hampered. As a result, an increase in global bond rates may restrict the upward potential of XAU/USD.
Technical Perspective
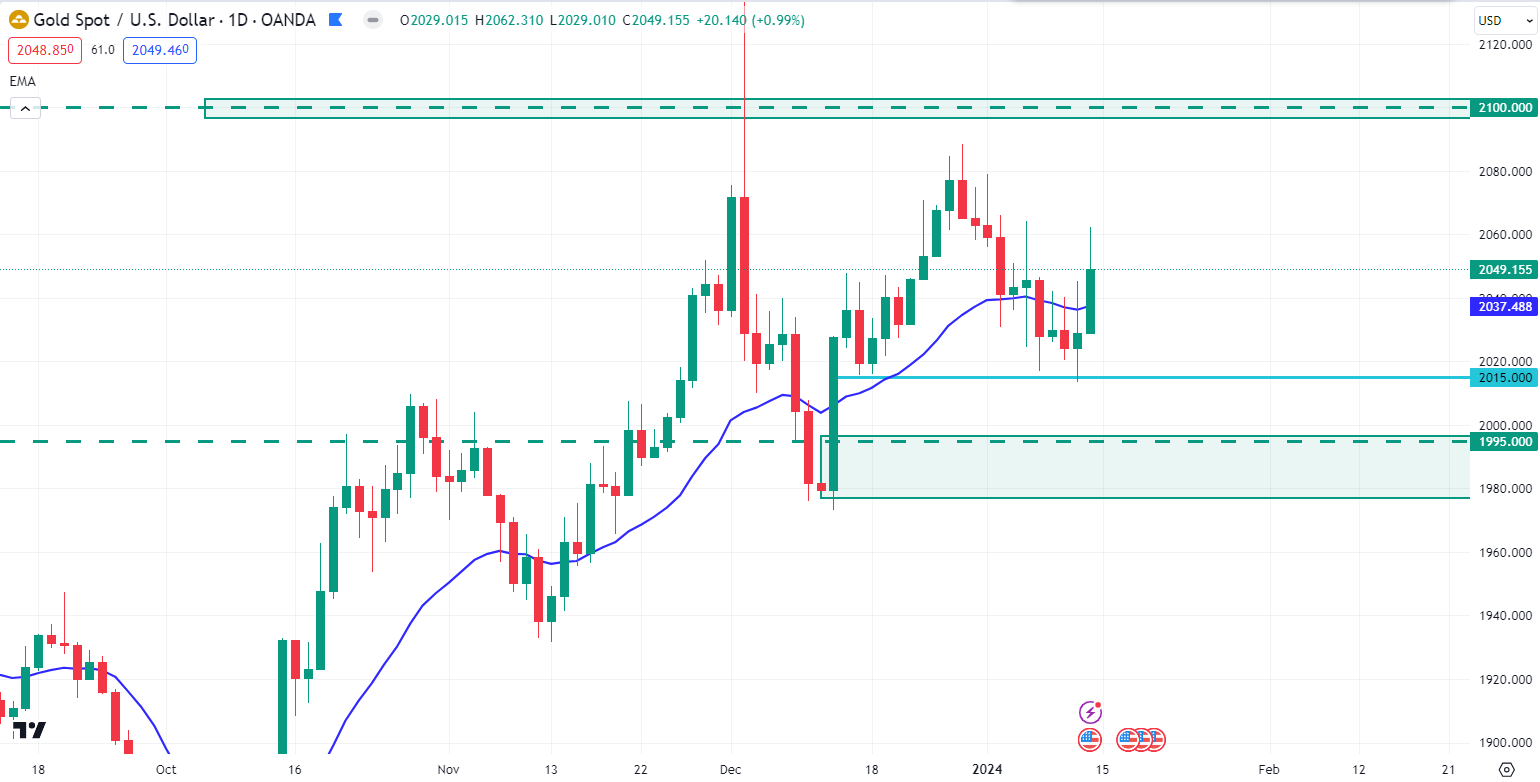
Image: TradingView
Gold has a weekly indecision candle close in the weekly chart after bouncing from the $2015.00 price area. However, the price still resides inside the weekly bearish mother bar.
In the daily chart, the price broke above the dynamic level of 20 EMA with a daily bullish candle last Friday. As per the current situation, the price may retrace downside toward the $2040.00 price area before continuing further upside toward the $2100.00 key resistance area.
On the bearish side, if bears push the price down and have a daily bearish candle close below the $2015.00 price area, the price may continue further downward toward the $1995.00 demand zone area in the coming days.
WTI Crude Oil (USOUSD)
Fundamental Perspective
West Texas Intermediate (WTI) US Crude Oil hit a 2024 high of $75.27 on Friday due to growing worries that global tensions may blow up. The Houthi rebels were attacking civilian ships close to Yemen, and US and UK naval troops responded. Attacks by the Houthis on ships en route to the Suez Canal have disrupted the oil markets and forced maritime lines around Africa to reroute. In 2023, the demand for Chinese crude oil reached a record high, allaying concerns about a decline in demand amidst China's economic difficulties.
These reasons caused the oil markets to soar, but WTI only managed to break $75.00 for a short while before collapsing below $73.00 when US Producer Price Index (PPI) data failed to meet expectations. After the Federal Reserve (Fed) raised interest rates once again, the markets gradually steadied, which led to a drop in the price of crude oil.
Technical Perspective
In the weekly chart, Oil price is still consolidating in the $70.00 - $76.20 price area. However, the momentum of the market is still bearish.
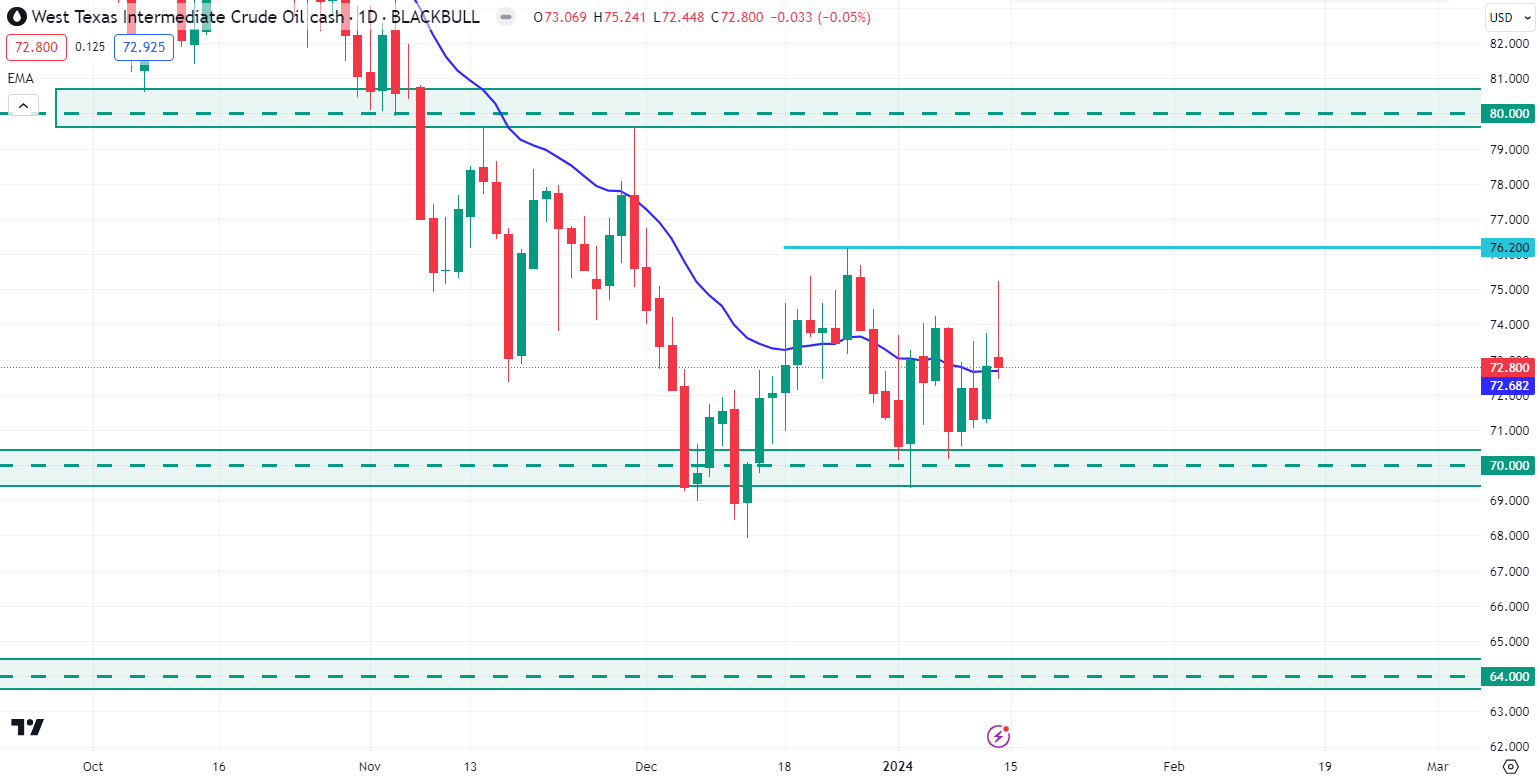
Image: TradingView
In the daily timeframe, if the price pushes higher and has a daily bullish candle close above the $76.20 resistance area, bulls may continue the bullish pressure toward the $80.00 resistance area in the days ahead.
On the bearish view, if the price breaks below the $70.00 support level with a daily bearish candle close, bears may continue the bearish trend toward the $64.00 price area.


