
By other European markets, London stocks declined for the second consecutive session on Thursday. Energy shares were the most significant negative factor, and investors maintained their apprehension in anticipation of the Federal Reserve's critical inflation gauge release on Friday.
UK100: Eyes On the UK GDP
The blue-chip FTSE 100 and the mid-cap FTSE 250 experienced a 0.1% decline on Thursday, while a choppy market is anticipated for the upcoming data releases.
Investors' caution before Friday's publication of the personal consumption expenditures price index resulted in a 0.5% decline in the pound's value against the dollar.
During the London market session, the United Kingdom disclosed revisions to its first-quarter Gross Domestic Product (GDP). According to market forecasts, the UK GDP growth is anticipated to remain consistent at the initial estimate of 0.6% quarter-on-quarter.
Furthermore, market caution was exacerbated by the impending parliamentary elections in Britain, which are scheduled for July 4. Investors anticipate that political uncertainty will impact markets.
FTSE 100: Gainers & Losers
DS Smith PLC (SMDS) was one of the top performers on the Investing.com United Kingdom 100, closing at 426.20 after a 15.69% increase or 57.80 points. In late trading, Mondi PLC (MNDI) increased by 3.59% or 53.00 points to close at 1,531.00, while Ocado Group PLC (OCDO) gained 2.10% or 5.90 points to close at 286.90.
Burberry Group PLC (BRBY) was the session's worst performer, closing at 899.80 after a 6.45% decline or 62.00 points. Prudential PLC (PRU) experienced a 3.30% decline or 24.60 points to 722.00, while GSK plc (GSK) experienced a 4.60% decline or 73.50 points to end at 1,526.00.
FTSE 100 Index (UK100) Technical Analysis
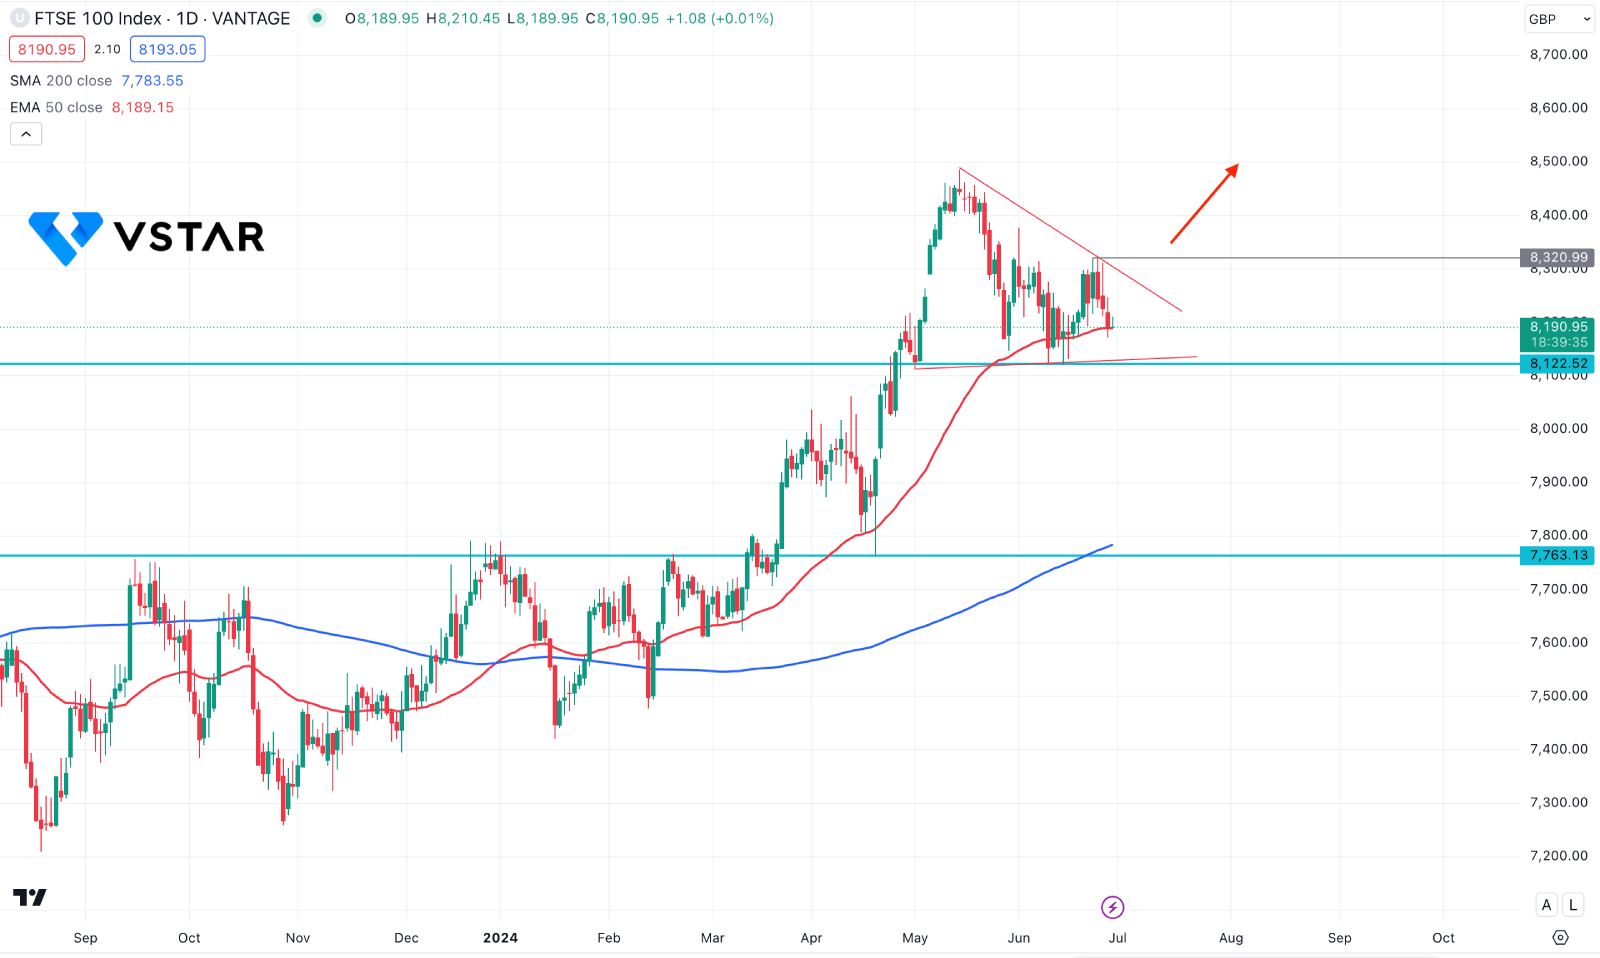
In the daily chart of UK100, ongoing buying pressure is visible as the recent price remains stable above the 200-day Simple Moving Average. Moreover, the near-term support level is at the 8122.52 level, which is just below the current price.
On the other hand, the buying pressure is supported by the 50-day Exponential Moving Average, which is in line with the current price and above the static support.
Considering the ongoing price action, the bullish pennant pattern is a crucial zone to look at. A valid buying pressure with a daily candle above the 8320.99 could activate the long-term bullish trend continuation, targeting the 8700.00 psychological level.
On The bearish side, investors should closely monitor how the price trades at the 8122.52 support level, as a break below this line could open the room for testing the 200 day SMA support.