
The AUDUSD maintains the buying pressure in the intraday chart, initially driven by May's hotter Australian CPI data.
Australian CPI Remains Hot
The Australian CPI indicated that consumers are having price pressures at a 4.0% rate, which surpassed the previous release's rate of 3.6% and the estimated 3.8%. The CPI report indicated that the high fuel, food, electricity, and rent prices might exacerbate the inflationary pressures.
The Reserve Bank of Australia (RBA) has expected additional rate increases due to Australia's persistently high inflation data. The Reserve Bank of Australia (RBA) has maintained its Official Cash Rate (OCR) for the past eight months at 4.35%.
US Dollar Index (USDX) Update
The US Dollar Index (USDX) has risen near the critical resistance level of 106.00 level as the Fed maintains the current interest rate structure for an extended period. The critical resistance of 106.00 has been approached by the US Dollar Index (USDX), which evaluates the value of the Greenback about six main currencies.
This week, Fed Governor Michelle Bowman declared that inflation must be managed by maintaining high interest rates for an extended period. Therefore, market participants anticipate that the Fed is likely to lower rates two times this year and commence normalizing monetary policy at the September meeting despite its posture on interest rates.
Investors are anticipating the release of the US Core Personal Consumption Expenditure Price Index (PCE) data for May on Friday.
AUDUSD Forecast Technical Analysis
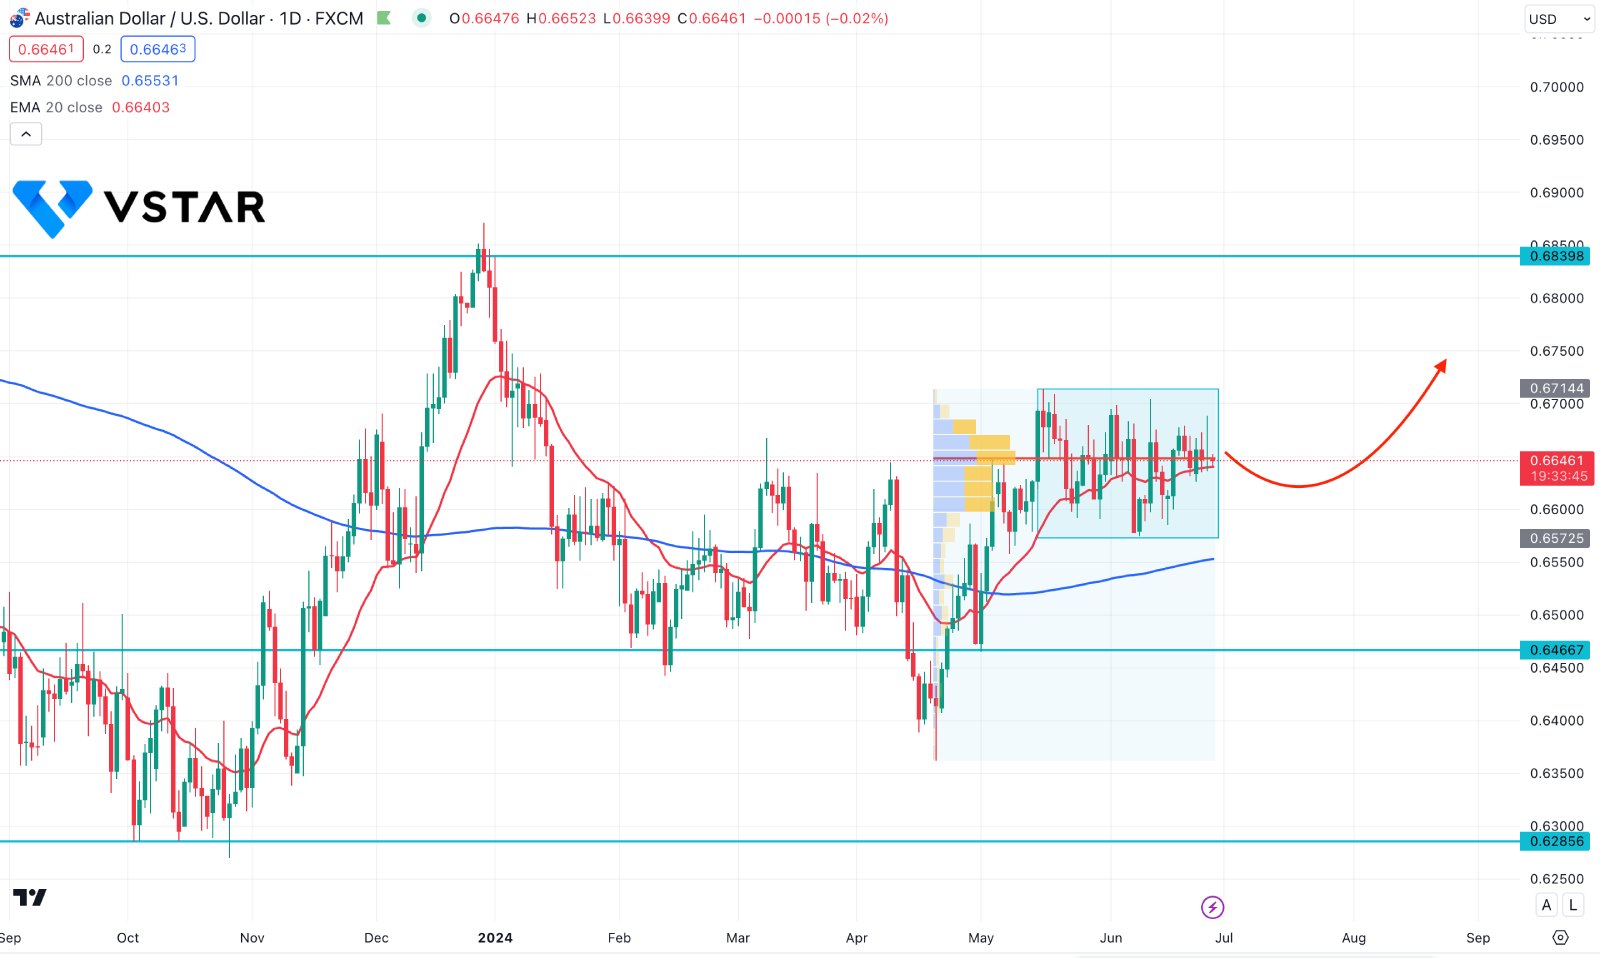
The short-term trend in the AUDUSD price remains within range, which might extend in the coming days. An upside breakout is likely to happen, creating a potential trend trading opportunity on the buyer's side.
A potential break with a daily candle above the 0.6714 level could validate the long-term bullish opportunity. The main target would be to test the 0.6839 resistance level. The 200-period moving average remains below the rectangle pattern with upward traction, which might work as major support.
The 20-day EMA is closer to the high-volume level, while both lines are within the rectangle pattern. In that case, investors should monitor how the price trades within the rectangle pattern before anticipating the long-term move.
On the other hand, a break below the 200-period moving average could alter the current market structure and initiate a prolonged downside correction.