
In recent days, the crypto market has faced a challenge as Bitcoin has been trading over 7.0% down in the past 30 days. Altcoins have suffered substantial losses as a result of this downturn. Nevertheless, TRON (TRX) has defied this trend, achieving a 1.12% increase in the past seven days and a 6.13% increase over the past 30 days.
TRX Onchain Metrics Analysis
TRX has been positively affected by the most recent market trends. It is currently recovering from a protracted downtrend and experiencing an increase in bullish sentiment. In the past seven days, Open Interest has increased from $21 million to $28 million, according to the Santiment data.
The increase in Open Interest across exchanges suggests that traders are either extending existing positions or taking on new ones. This implies that the upward trend will likely persist, indicating increased market activity and a growing interest in cryptocurrency.
Furthermore, data from Lookonchain demonstrated that USDT's trading volume on the Tron Network exceeded Visa's average daily trading volume of $42 billion, reaching an impressive $53 billion in a single day.
Tron USDT Trading Volume Exceeds Visa (V)
In the first quarter of 2024, Visa, the global payments behemoth, reported a trading volume of $3.78 trillion, which equates to an average daily trading volume of approximately $42 billion. This milestone is especially noteworthy due to Visa's established dominance in the payments industry, as it underscores users' expanding trust in digital currencies.
The significant trading volume of Tether (USDT) on the TRON network indicates a global shift in value transfer methods. This trend is anticipated to persist as more institutions and consumers acknowledge the benefits of digital currencies.
In related news, Tether Holdings, the issuer of USDT, has announced the development of a new synthetic dollar backed by gold. Furthermore, Binance, the world's largest cryptocurrency exchange by market capitalization, has successfully integrated Tether (USDT) into the Toncoin Network.
Tron (TRXUSD) Technical Analysis
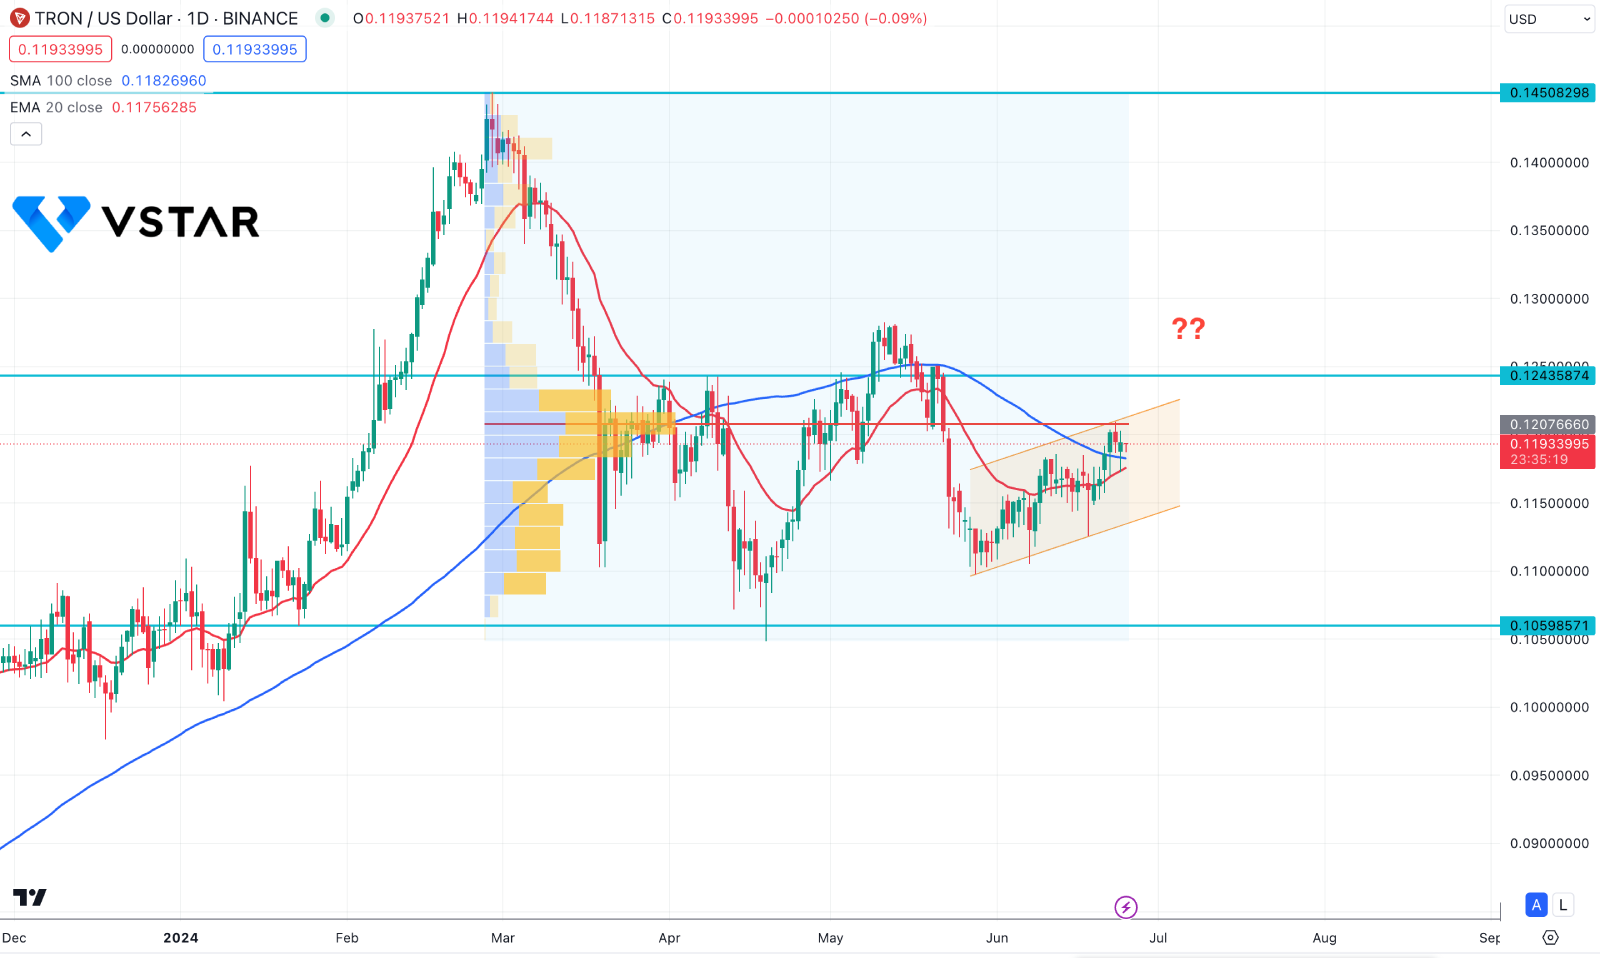
In the daily chart of TRXUSD, the current price shows a correct momentum within an ascending channel. The dynamic 20-day Exponential Moving Average is below the current price, with the 100-day Simple Moving Average. As both lines are below the current price, an upward pressure is possible. However, the high volume level since February 2024 is at the 0.1207 level, which is at the channel resistance. Therefore, a mixed sentiment is present in the current area, from where a breakout is needed before aiming for a fresh swing.
A daily candle above the 0.1207 level could create a high probability long opportunity, potentially pushing the price above the 0.1350 level. On the other hand, the price might face challenges from the resistance level. A failure to break above the 0.1243 level could lower the price to the 0.1100 psychological level.