
EURUSD
Fundamental Perspective
The EURUSD pair closed sideways on Friday, settling near 1.0817, after posting modest weekly gains. Optimistic market sentiment bolstered modest Euro gains, notwithstanding the persistent economic contraction. On the contrary, the US Dollar declined as anticipations of a change in the Federal Reserve's cautious position diminished.
The data confirmed the economic challenges that Europe was experiencing. The Eurozone continued to experience a decline in February, as reported by the Producer Manager Indexes (PMIs) of the Hamburg Commercial Bank (HCOB). The February surveys unveiled a deceleration in the contraction rate, partially compensating for the substantial decline in manufacturing activity.
In February, the HCOB Flash Eurozone Composite PMI increased marginally from 47.9 in January to 48.9. The services PMI rose from 48.4 in January to 50, while manufacturing PMI decreased to 46.1 from 46.6.
Germany encountered more severe economic difficulties in February, as evidenced by the HCOB Flash PMI declining from 47.0 in January to 46.1. Despite a more moderate contraction in the service sector, the Services PMI rose from 47.7 to 48.2.
Technical Perspective
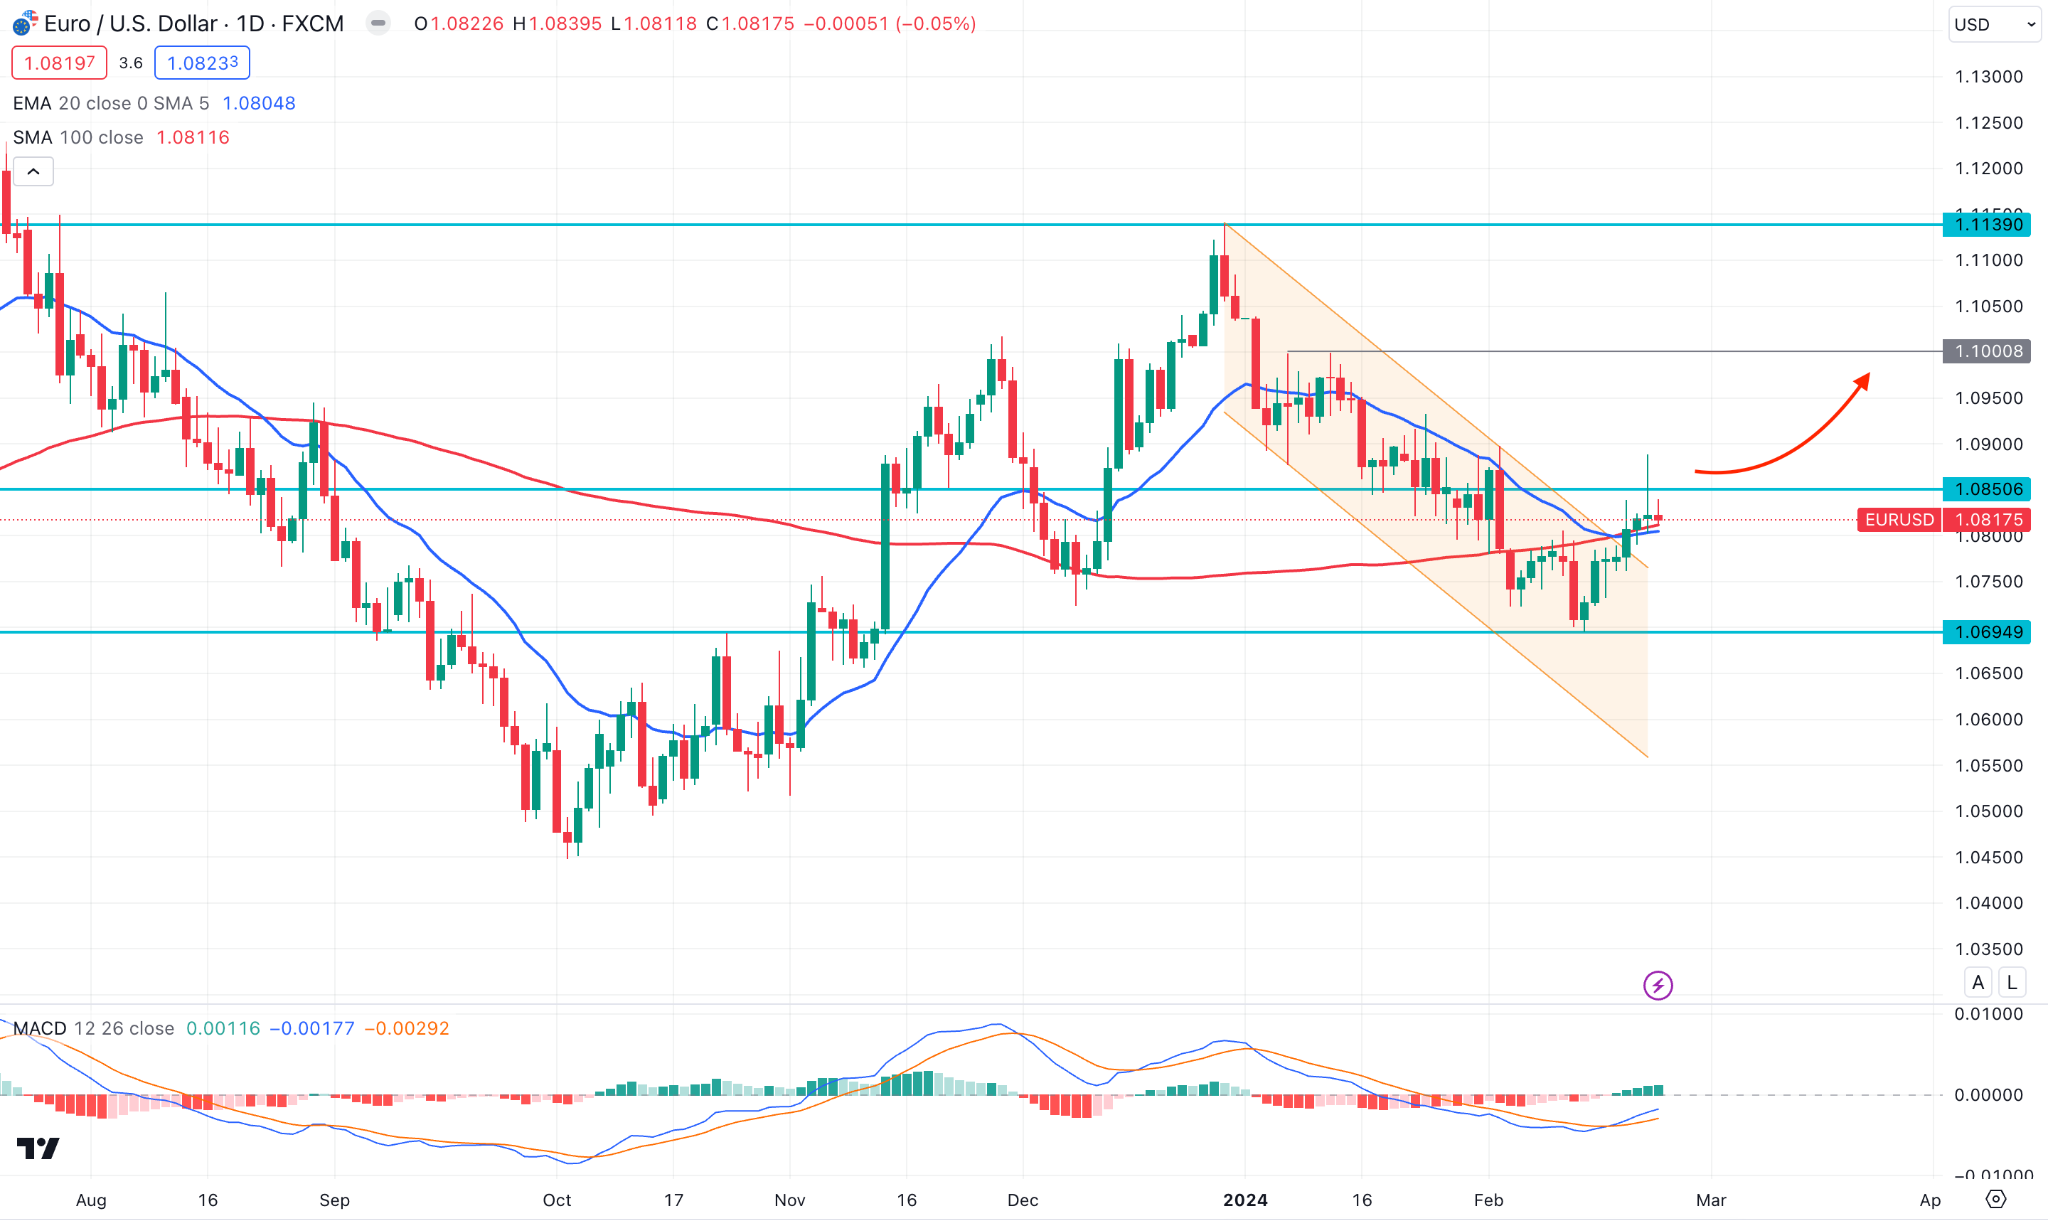
After two consecutive doji candles, the recent weekly close appeared as bullish, indicating a potential bullish range breakout.
The descending channel breakout is visible in the daily chart, with a daily candle above the dynamic 50-day EMA. The near-term resistance level is at 1.0850, which needs to be overcome before forming a stable bullish trend.
On the bearish side, a bearish breakout below the dynamic 100-day SMA could take the price within the channel, opening the possibility of reaching the 1.0600 area.
GBPJPY
The Japanese yen's depreciation against GBP this year can be attributed to the ultra-loose monetary policy of the Bank of Japan. To combat inflation, central banks around the globe have aggressively increased borrowing costs, whereas the Bank of Japan has maintained an accommodating stance.
Nonetheless, signs suggest Japan's protracted era of monetary easing may close, with an early Q2 exit from negative interest rates. This change may indicate a sustained recovery of the Yen, forming a massive bearish reversal for the GBPJPY price.
In mid-March, annual compensation negotiations between Japanese employers and labor unions could indicate a policy shift by BoJ. With wages surpassing 4.0%, policymakers might perceive it as an indication of future wage expansion, shifting away from negative interest rates.
There is an expectation that the Bank of Japan will clarify its policy stance in the future weeks. However, conjecture exists regarding the likelihood of a rate hike at its April meeting, with potential implementation in March. As investors anticipate this momentous advancement, the Yen may progressively initiate its recuperation.
Technical Perspective
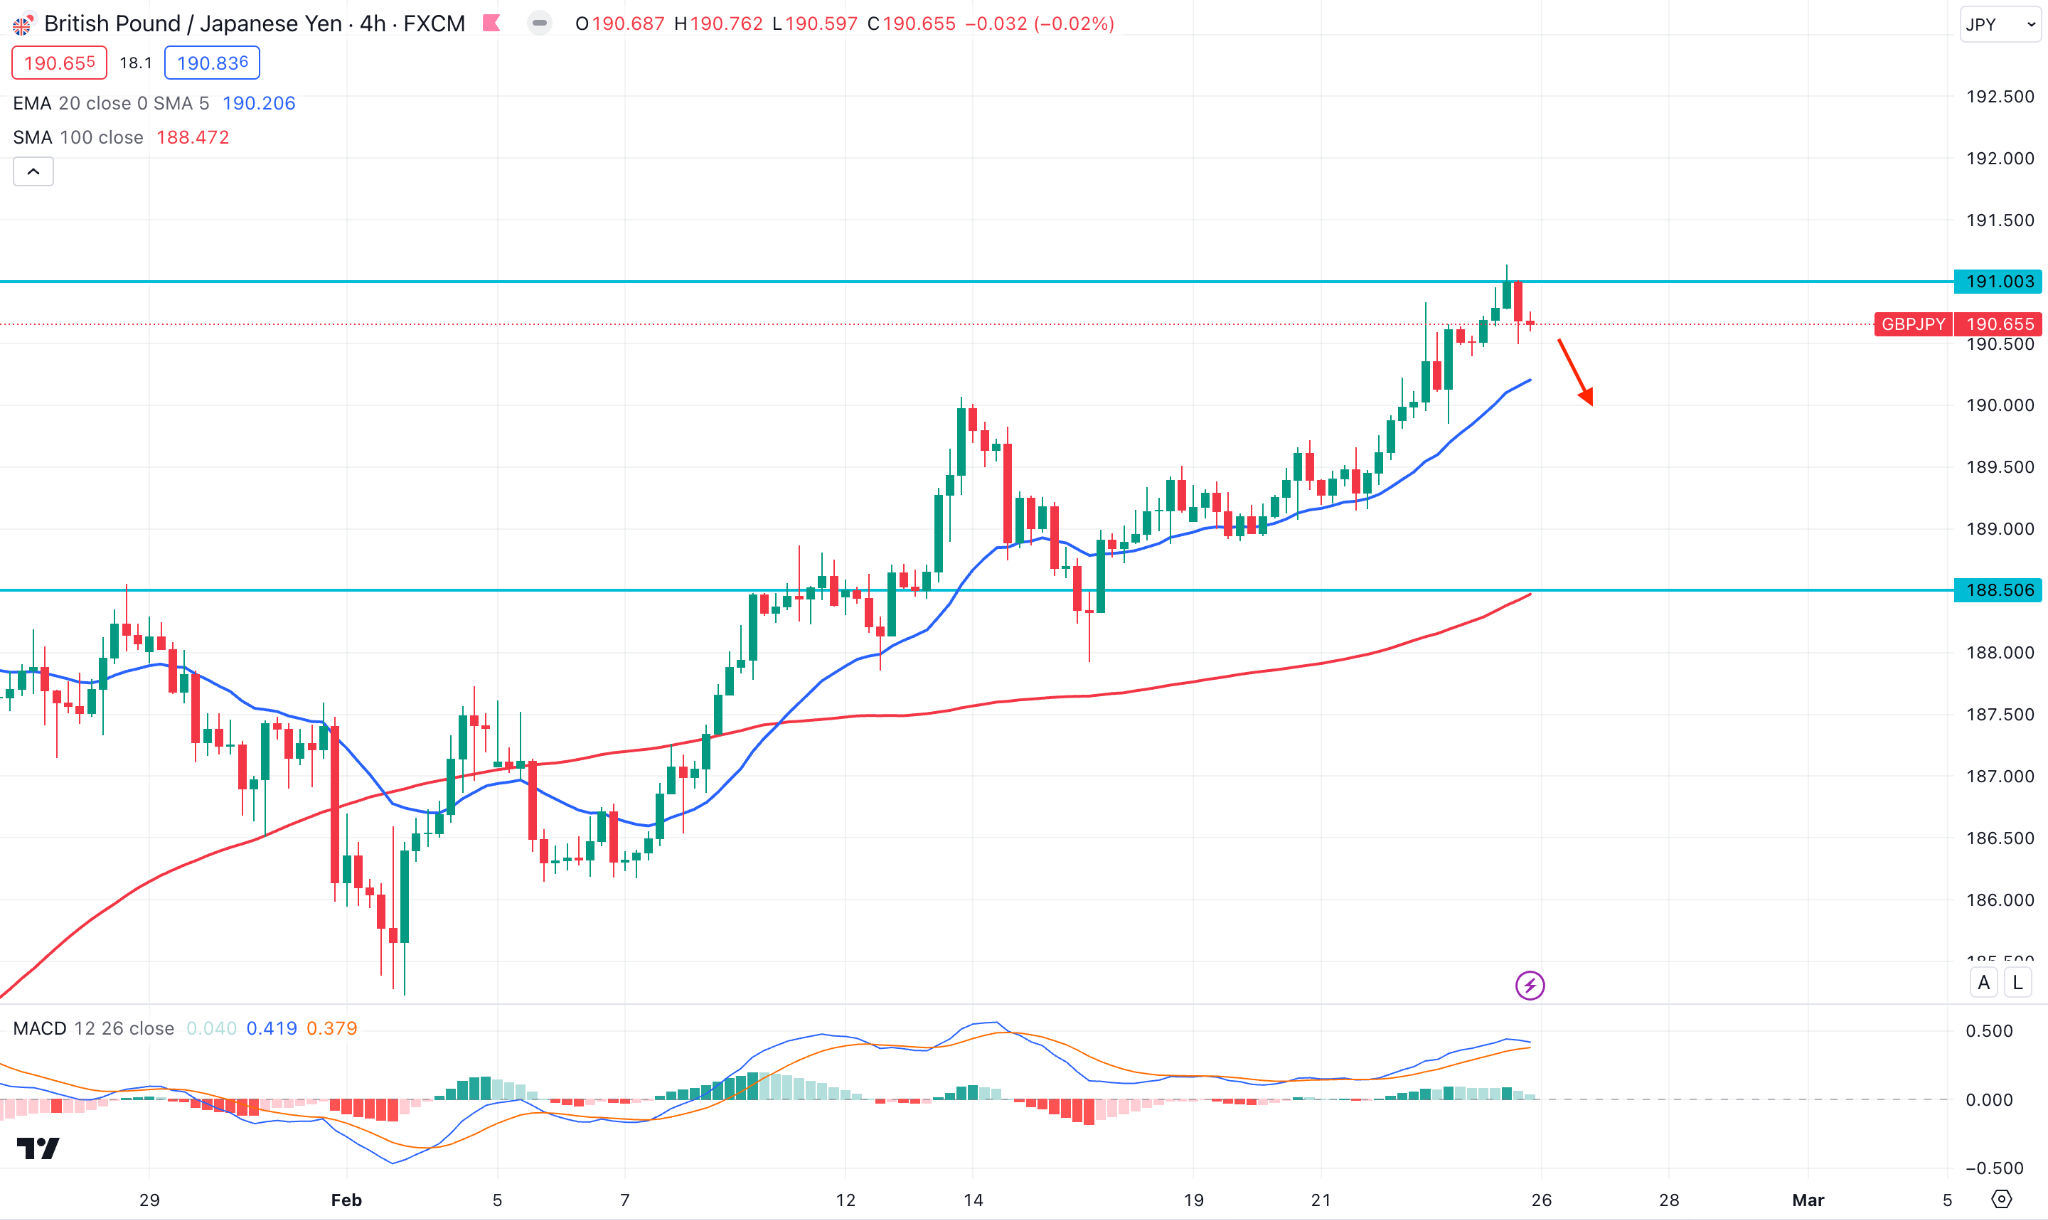
GBPJPY extended its buying pressure and closed the week bullish. The buying momentum is solid as the price reached the 191.00 level, a multi-year high.
As bulls are in control, the primary aim of this instrument is to seek long opportunities toward the 192.50 level before reaching the 196.00 level, which is the 2015 peak.
On the bearish side, sufficient downside correction is pending, where the main aim is to reach the 190.00 psychological level before reaching the 188.50 area.
Nasdaq 100 (NAS100)
Fundamental Perspective
Nasdaq 100 maintained its gains on Friday, positioning all three Wall Street indexes for weekly gains, albeit with a deceleration in momentum after the explosive rally of the previous week.
Nvidia, a market leader in artificial intelligence, surpassed $2 trillion in market valuation for the first time amidst the market activity that maintained artificial intelligence as a focal point. The stock witnessed an unprecedented advance, augmenting its market value by $277 billion—the most substantial one-day increase on Wall Street.
Significant growth and technology equities, especially AI industry ones, experienced a retracement. Tesla and Apple both declined 2% from their previous all-time highs.
Following the fervor surrounding artificial intelligence, Super Micro Computer, an additional beneficiary of this trend, encountered a significant setback as its shares declined by 12.4% after pricing the company's convertible notes.
Technical Perspective

The buying pressure is valid in the NASDAQ 100 weekly chart, where the recent candle closed bullish after an inside bar.
The ongoing buying pressure is potent in the daily chart, where the current price trades above the 17107.59 support level. In that case, the upcoming days could extend the momentum, where the main aim is to test the 18800.00 level.
On the bearish side, downside pressure towards the 50-day EMA is possible. However, a stable market below the 17000.00 level could initiate a bearish continuation for the coming days.
S&P500 (SPX500)
Fundamental Perspective
The S&P 500 secured a weekly gain on Friday following the publication of Nvidia Corp.'s exceptional earnings report.
A prominent portfolio manager, Matt Stucky stated that the semiconductor manufacturer surpassed expectations when describing Nvidia's quarterly results. The speaker underscored the consistency in artificial intelligence processors, ascribing the stock price increase to the remarkable area.
Nvidia's stock reached a record high of 0.4% on Friday, following an extraordinary 16.4% surge on Thursday after the company's earnings and guidance.
According to FactSet data, most S&P 500 sectors experienced positive closing prices on Friday. Specifically, energy, information technology, communication services, and consumer discretionary closed in negative territory.
In anticipation of the upcoming week, the U.S. economic calendar will feature Q4 GDP and personal consumption expenditures price index readings for January inflation.
Technical Perspective
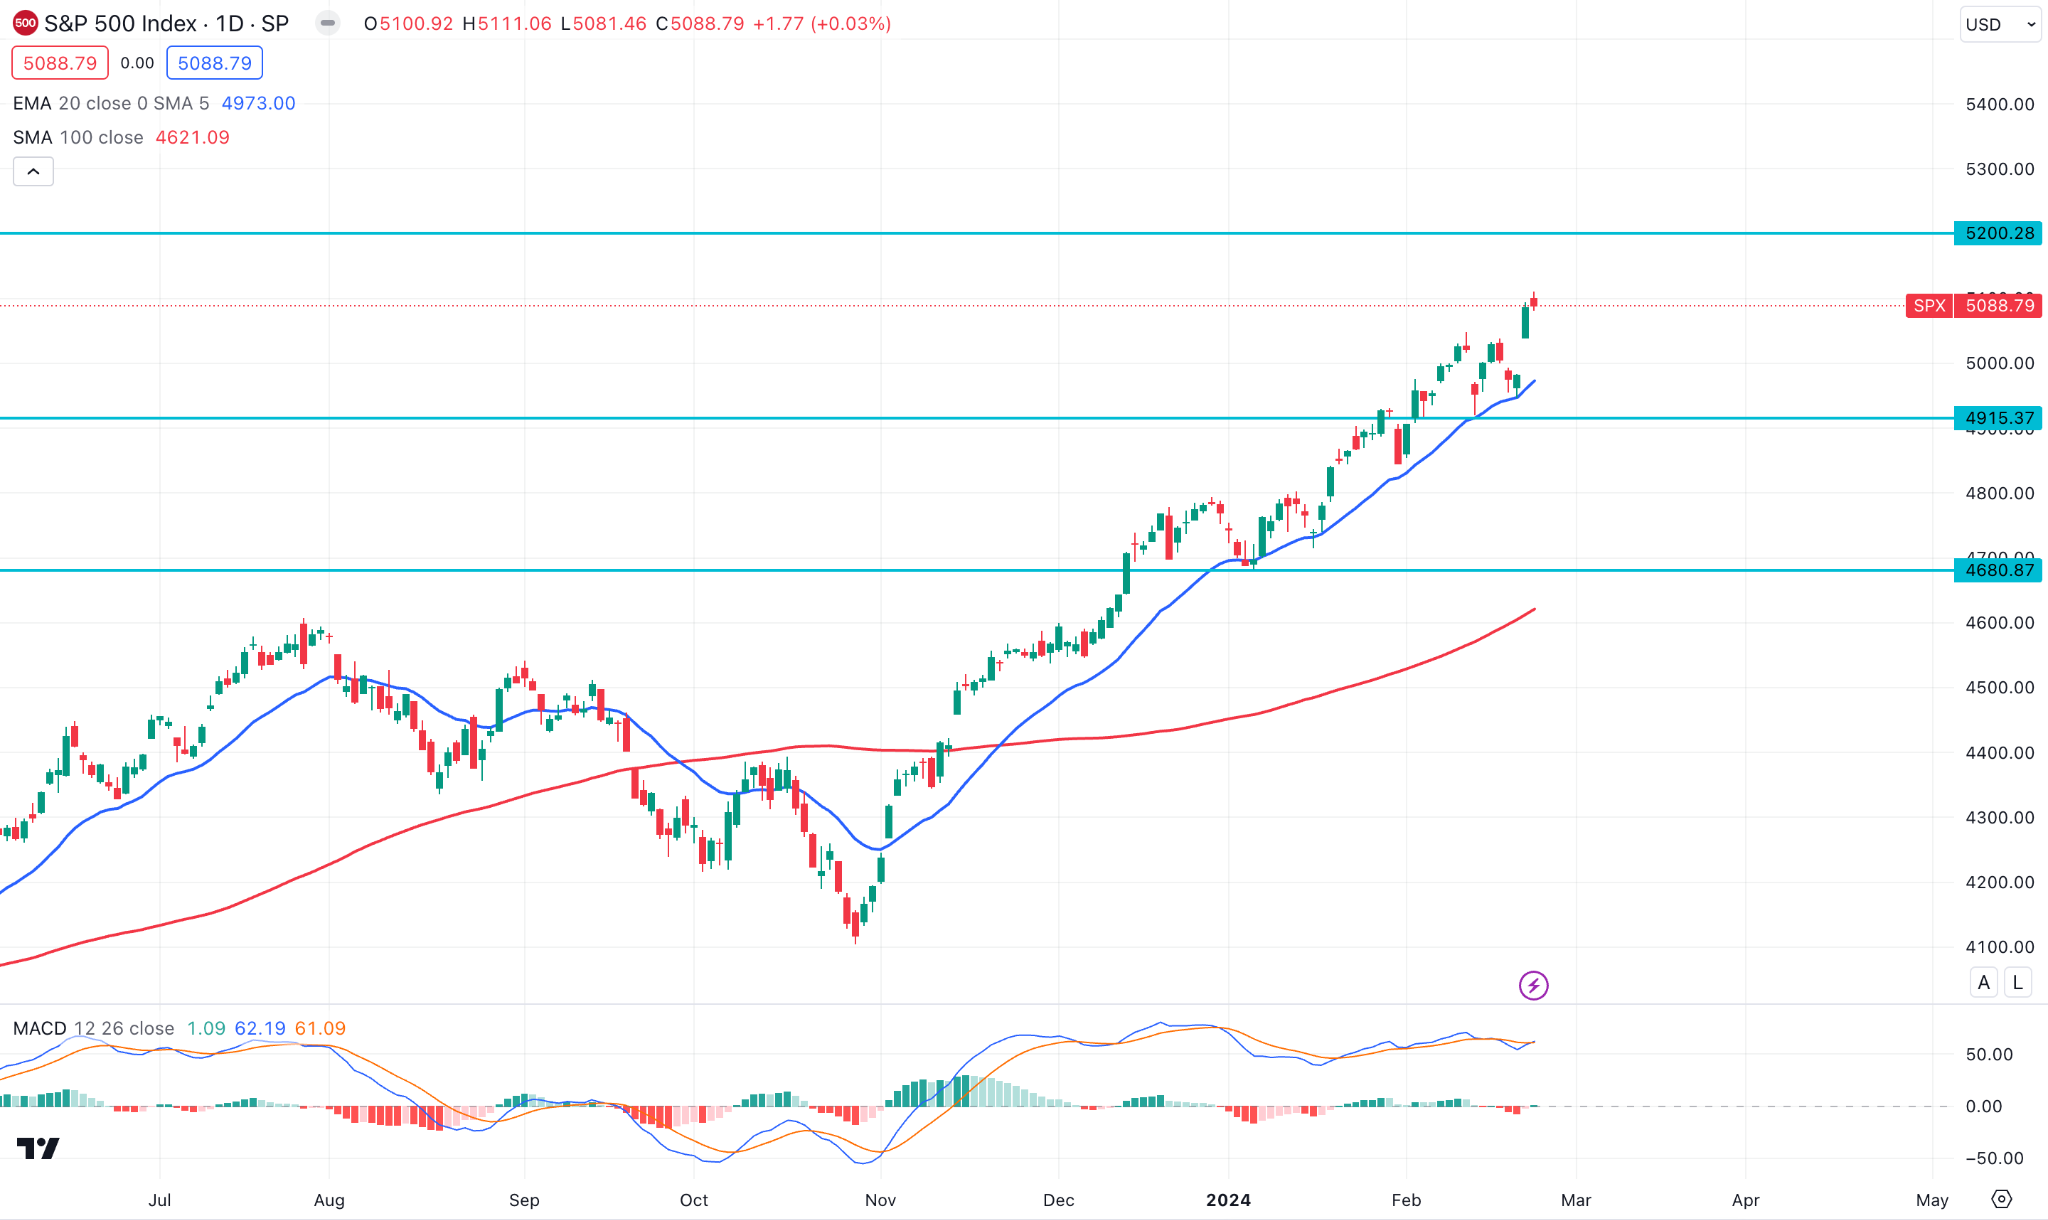
The ongoing buying pressure is supported by the 20-day EMA, where the immediate support is at the 4959.09 level. The MACD Histogram remained bullish after revisiting the negative zone, while the 100 Day SMA is a major support below the 4680.00 level.
In this structure, the bullish continuation is valid, aiming for the 5200.49 resistance level. However, a downside recovery with a daily close below the 4900.00 level could eliminate the current outlook and initiate a bearish possibility.
Hang Seng Index (HK50)
Fundamental Perspective
Hong Kong's composite consumer price index increased by 1.7% in January compared to the previous year, a decrease from the 2.4% rise seen in December. However, the year-on-year reading in January was nuanced, noted the C&SD.
Moreover, the relatively lower increase in January's CPI was partly attributed to the Lunar New Year falling in January last year. In 2023, consumer demand surged during the New Year festivities, driving up prices, whereas in 2024, the Lunar New Year occurred in February.
The Hong Kong Monetary Authority, the de facto central bank, pegs the value of the Hong Kong dollar to the US dollar and generally adjusts interest rates in line with the US Federal Reserve.
Technical Perspective
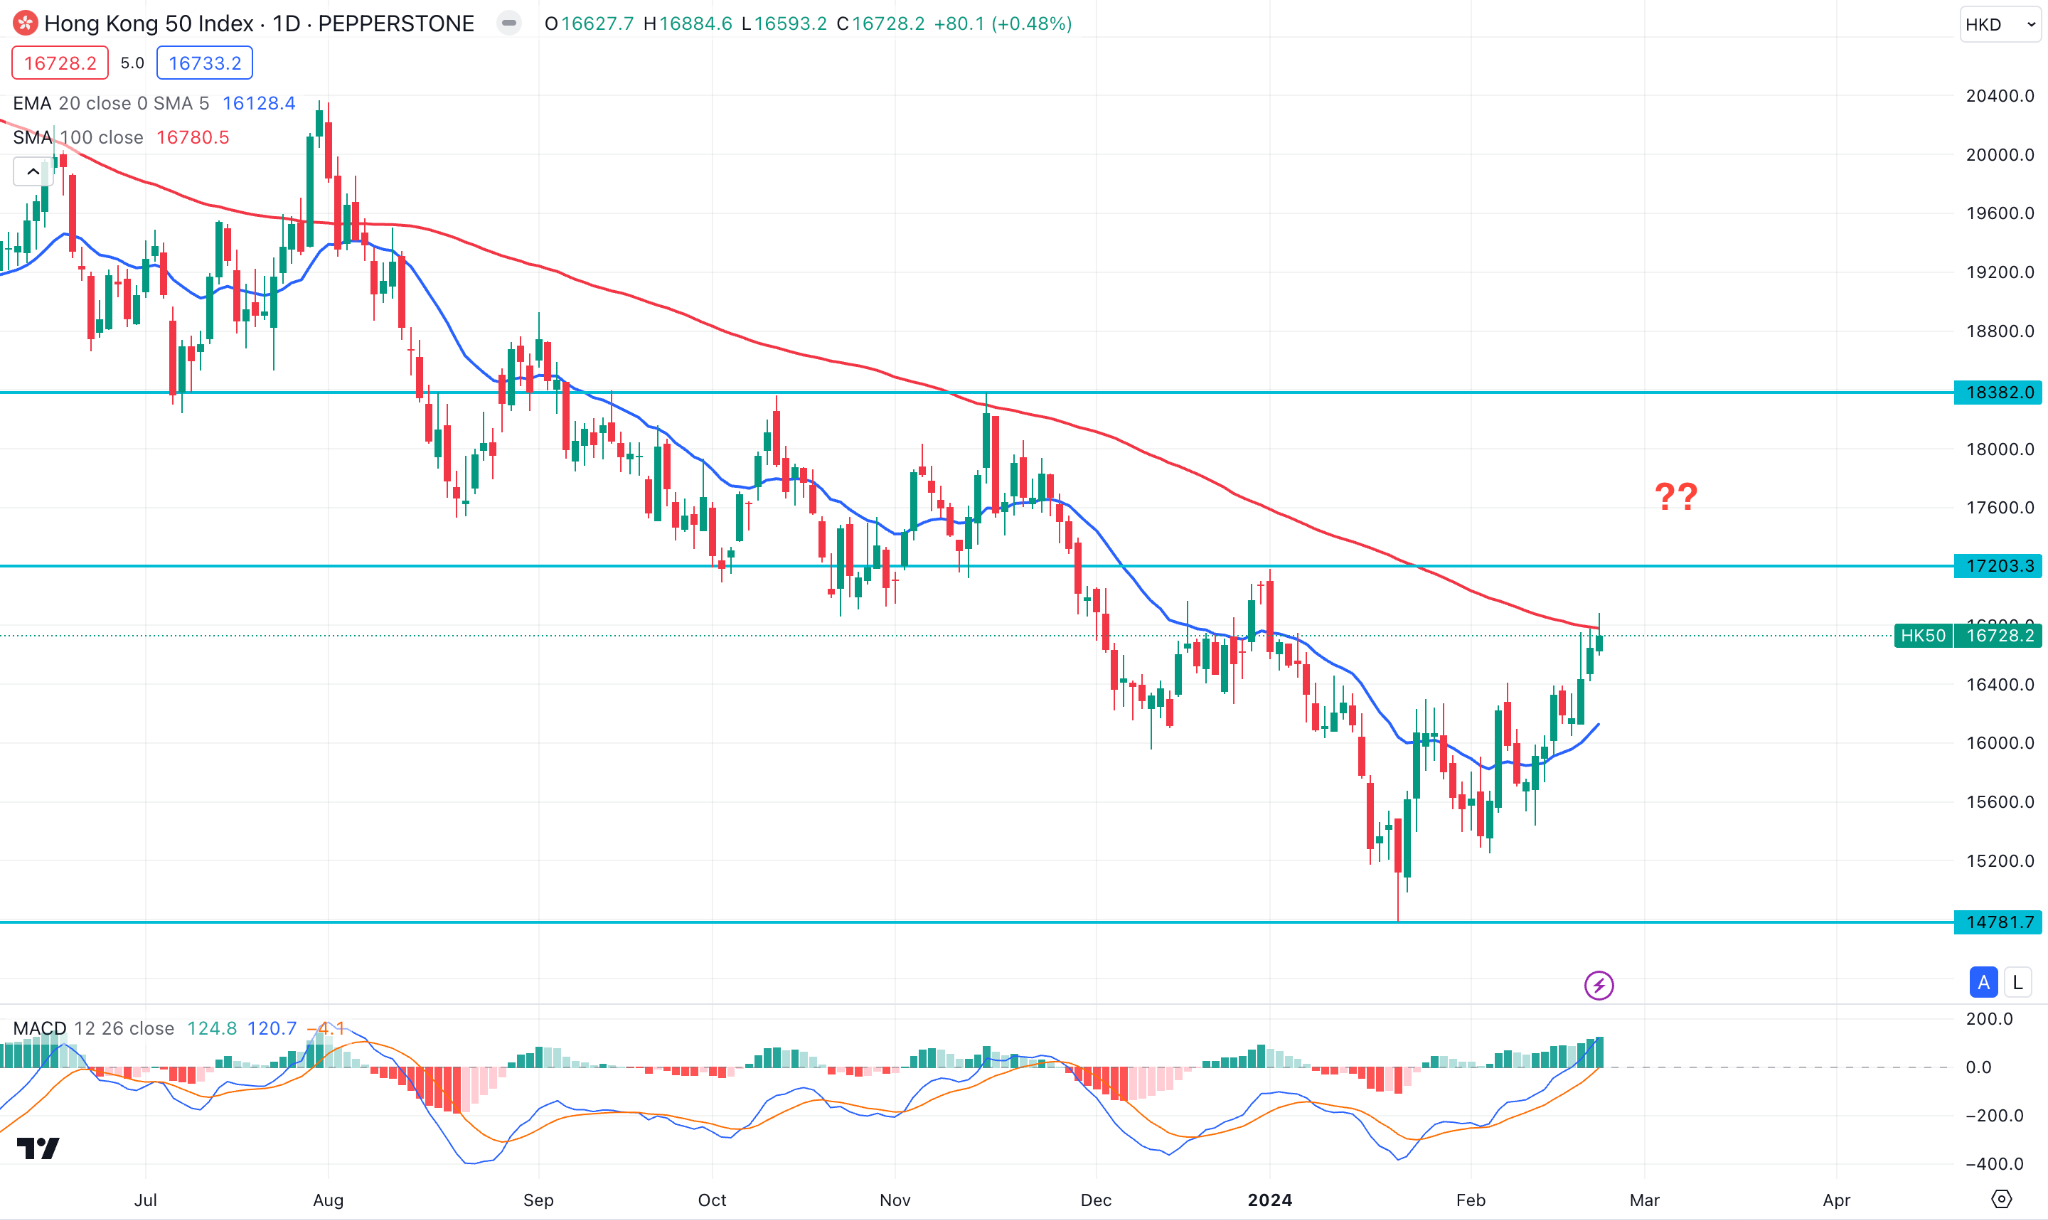
HK50 continued the bullish pressure and made a stable momentum above the dynamic 20-day EMA. However, the upward continuation is limited as the recent price stalled at the 100-day SMA and failed to move beyond this line.
In that case, an upward continuation with a daily candle above the 17203.30 level could be a valid long opportunity, targeting the 18382.00 level.
On the bearish side, the downside continuation is potent, where a bearish reversal needs a candle close below the 100-day SMA line.
Bitcoin (BTCUSD)
Fundamental Perspective
The Bitcoin (BTC) market is preoccupied with deciphering the 120 pages of memos ascribed to BTC founder Satoshi Nakamoto to ascertain his identity.
A recent X post by one of Satoshi Nakamoto's earliest collaborators presented email exchanges that contradicted the prevailing notion that Hal Finney, an esteemed cryptographer.
On the other hand, Thursday saw the publication of a blog post by the European Central Bank (ECB) entitled "ETF approval for Bitcoin. According to the ECB, the cryptocurrency, frequently called the monarch of decentralized digital currencies, has failed to live up to its potential and is still hardly utilized for legitimate transactions.
The ECB argued that the recent sanction of spot BTC exchange-traded funds (ETFs) on January 10 does not validate Bitcoin as a secure investment or dependable payment method. However, the BTC price surged after ETF approvals, signifying an unstoppable victory, which was denied by the Central Bank, emphasizing that Bitcoin continues to have no legitimate value.
Technical Perspective
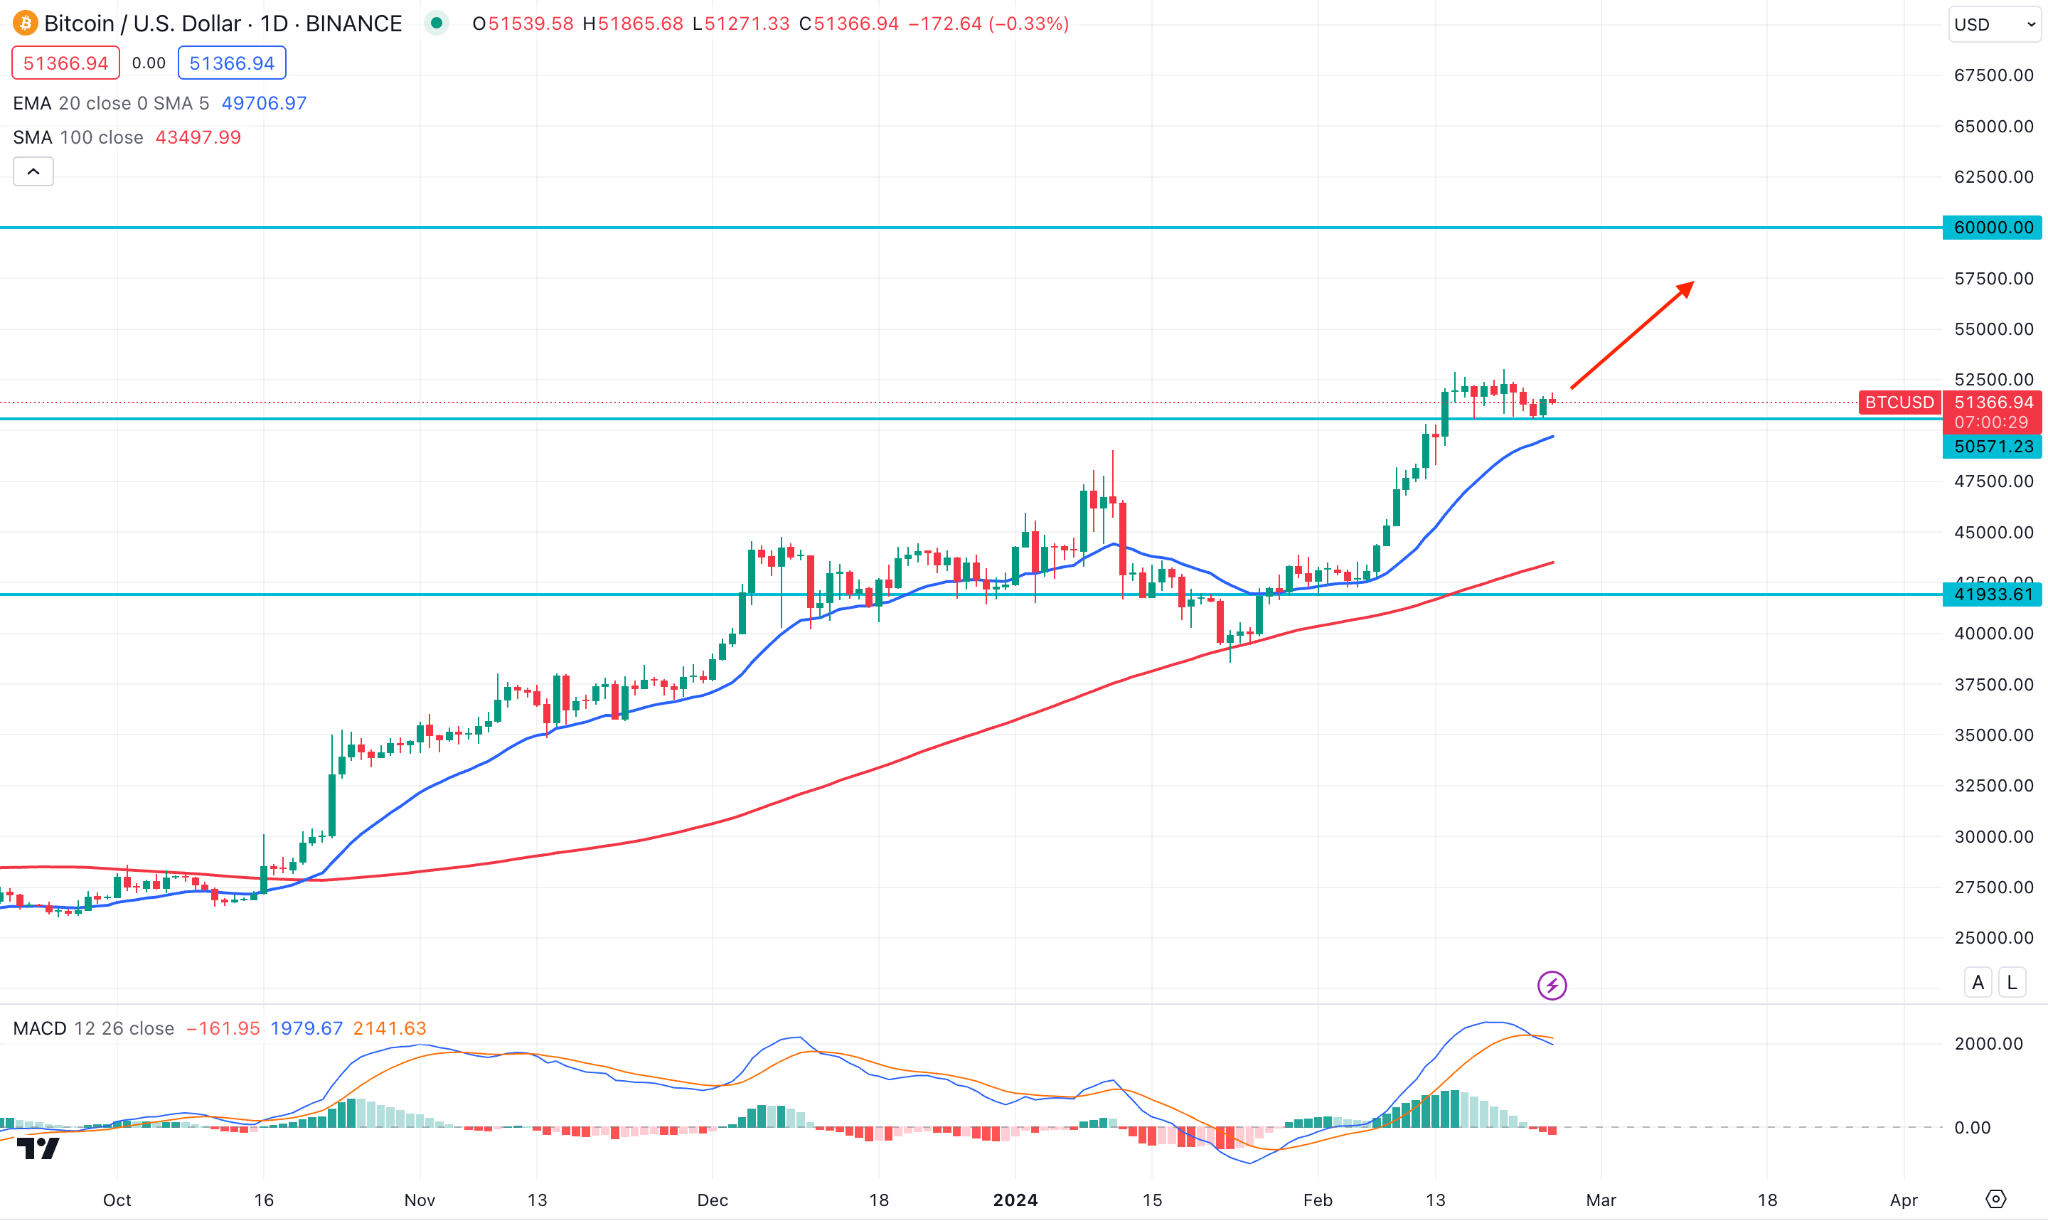
Bitcoin (BTC) continued pushing higher, where the near-term support level is at the 50571.38 level. The primary aim for this pair is to seek long opportunities as long as the price trades above this line.
The bearish possibility is potent as no significant correction has been visible since January 2024. In that case, a bearish daily candle below the dynamic 20-day EMA could extend the downside pressure toward the 100-day SMA before continuing the bull run.
Ethereum (ETHUSD)
Fundamental Perspective
Grayscale Investments examines Ethereum's ambitious trajectory toward becoming the preeminent and scalable settlement layer for decentralized applications (dApps).
Grayscale observes that to tackle scalability concerns, "Ethereum 2.0" implements a modular strategy by partitioning the network into specialized segments. This segmentation preserves the scalability and security of the network as a whole while allowing for targeted updates and innovations in particular areas.
Grayscale emphasizes noteworthy achievements on the Ethereum 2.0 roadmap, specifically the September 2022 "The Merge" that marks the transition to a proof-of-stake consensus mechanism.
Technical Perspective
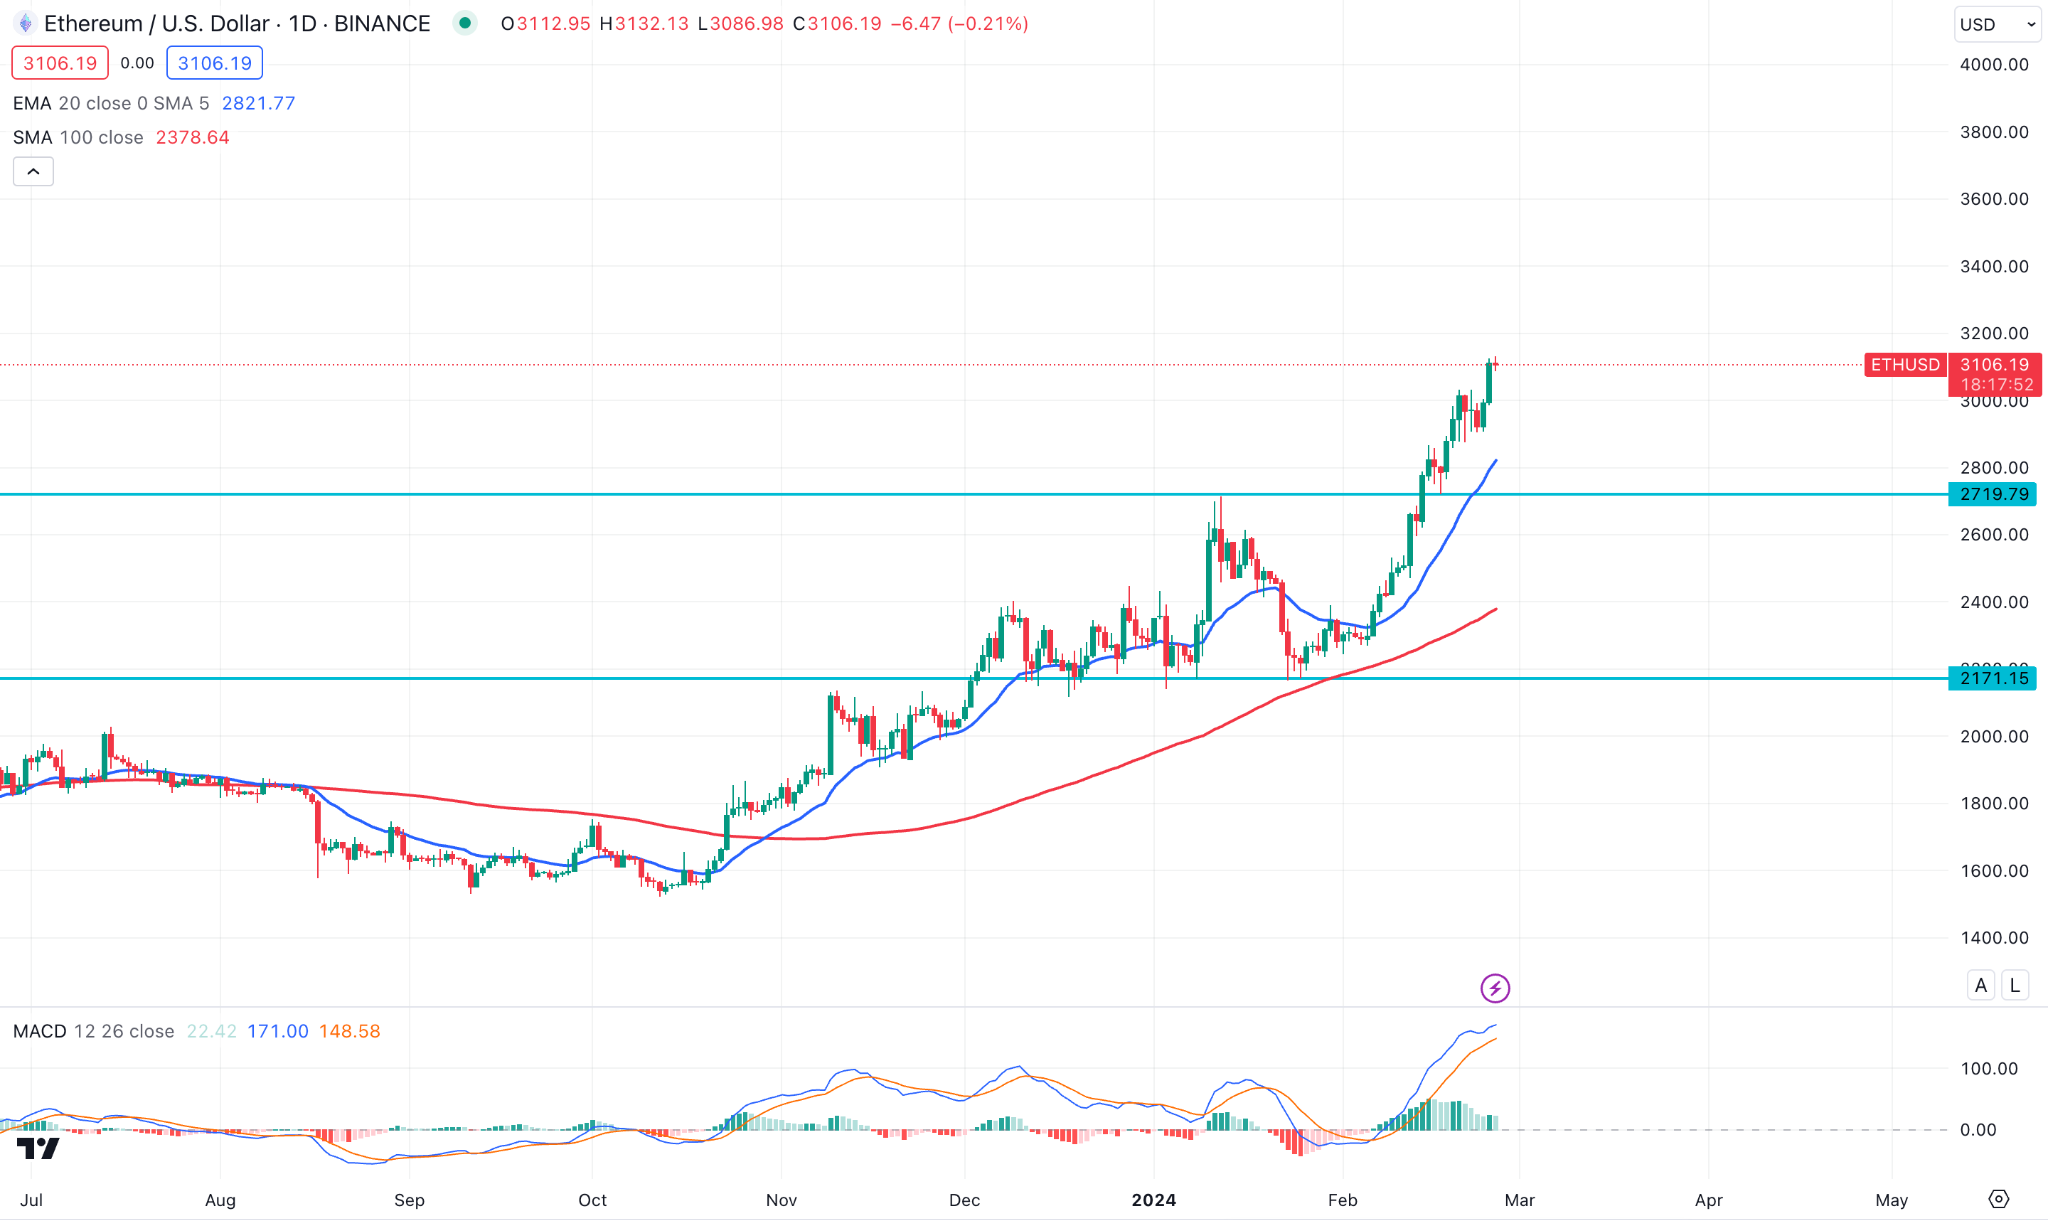
Ethereum (ETH) remained bullish, while the recent price moved beyond the 3000.00 psychological level.
The dynamic 20-day EMA is working as a near-term support level by remaining bullish above the 2719.19 static level.
In this context, more upward pressure is potent, aiming for the 3500.00 level. However, the 2719.19 event level is a crucial price area to look at. A daily close below this line might eliminate the buying structure and lower the price at any time.
Tesla Stock (TSLA)
Fundamental Perspective
Tesla (TSLA) implemented a price adjustment on Thursday evening for a Model 3 trim in the US. Additionally, the company extended discounts on two Model Y variants until February. This pricing strategy is one of the electric vehicle (EV) industry leader's continuous adaptations to changes in production and supply. As a result, TSLA shares witnessed a marginal decrease on Friday.
On Thursday, the price of the Tesla Model 3 Long Range in the US increased by $250 to $47,740. The base price of the Real Wheel Drive Model Y has been reduced by $1,000 to $42,990. Likewise, the price of the Model Y Wheel Drive has been reduced by $1,000 to $47,990. It is worth noting that Model Y inventory is offered at substantially reduced prices.
Furthermore, Tesla reintroduced an offer on February 8 that permits owners of Full Self-Driving vehicles to transfer their FSD rights to a new Model 3, Y, S, or X, on the condition that delivery occurs no later than March 31.
Technical Perspective
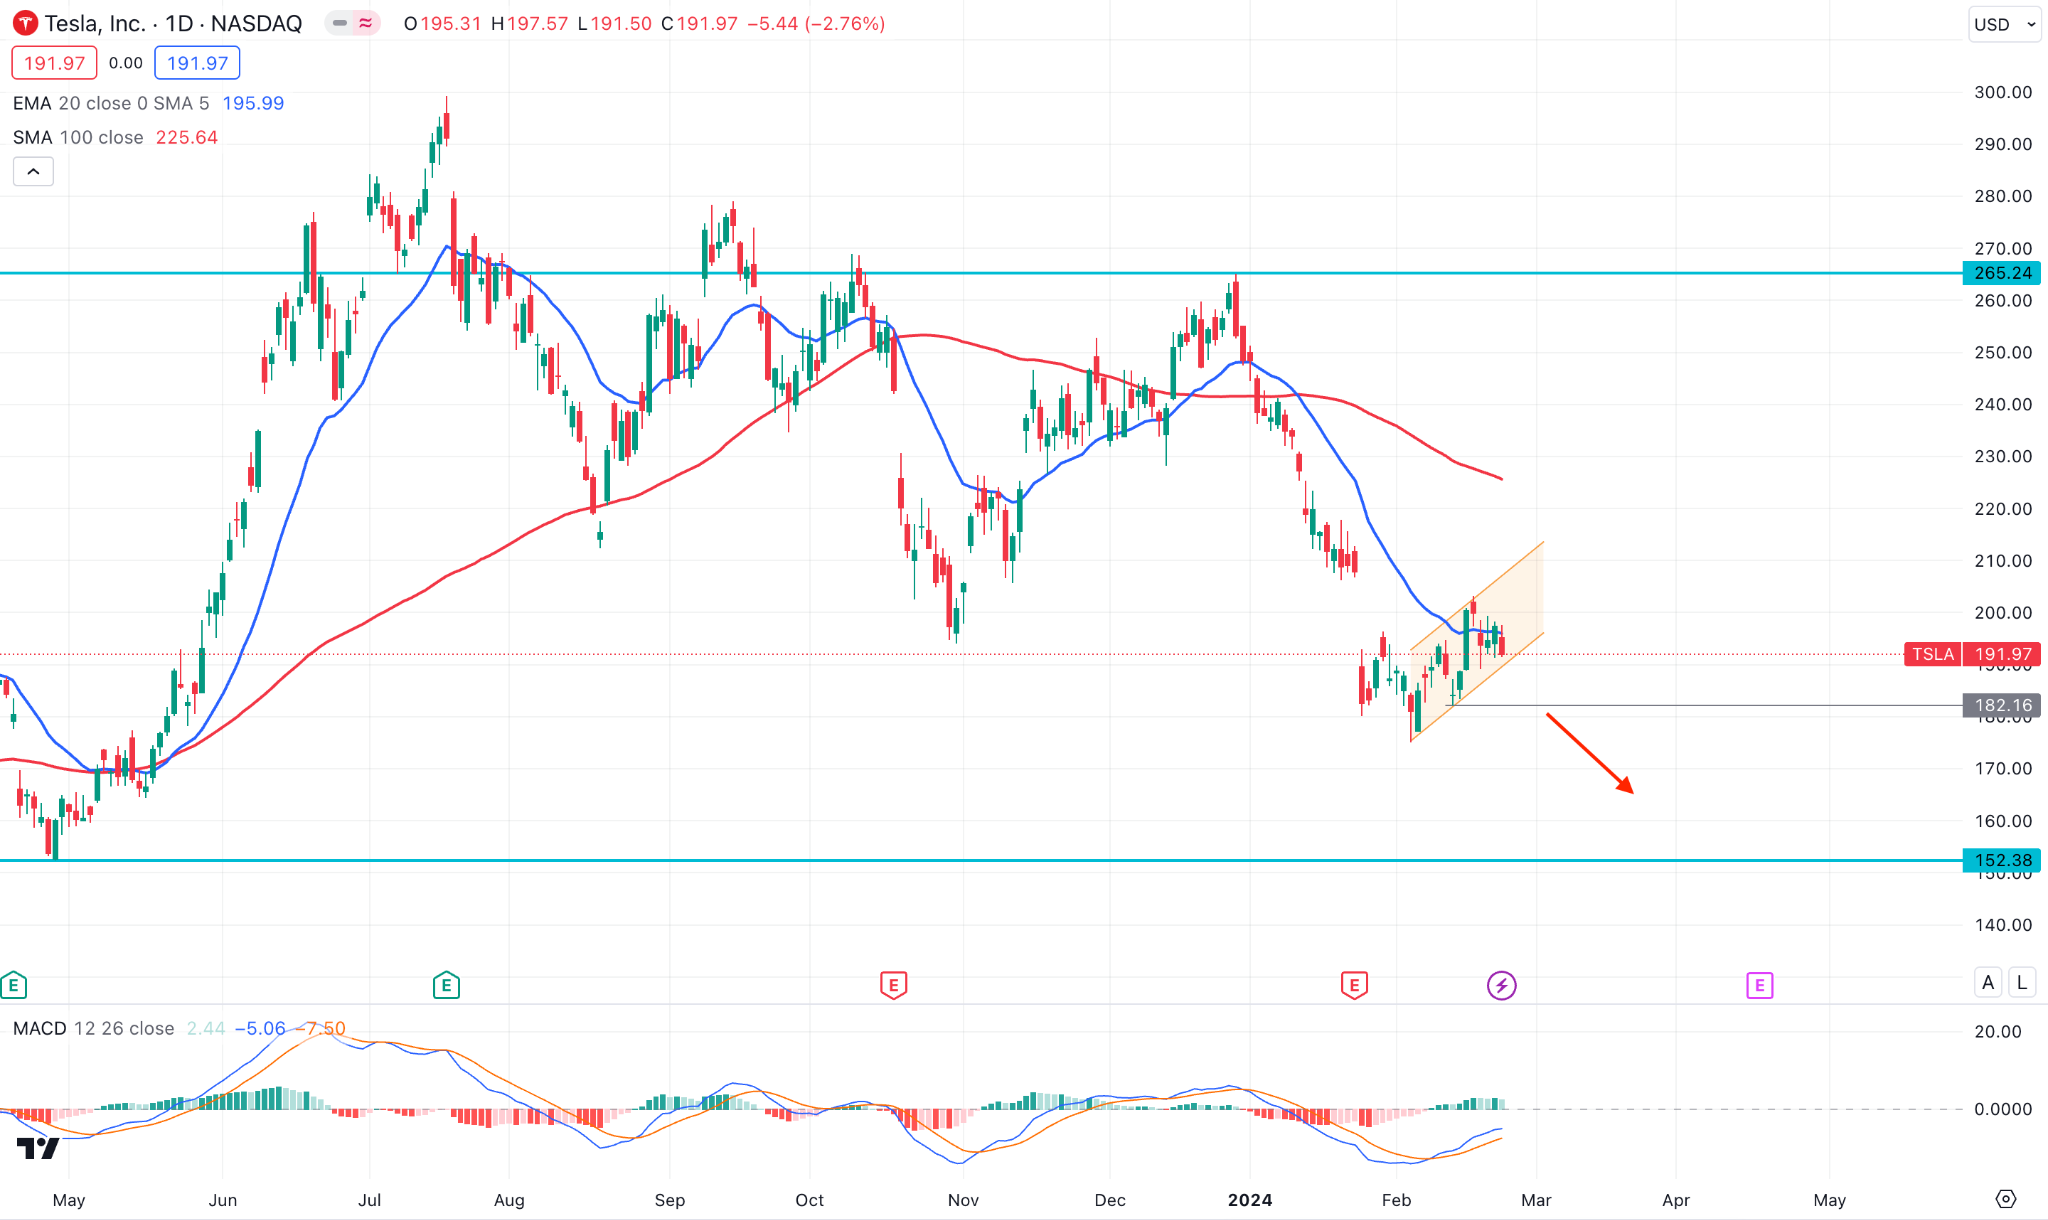
In the weekly TSLA stock chart, the current candle closed bearish after three corrective bullish candles. However, the broader context is bearish as the existing candles show consecutive lower lows, suggesting a bearish trend.
Based on this outlook, a downside continuation is potent as the current price trades below the 20-day EMA. A channel breakout with a D1 candle below the 182.16 level could lower the price towards the 152.00 area.
On the bullish side, a stable recovery above the 100-day SMA is needed before anticipating a long-term bullish signal.
Gold (XAUUSD)
Fundamental Perspective
The Federal Reserve (Fed) minutes from the January policy meeting were released on Wednesday, revealing policymakers' apprehensions regarding the potential hazards of prematurely easing policy. In addition, the duration of the restrictive policy stance remained uncertain. A nearly 1% increase in the benchmark 10-year US Treasury bond yield prevented gold from extending its weekly gains.
In the week ending February 17, initial applications for unemployment benefits decreased by 12,000 to 201,000, while early February S&P Global PMI surveys indicated continued expansion in private sector business activity. As a result, the 10-year US yield surpassed 4.35 percent, its highest level since late November.
In the interim, Governor Christopher Waller of the Federal Reserve (Fed) stated on Thursday that the Fed is not hastening to implement interest rate cuts. Premature reductions in interest rates, cautioned Waller, could imperil advancements in addressing inflation and present substantial perils to the economy.
Technical Perspective
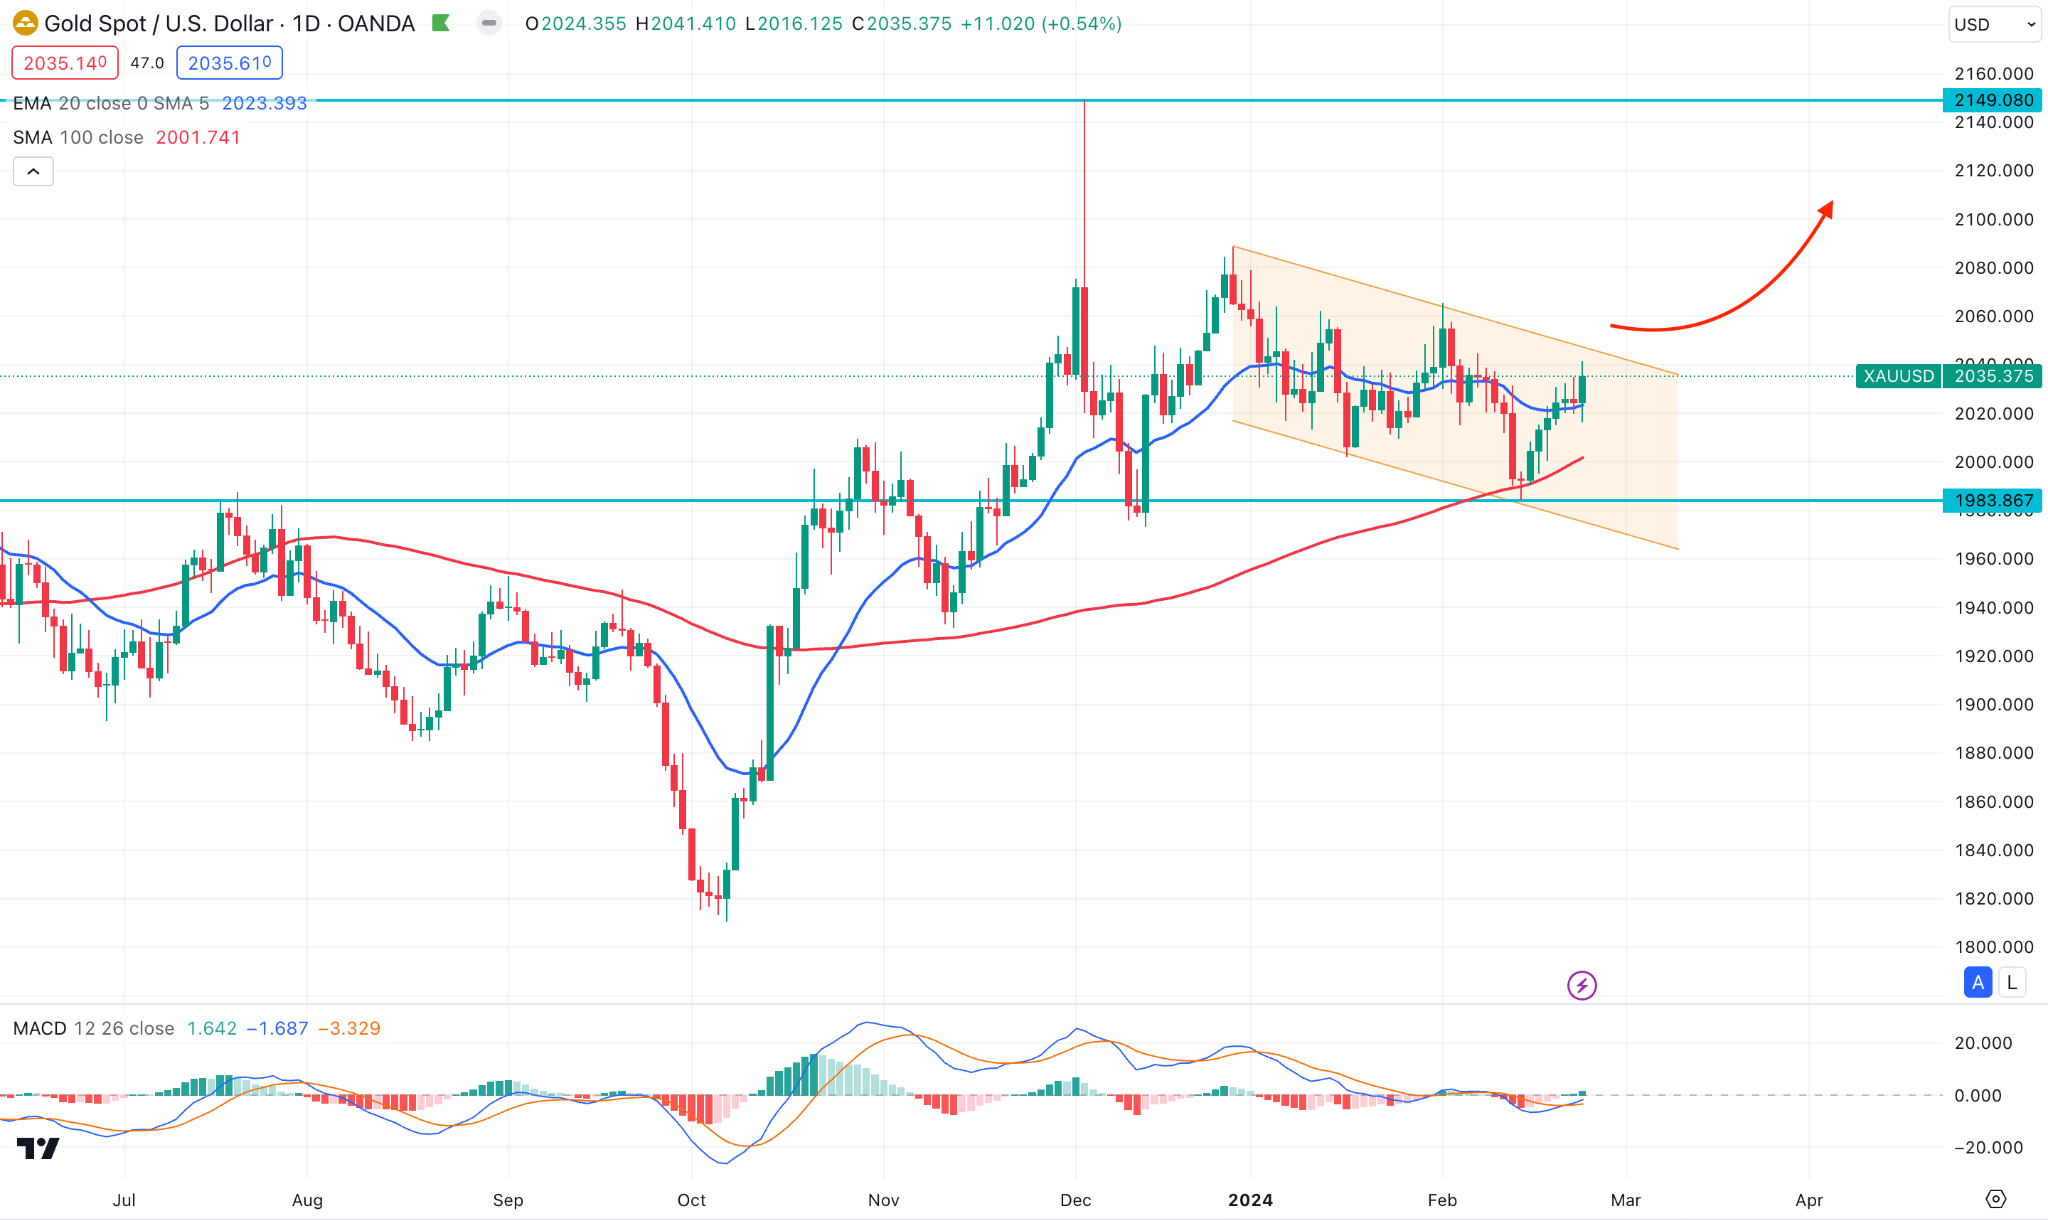
In the daily chart of XAUUSD, the existing market momentum is bullish, as dynamic levels are below the current price with a bullish slope.
On the bullish side, a stable channel breakout with a daily close above the channel resistance could validate the upward possibility, targeting the 2050.00 level.
On the bearish side, a deeper correction is possible toward the 100-day SMA, but an immediate bearish rejection from the channel resistance could offer a minor downside possibility.
WTI Crude Oil (USOUSD)
Fundamental Perspective
WTI crude represented a weekly decline of more than 3 percent after Fed Governor Christopher Waller suggested interest rate cutbacks could be delayed by at least two months. This observation suggests that economic expansion may be lackluster, potentially reducing the demand for oil.
Concerns regarding an extended period of elevated interest rates and uncertainties about demand dynamics boosted the selling pressure. Inflation figures in the US exceeding expectations increased optimism that the Federal Reserve would sustain high borrowing costs.
Furthermore, the monthly report from the International Energy Agency emphasized a deceleration in worldwide oil consumption as a result of the increasing transition to renewable energy alternatives.
Later in the week, renewed apprehensions regarding supply disruptions amid escalating geopolitical tensions in the Middle East prompted a market recovery. Additionally, EIA data indicated that crude oil inventories in the United States rose less than anticipated last week.
Technical Perspective
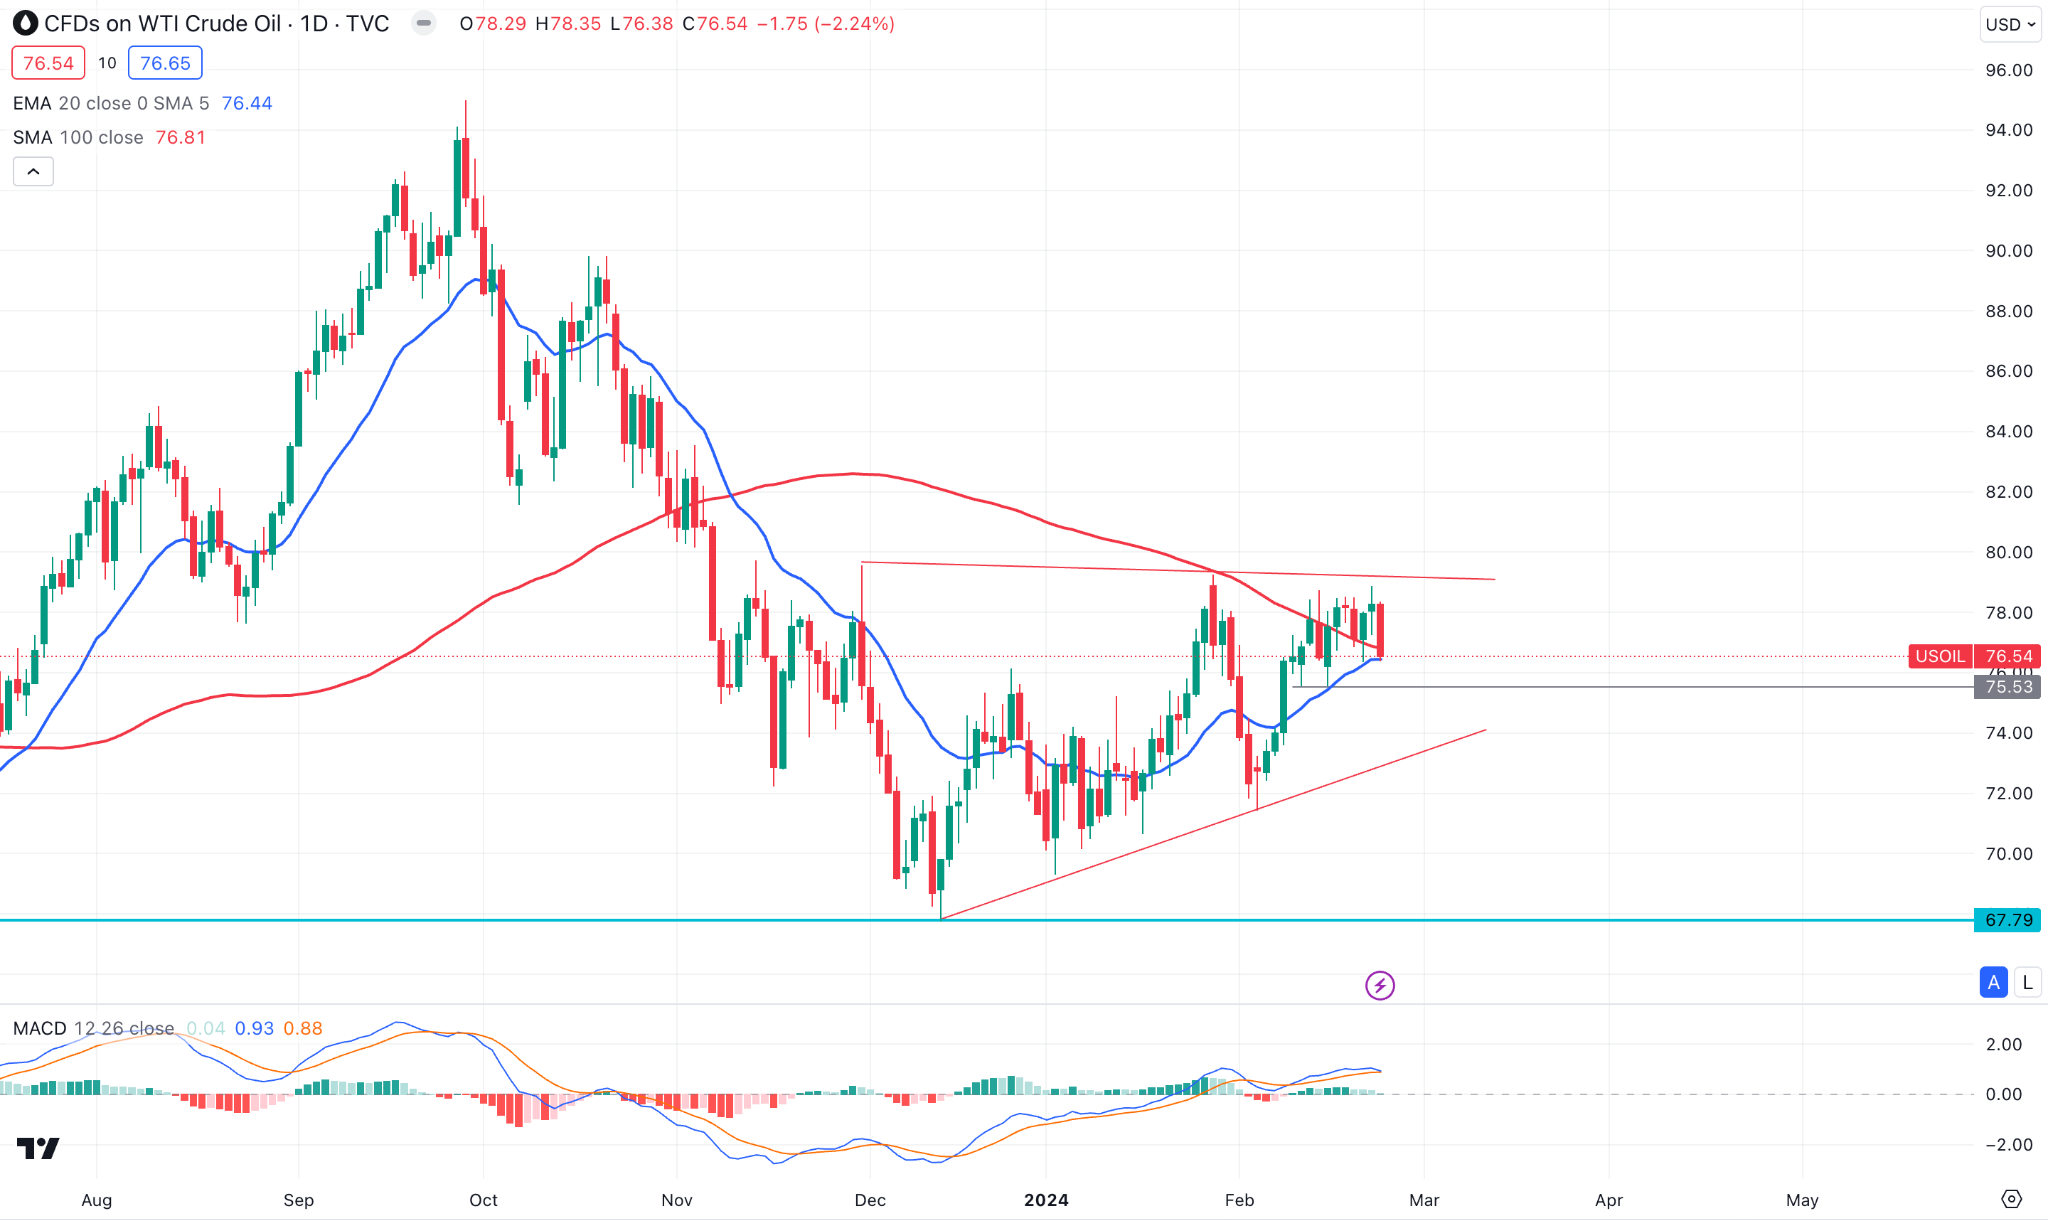
The WTI daily price trades sideways within a symmetrical triangle formation, where the existing market trend is bearish.
This pair's classic technical trading approach is to seek short opportunities as long as the price trades below the triangle resistance.
A daily close below the dynamic 20 DMA could be a valid short opportunity targeting the 67.79 level.


