EURUSD
Fundamental Perspective
The EURUSD pair continues to struggle near 1.0360, hovering close to the one-month low reached on Thursday. As buyers remain on the sidelines, the pair is set to post its lowest weekly close since November 2022.
The euro's weakness is driven by the divergent monetary policy outlooks between the European Central Bank (ECB) and the Federal Reserve (Fed). The ECB recently cut interest rates for the fourth time this year, signaling potential further easing in 2025. In contrast, the Fed hinted at a slower pace of rate cuts in 2025, reinforcing the downside bias for EUR/USD.
Geopolitical risks, alongside uncertainty surrounding US President-elect Donald Trump's tariff proposals and a looming government shutdown, have supported the US Dollar. These factors and the Fed's hawkish stance have propelled the USD to a two-year high, deepening the negative outlook for the EUR/USD pair.
Attention now turns to the US Personal Consumption Expenditure (PCE) Price Index, the Fed's preferred inflation metric, due later in the day. While the data could influence short-term USD movements, the broader fundamentals remain tilted in favor of USD strength, suggesting any reaction to softer data may be limited.
Technical Perspective
EURUSD's current two red candles on the weekly chart create support near the yearly low, showing that the downtrend still has the possibility of reaching beyond the support level.
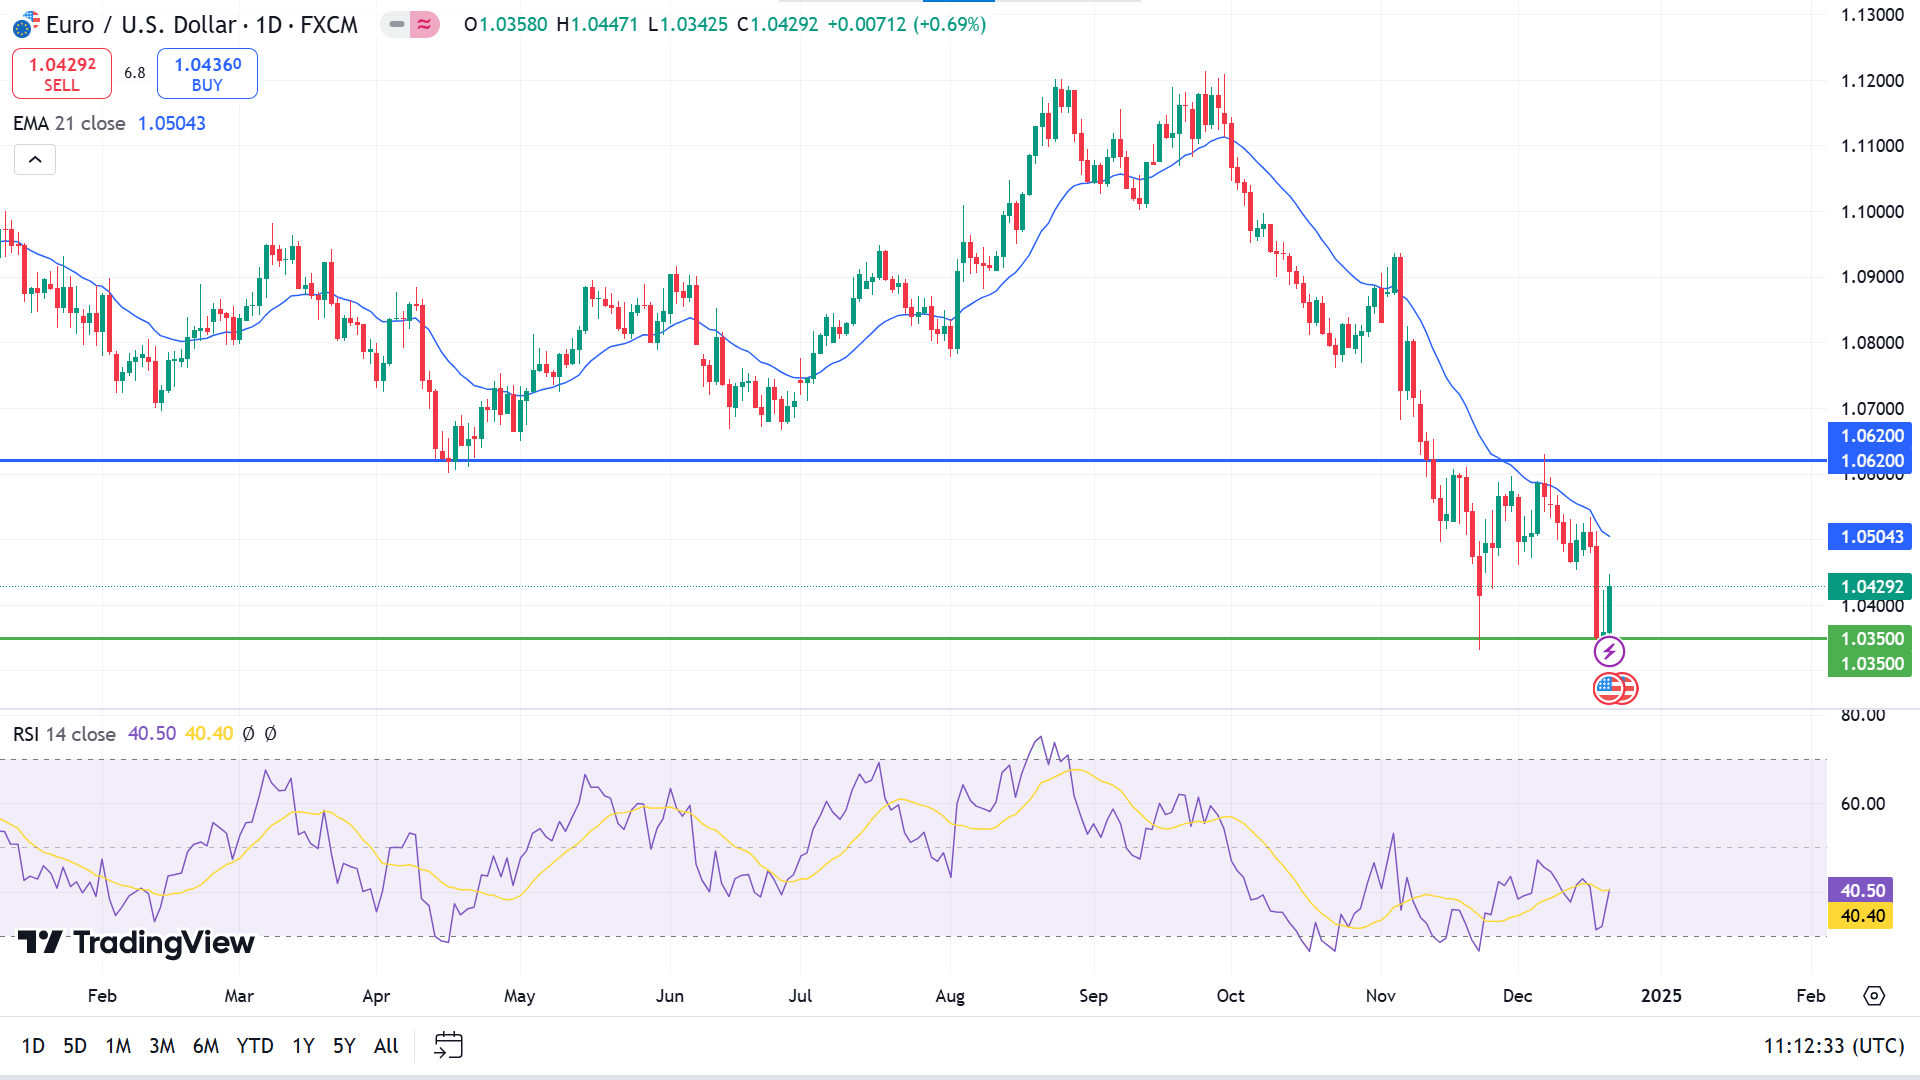
The price is moving below the EMA 21 line on the daily chart, reflecting the bearish pressure at the asset price on the daily chart. The RSI indicator scenario is different as the dynamic signal line edging upside after reaching the lower line of the indicator window shows slight buying interest.
As per the current context, buyers may observe near 1.0350 as it looks like adequate support to hold, which can trigger the price toward the resistance near 1.0620 or beyond.
Meanwhile, the bullish signal might be invalid if the price dives below 1.0350, sparking selling interests. Sellers may seek to open short positions primarily near 1.0620 as it is an acceptable distribution level.
GBPJPY
Fundamental Perspective
UK Retail Sales, a key indicator of consumer spending, increased by 0.2% in November, falling short of the 0.5% forecast. This underperformance and softer demand at clothing stores weighed on the British Pound (GBP). The BoE's decision to hold interest rates steady at 4.75% added pressure, with three of nine Monetary Policy Committee (MPC) members unexpectedly voting for a 25-basis-point rate cut. Markets had anticipated a more unified stance, further dampening sentiment for the GBP.
In contrast, the Japanese Yen (JPY) strengthened on robust inflation data. November's National Consumer Price Index (CPI) rose to 2.9% from 2.3% in October, while core CPI, excluding fresh food, climbed to 2.7%, exceeding expectations and prior figures. These results have fueled speculation of further rate hikes by the Bank of Japan (BoJ) in future meetings.
Technical Perspective
The price bounces back above the key level of 196.00 before reaching the low of September or August on the weekly chart. It reflects sufficient bullish pressure on the asset, leaving buyers optimistic.
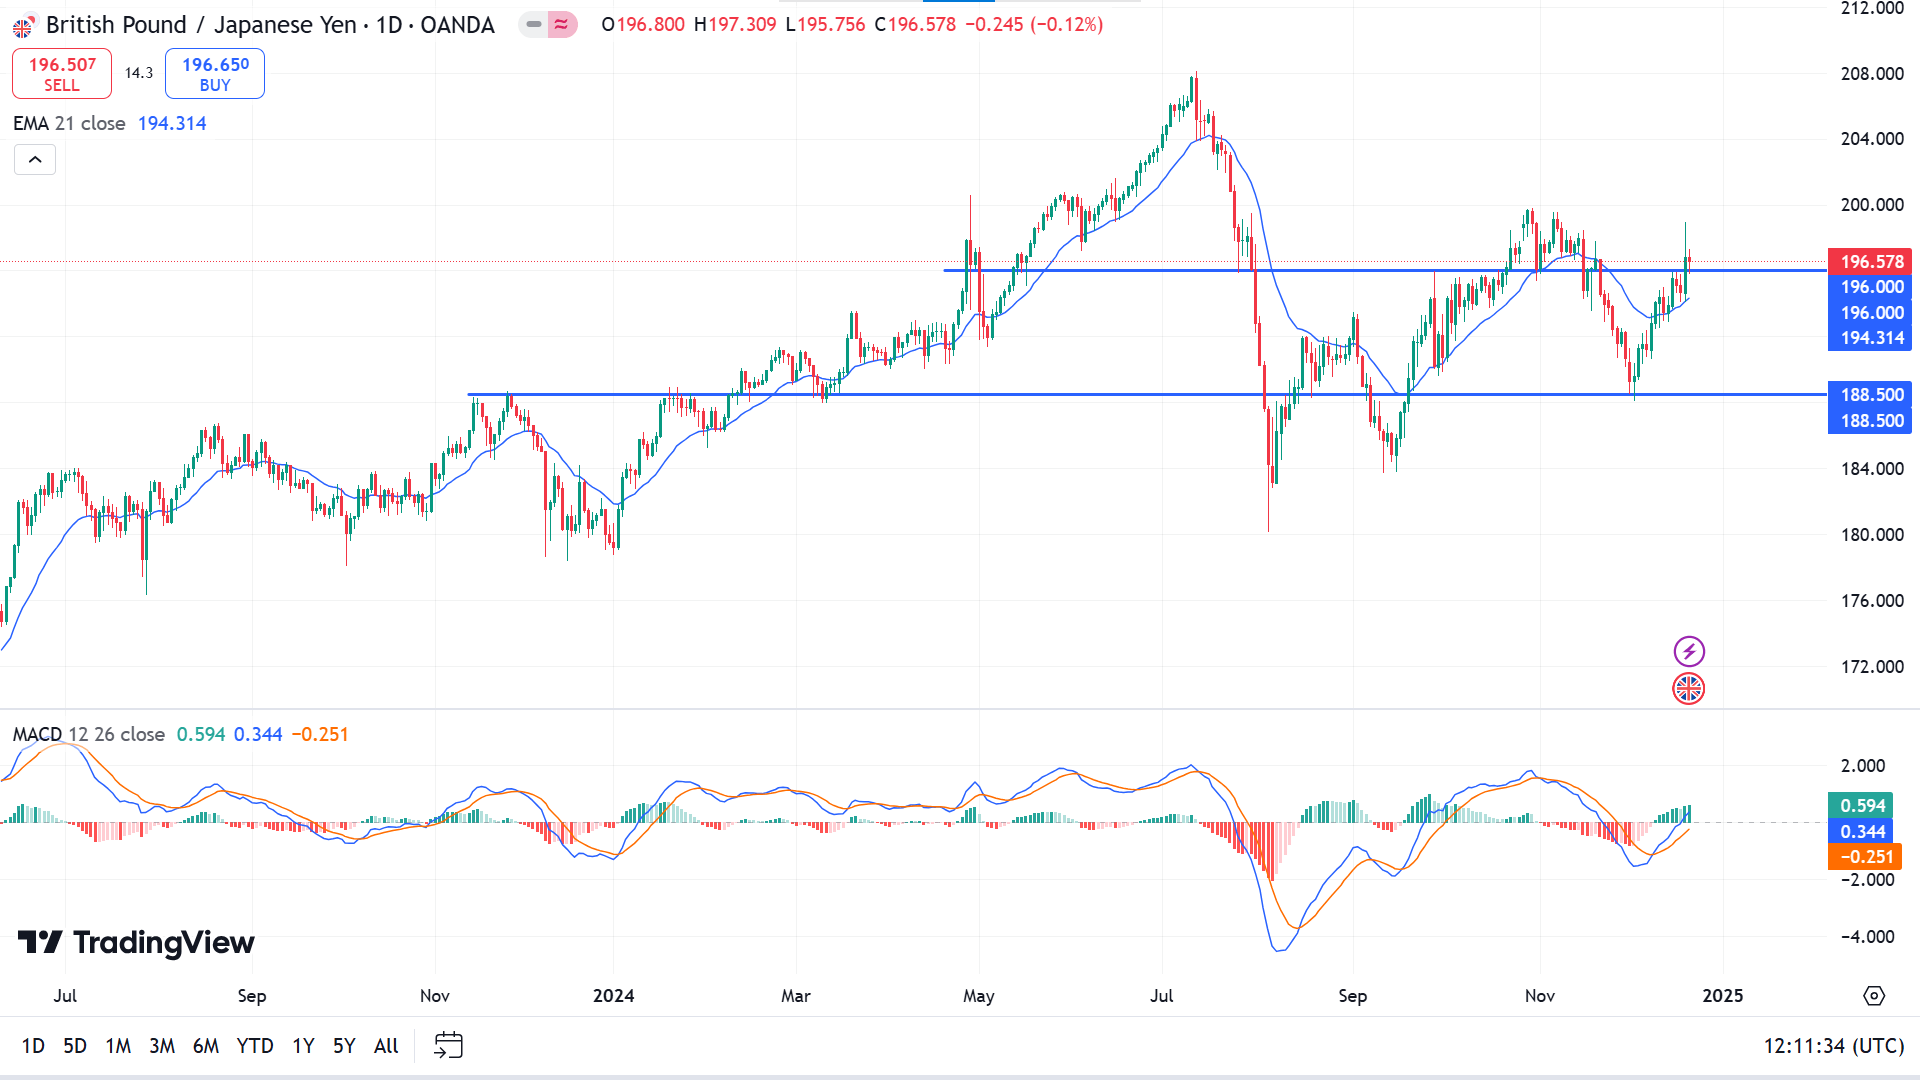
The price floats above the EMA 21 line on the daily chart, declaring an active bullish trend. The MACD reading supports the bullish trend through dynamic signal lines, creating a bullish crossover and edging upward, and green histogram bars appear above the midline of the indicator window.
According to the current scenario, traders observe the 196.00 level to open adequate long positions, which can turn the price toward the resistance near 200.20, following the next resistance near 208.12.
On the other hand, if the price declines below the support of 196.00, it would invalidate the bullish signal and possibly trigger selling opportunities toward the 188.50 support level.
Nasdaq 100 (NAS100)
Fundamental Perspective
US stock indexes closed higher on Friday as investors digested fresh economic data, including the Federal Reserve's preferred inflation gauge, which unexpectedly held steady in November.
The S&P 500 increased 1.1% to 5,930.9, the Dow Jones Industrial Average gained 1.2% to 42,840.3, and the Nasdaq Composite advanced 1% to 19,572.6. All sectors ended in positive territory, led by real estate. Despite Friday's rally, the S&P 500 lost 2%, the Dow declined 2.3% for the week, and the Nasdaq divided 1.8%.
The Bureau of Economic Analysis reported that consumer spending growth accelerated in November. Core inflation, which excludes food and energy, remained unchanged at 2.8% year-over-year and slowed to 0.1% month-over-month from 0.3%, falling short of forecasts for 2.9% and 0.2%, respectively.
BMO noted that while the Fed is likely to hold rates steady in January, a rate cut may come in March as inflation trends closer to target levels. Earlier last week, the Fed reduced interest rates by 25 basis points but signaled fewer cuts ahead than projected in September.
Meanwhile, December consumer sentiment rose to its highest level since April. However, according to the University of Michigan's Consumers survey report, year-ahead inflation expectations posted their first monthly increase in seven months.
Technical Perspective
The last red weekly candle erased gains of the previous two weeks but ended with wicks on both sides, reflecting consolidation and keeping buyers optimistic.
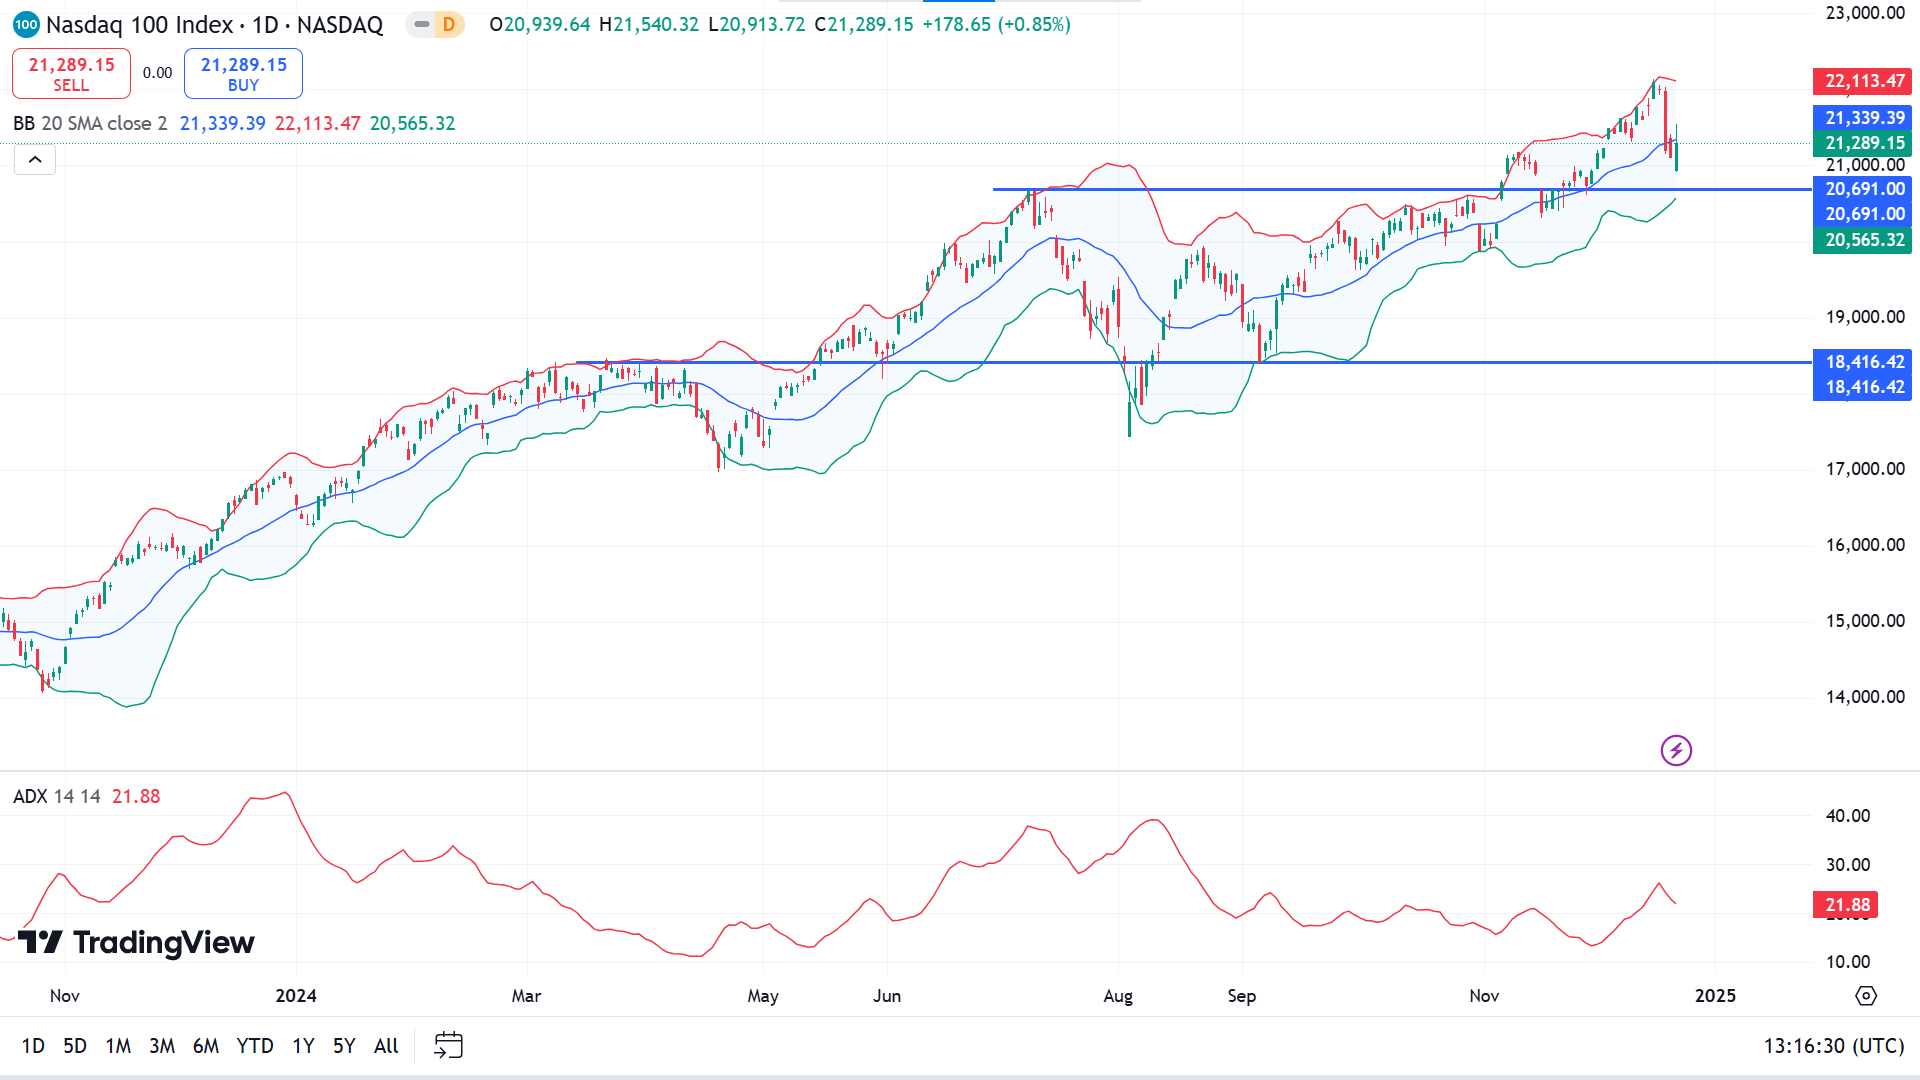
The price reaches below the middle band of the Bollinger Bands indicator, indicating recent bearish pressure on the asset. The ADX reading below 25 and edging lower, reflecting the current trend may be losing pressure, and a trend-changing environment is anticipated.
Based on the market context, adequate log positions can be open near the support of 20691.00, which can drive the price toward the ATH of 22,062.00 or beyond.
Meanwhile, if the price drops below the support of 20,691.00, it might disappoint buyers and spark short-term selling opportunities toward 19,883.88.
S&P 500 (SPX500)
Fundamental Perspective
US equity indexes fell last week as concerns over reduced Federal Reserve rate cuts in 2025 and the risk of a partial government shutdown overshadowed signs of easing inflation.
The S&P 500 dropped to 5,930.85 from 6,051.09 a week ago, while The Dow Jones Industrial Average ended at 42,840.26, down from 43,828.06, and the Nasdaq Composite fell to 19,572.60 from 19,926.72.
On Wednesday, the Federal Reserve lowered its forecast for 2025 rate cuts to two from four after reducing its target rate by 25 basis points. According to a Desjardins note, the Fed raised its 2025 inflation outlook and revised the neutral rate forecast higher.
A proposed bill to suspend the debt ceiling and temporarily fund the government failed Thursday, heightening shutdown concerns. On Friday, CNN reported that House Speaker Mike Johnson, who negotiated a prior bipartisan deal rejected by President-elect Donald Trump, expressed optimism about avoiding a shutdown but offered no concrete details. Scotiabank suggested a prolonged impasse or temporary funding arrangements might follow.
On a positive note, November's PCE index (Personal consumption expenditures) inflation data provided relief. Both headline and core PCE inflation slowed month over month and came in below expectations year over year, signaling easing price pressures.
Technical Perspective
The S&P 500 index declined near the ATH recently, and the last weekly candle closed solid red due to the recent bearish pressure but keeps buyers optimistic as the primary support remains intact.
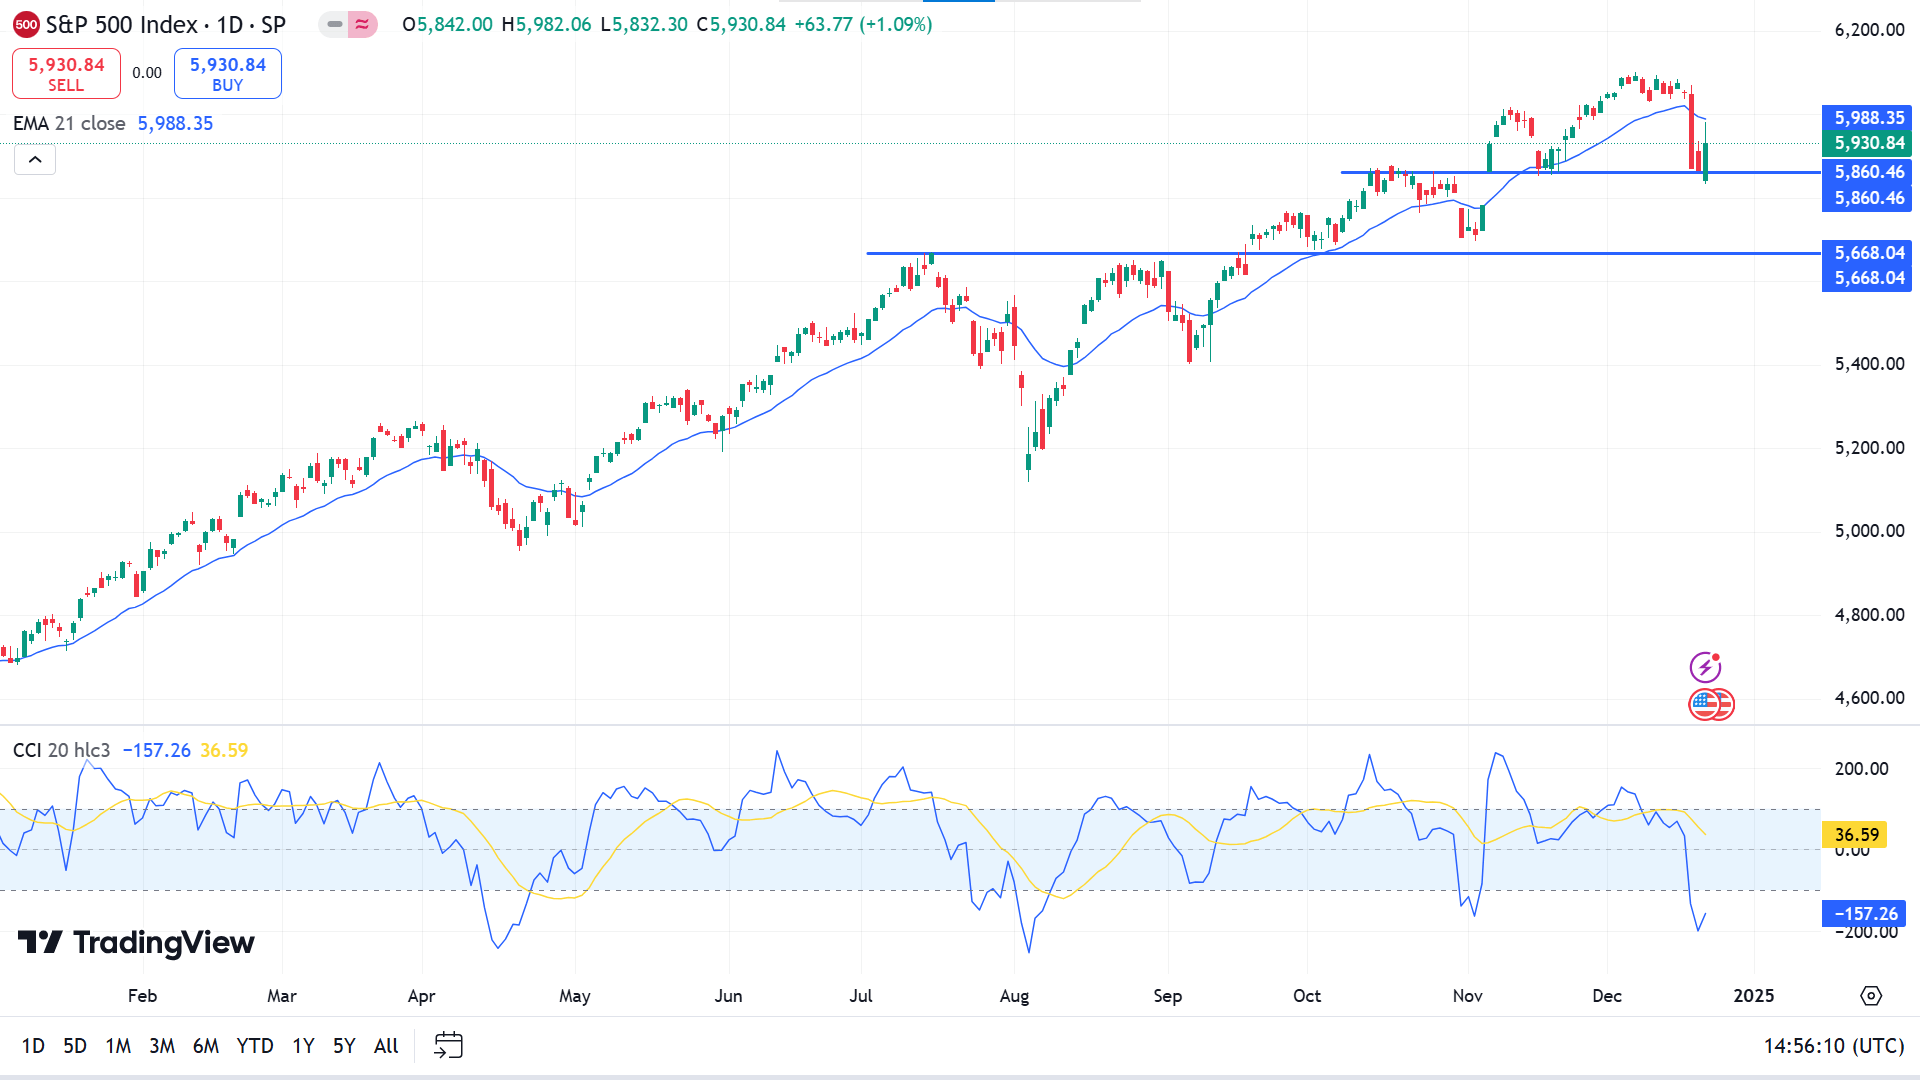
The price drops below EMA 21 due to recent bearish pressure on the daily chart, while the overall trend is still bullish. The CCI indicator window indicates a fresh bullish signal as the dynamic signal line edges upwards but moves below the lower line of the indicator window.
Based on the indicators' readings, buyers are active above the 5860.46 level, which might trigger the price to reach 6000.00 or above.
Meanwhile, any red daily candle closing below 5860.46 might invalidate the bullish signal besides sparking short-term selling opportunities toward the next support near 5668.04.
Gold (XAUUSD)
Fundamental Perspective
Gold (XAU/USD) traded sideways throughout the week, attempting to recover from sharp losses. Softer-than-expected US Personal Consumption Expenditures (PCE) data has weakened the US Dollar, offering limited support to the precious metal. However, gold remains near its one-month low.
November's PCE inflation rose by 0.1%, below the 0.2% forecast, while the annual rate increased to 2.4% from 2.3%, falling short of the anticipated 2.5%. Core PCE inflation also slowed, surging 0.1% month-over-month compared to October's 0.3%, with the annual rate unchanged at 2.8%, missing expectations of 2.9%.
Despite the softer inflation data, Thursday's upward revision to US third-quarter GDP and lower-than-expected jobless claims reinforced the Federal Reserve's hawkish outlook for 2025. These developments, alongside lingering headwinds for gold, have limited the metal's ability to extend its rebound meaningfully.
While the PCE report temporarily weighed on the US Dollar, the broader narrative of economic resilience continues to support the Fed's policy stance, keeping gold's recovery constrained.
Technical Perspective
XAUUSD is consolidating for the third week from 2720.00 to 2583.91, creating different hammer candlestick patterns. The scenario might leave investors cautious as the breakout of this range might hint at the direction of the next trend.
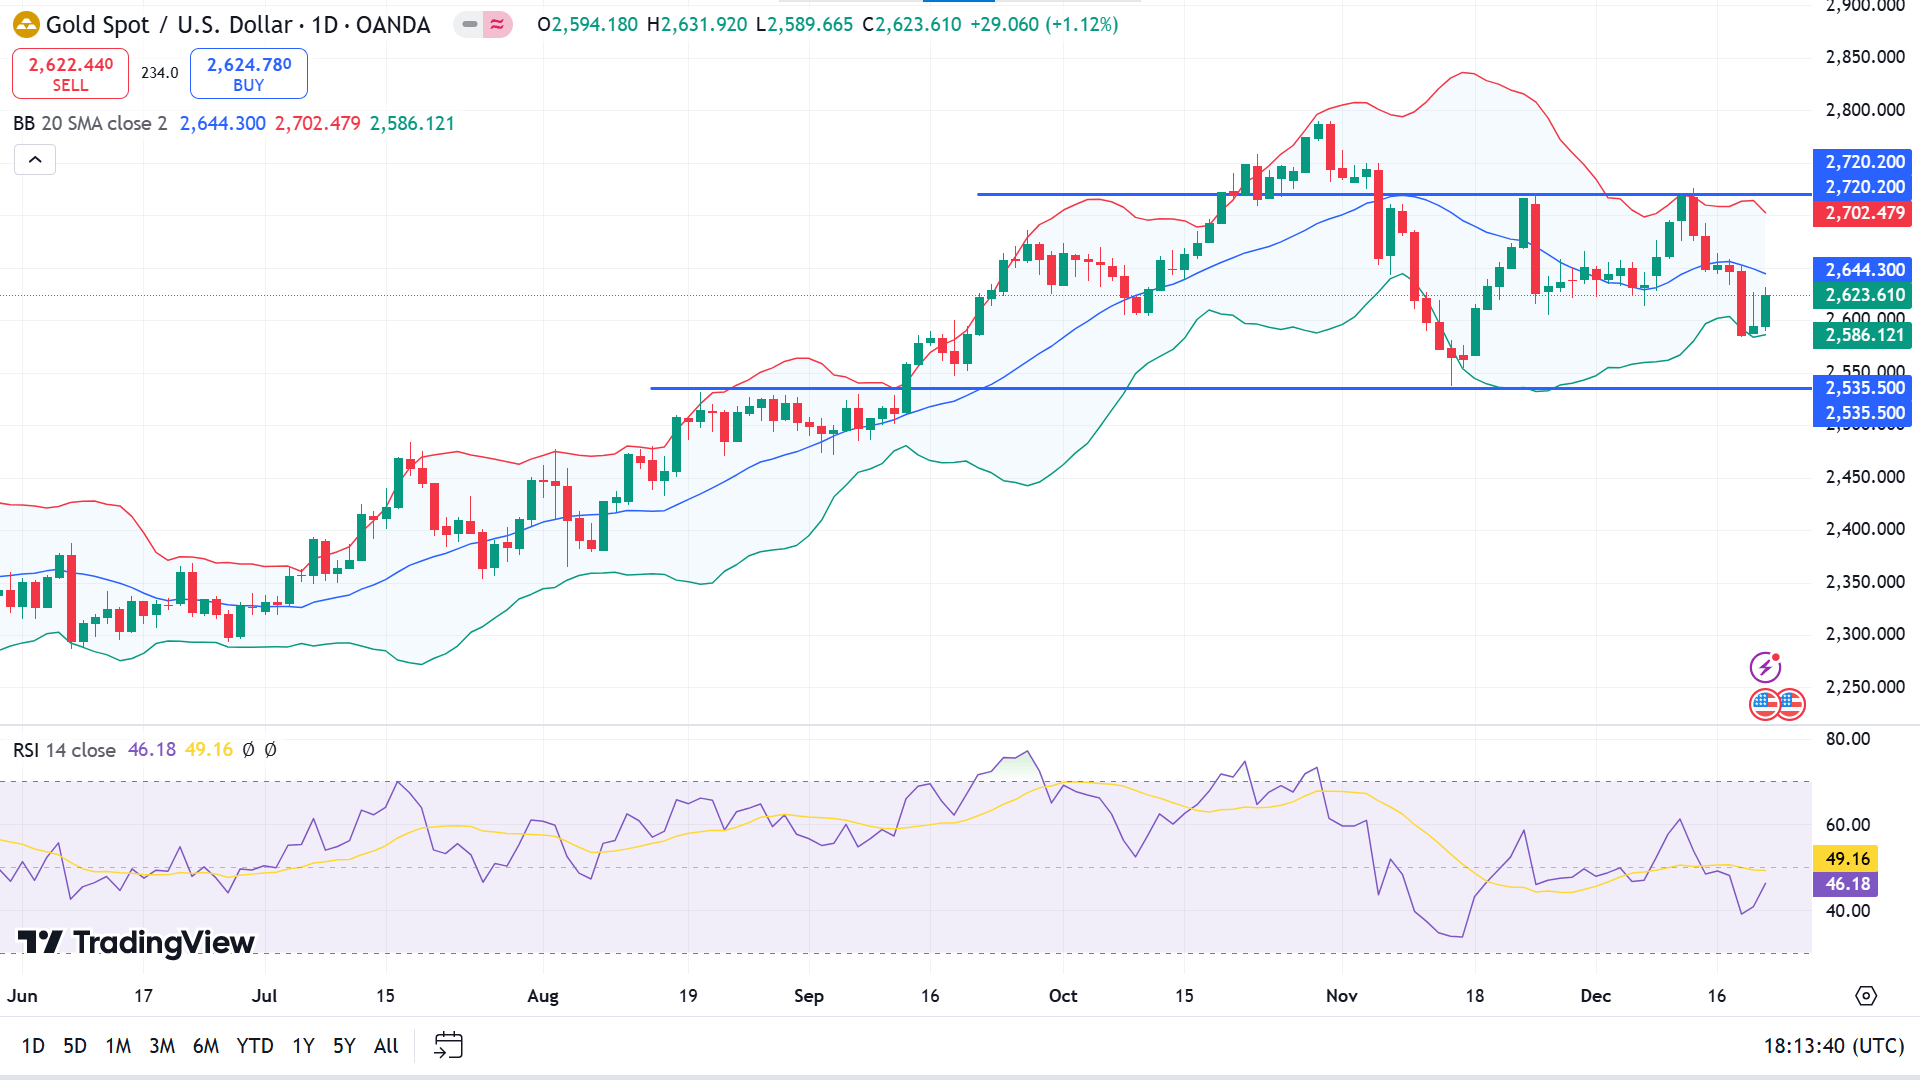
The price floats on the lower channel of the Bollinger bands indicator at the daily chart, highlighting recent bearish pressure on the asset price. At the same time, the RSI indicator reading remains neutral, with the dynamic signal line floating below the midline of the indicator window and edging upwards.
Based on the reading of the indicators, buyers might primarily observe the price reaction near 2535.50 to open adequate long positions, whereas sellers' eyes are on the range top of 2720.20.
Meanwhile, the bullish signal will be invalidated if the price declines below 2535.50; it may enable selling opportunities toward the next support near 2464.63.
Bitcoin (BTCUSD)
Fundamental Perspective
Bitcoin continued its decline on Friday, trading below $95,000 and on track for its worst weekly performance since late August. The Federal Reserve's hawkish stance fueled the pullback following Wednesday's rate-cut decision and a record $671.9 million outflow from Bitcoin US spot ETFs on Thursday. Technical indicators suggest the correction may extend toward $90,000.
After reaching an all-time high of $108,353 on Tuesday, Bitcoin lost over 8% by Thursday, struggling to regain momentum. Institutional interest also showed signs of fading. Spot ETF inflows reached $759.4 million over three consecutive days until Wednesday, only to be overshadowed by Thursday's record-breaking outflow, marking the largest since Bitcoin ETFs launched in January and breaking a streak of inflows since November 27.
The Federal Reserve's decision to lower its target rate to 4.25%-4.50% while signaling slower rate cuts in 2025 weighed heavily on risk assets like Bitcoin. The resulting correction led to over $1.68 billion in liquidations, including $371.51 million in BTC alone, per Coinglass data.
Adding to the negative sentiment, Fed Chair Jerome Powell reiterated that the Federal Reserve cannot and will not hold Bitcoin, reinforcing bearish pressure in the cryptocurrency market.
Technical Perspective
After many weeks of gaining candles, the last weekly candle ended solid red, reflecting a pause in the current uptrend, enabling short-term selling opportunities.
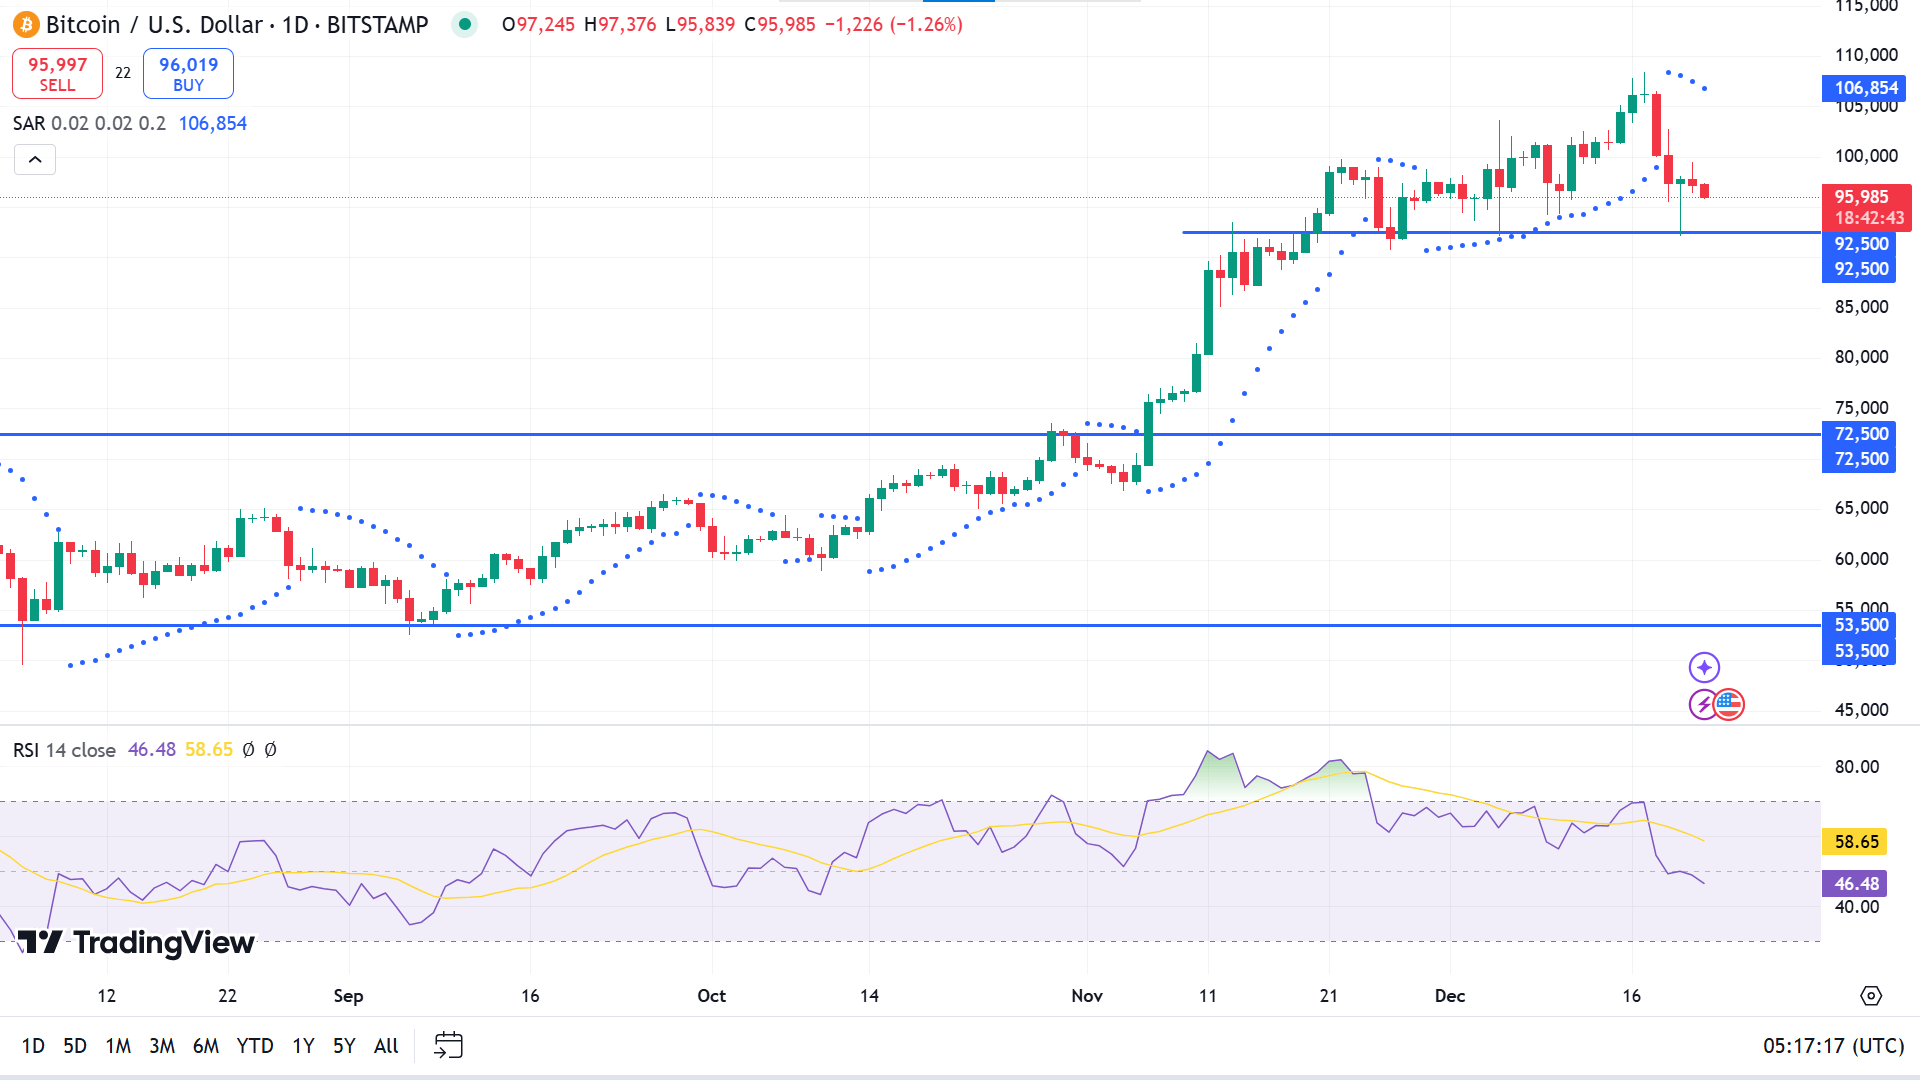
On the daily chart, parabolic SAR dots shifted upside of the price candles, declaring recent selling pressure on the asset price. The RSI indicator window supports the bearish force through the dynamic signal line reaching below the midline of the indicator window sloping downward.
The broader market context suggests that price action traders may observe 92,500 to open long positions as the level worked as a short-term sell barrier. The price can bounce above the 100,000 mark if the support is sustained.
Meanwhile, buyers would be disappointed if the price breaks below 92,500, which might enable short-term selling opportunities toward 81,632, invalidating the bullish signal.
Ethereum (ETHUSD)
Fundamental Perspective
Ethereum (ETH) showed signs of recovery on Wednesday as dip-buying returned to the market. After a 12% decline following the Federal Reserve's hawkish rate cut outlook for 2025, ETH has steadied around the $3,400 level.
The recent price stabilization can be linked to investors purchasing at lower levels, as reflected in declining exchange reserves, indicating a steady withdrawal of ETH from exchanges. This suggests a growing confidence among buyers opting for long-term holdings.
Despite this, selling pressure remains significant, especially from US investors. The Coinbase Premium Index, which compares ETH prices on Coinbase Pro and Binance, has dropped, signaling intense sell-side activity in the US market.
Similarly, Ethereum exchange-traded funds (ETFs) saw outflows of $60.5 million on Thursday, marking the first net outflows since November 21 and ending an 18-day streak of inflows, according to Coinglass data. This trend underscores ongoing selling pressure, particularly from US investors reacting to the Fed's policy stance.
Looking ahead, analyst Toledano anticipates price stabilization as the holiday season approaches, driven by reduced institutional trading activity during this period. Investors are likely to keep an eye on market dynamics heading into year-end.
Technical Perspective
A solid red candle after a hammer near adequate resistance on the weekly chart might signal a reversal.
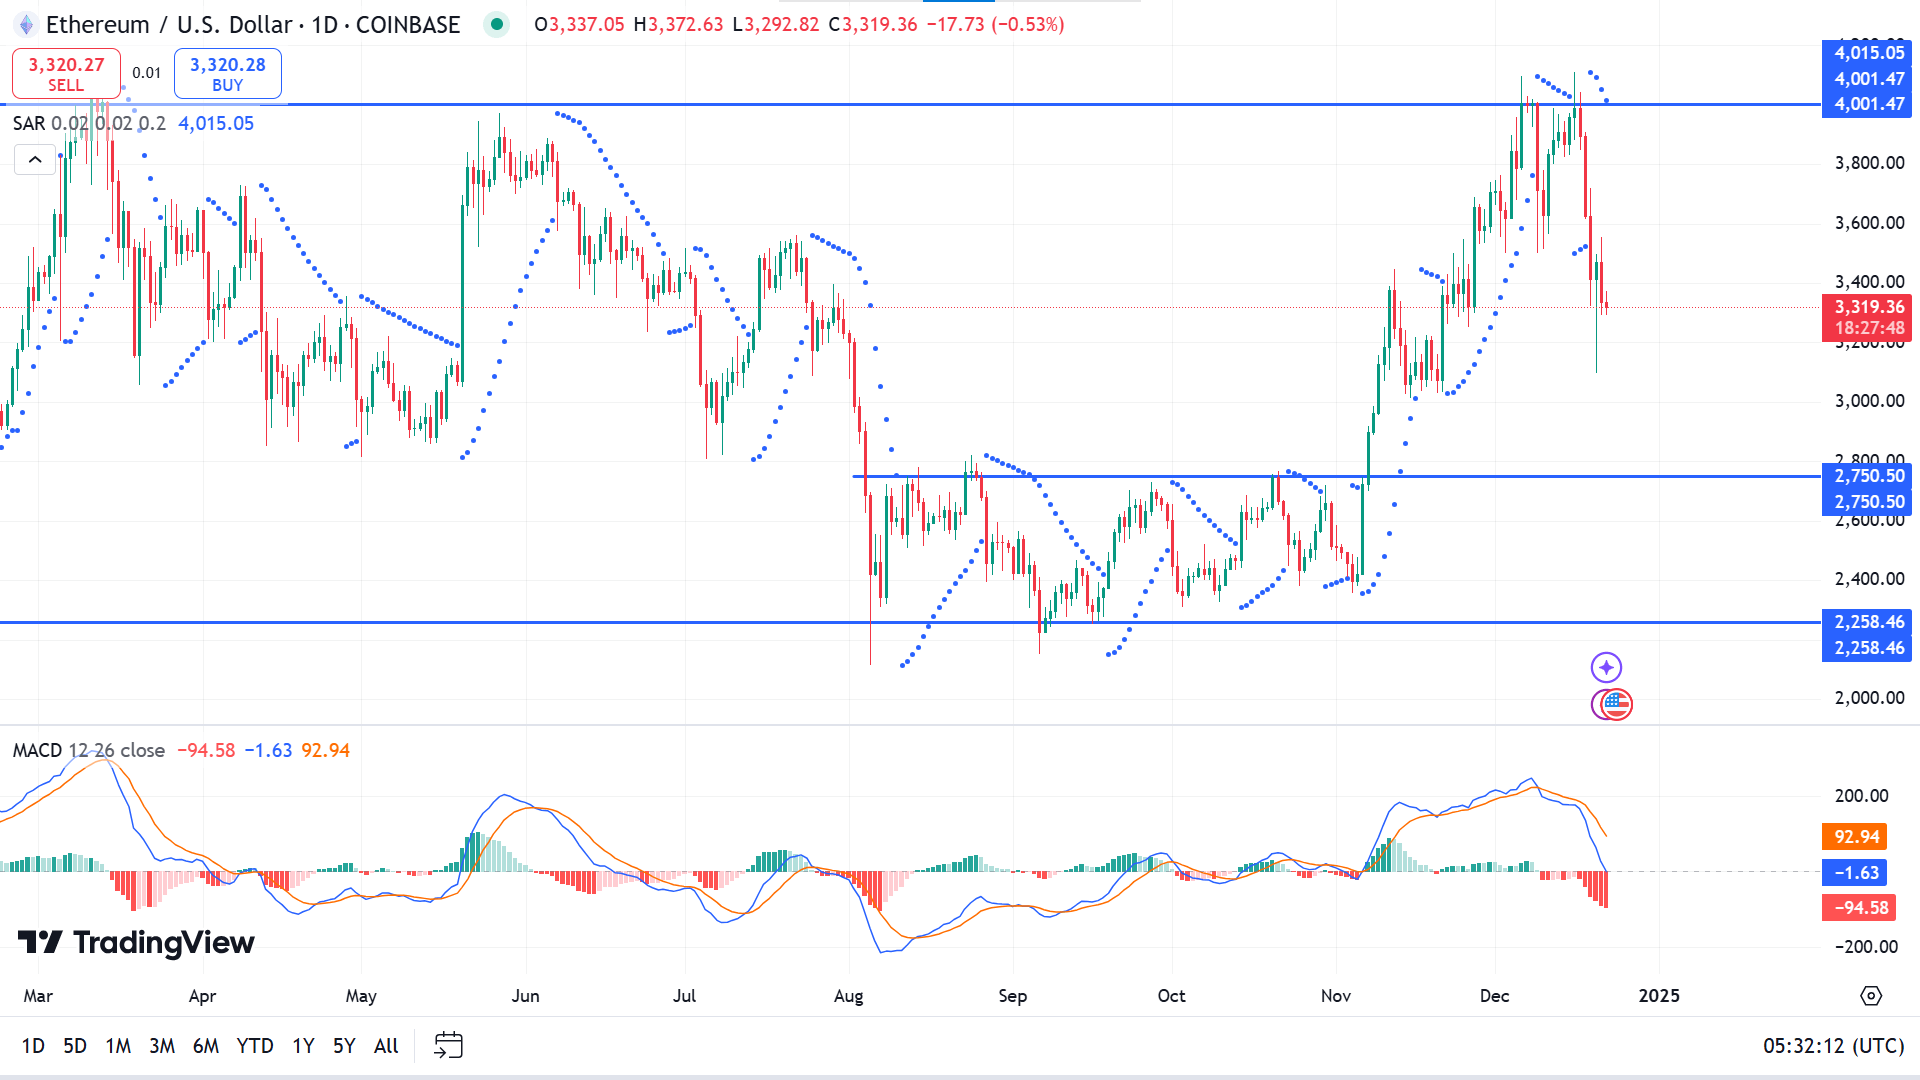
The parabolic SAR starts creating dots above the price candle, declaring a recent opposing force on the asset price. The MACD indicator window supports the bearish force on the asset price through dynamic signal lines, creating a bearish crossover, sloping downward, and red histogram bars appearing below the midline.
According to the price action concepts, the price might reach near 3000.00 to accumulate bullish pressure that would trigger the price toward the resistance near 4001.47.
Meanwhile, if the price declines below 3000.00, it would enable selling opportunities toward the range of 2750.50-2258.46.
Tesla Stock (TSLA)
Fundamental Perspective
Elon Musk's net worth plunged by $42 billion last week as Tesla shares retreated, erasing much of the momentum from their post-election surge. After reaching a record closing high of $479.87 per share on Tuesday, which valued the company at $1.5 trillion, Tesla's stock dropped to $421.06 by Friday, eliminating $200 billion in market value. The sharp decline exposed the fragility of recent gains, triggered partly by Federal Reserve Chair Jerome Powell's remarks that unsettled markets midweek.
On Wednesday, the Federal Reserve announced an interest rate cut. Still, it signaled a slower pace of reductions, revising next year's projections to just two cuts from the previously expected four. This shift posed a challenge for Tesla, as rising borrowing costs could hinder sales, given that many customers finance their electric vehicle purchases through loans.
Musk, whose fortune had soared by $180 billion following Donald Trump's presidential election victory, saw his personal wealth shrink to $444 billion from $486 billion. The billionaire, now closely associated with the incoming administration, faced a swift reversal of fortunes in a week dominated by market recalibration.
Technical Perspective
The last weekly candle closed as an inverted hammer with a red body and a long upper wick, which could be a trend reversal pattern, leaving investors cautious.
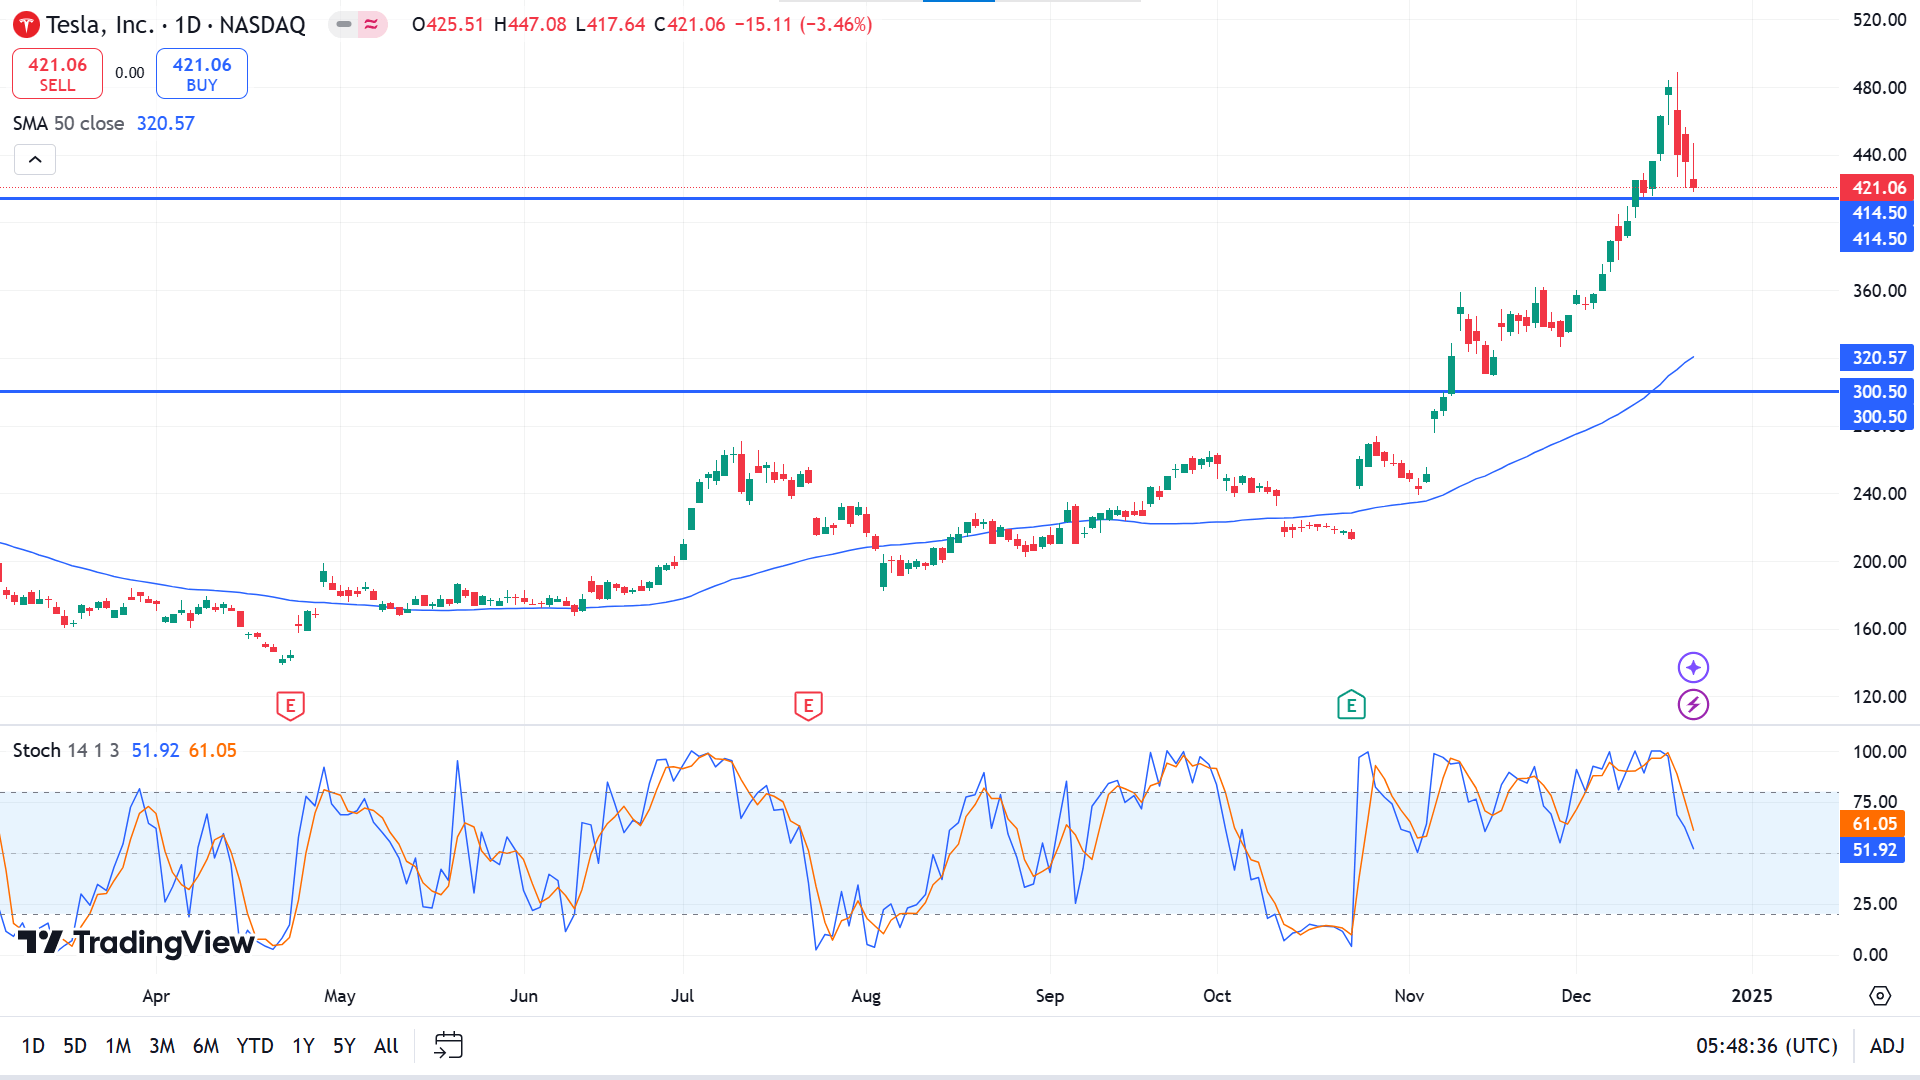
The price remains above the SMA 50 line on the daily chart, indicating a bullish trend. The stochastic indicator window shows recent bearish pressure through dynamic signal lines, creating a bearish crossover and sloping below the upper line of the indicator window.
According to the current scenario, buyers are still optimistic until the price remains above 414.50, which will validate the breakout and may turn the price toward 488.54 or beyond.
However, if the price keeps declining below 414.50, it might invalidate the bullish signal and spark short-term selling opportunities toward the primary support near 358.60.
Nvidia Stock (NVDA)
Fundamental Perspective
Morgan Stanley issued a positive outlook on AI chipmakers Friday, naming Nvidia (NVDA) as its top stock pick for 2025. The firm also boosted price targets for AI chip stocks Astera Labs (ALAB), Broadcom (AVGO), and Marvell Technology (MRVL), maintaining buy ratings on all three. While it kept its overweight ratings on Nvidia and Advanced Micro Devices (AMD), the firm slightly reduced price targets for both.
Nvidia and AMD are known for their GPUs tailored for AI applications in data centers, while Broadcom and Marvell focus on custom AI chips for cloud providers. Astera Labs specializes in high-speed connectivity solutions for AI-driven data centers. Analyst Joseph Moore acknowledged recent caution surrounding Nvidia, attributing it to concerns about reduced demand for current Hopper GPUs and potential delays or supply challenges with the upcoming Blackwell series. Additionally, GPUs face growing competition from application-specific integrated circuits (ASICs) developed by Broadcom and Marvell.
Moore argued that many worries are overstated or likely to diminish over time. He highlighted Nvidia CEO Jensen Huang's keynote at CES on January 6 as a potential catalyst for the stock. Morgan Stanley revised Nvidia's price target to 166 from 168 and AMD's to 158 from 169 while increasing targets for Broadcom to 265, Astera Labs to 142, and Marvell to 120. Friday trading saw modest gains, with Broadcom closing at 220.79, Astera Labs finishing at 132.17, AMD at 119.21, and Marvell at 111.90.
Technical Perspective
The last weekly candle confirms a breakout above the previous peak through the last green doji candle on the weekly chart, leaving buyers optimistic.
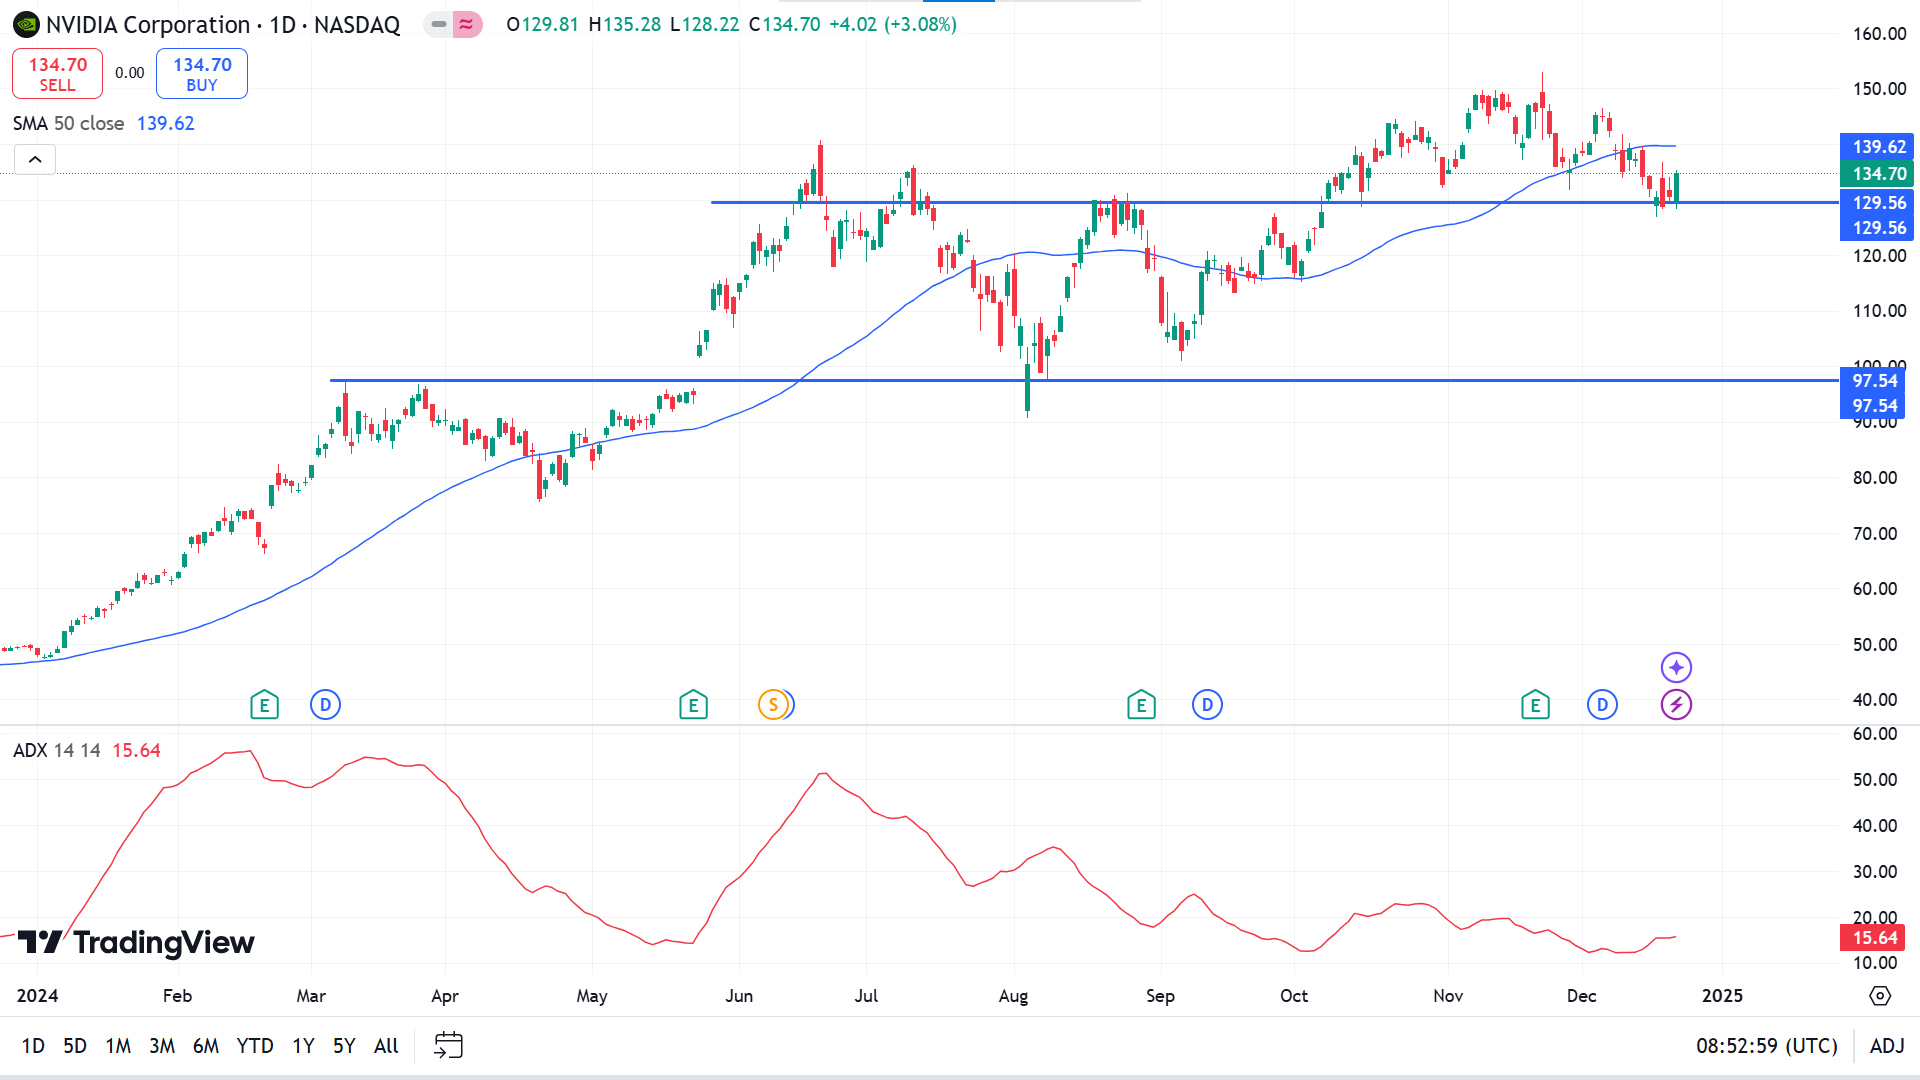
The price reaches below the SMA 50 line due to recent bearish pressure on the asset on the daily chart, validating the support line. In contrast, the ADX reading reaches below 20, suggesting that the current trend is losing power and that an opposite force is anticipated.
Based on the broader market contexts, price action traders 129.56 have consistently the possibility to reach the ATH near 152.89 or beyond.
In contrast, a daily red candle close below 129.56 would invalidate the bullish signal and might trigger short-term sellers toward the primary support near 114.70.
WTI Crude Oil (USOUSD)
Fundamental Perspective
Crude oil prices are set to end the week with a 2% loss amid subdued trading and growing investor unease. Market sentiment worsened overnight as concerns deepened over the Federal Reserve's hawkish stance, which could offset potential economic gains under the Trump administration. President-elect Donald Trump added pressure by warning Europe to increase its U.S. oil and gas purchases to address trade imbalances or face tariffs.
The U.S. Dollar Index (DXY) surged to a two-year high during Friday's Asian trading, driven by rising Treasury yields as the Fed's policies widened the gap between U.S. and global interest rates. A stronger dollar could gain momentum if U.S. Personal Consumption Expenditures (PCE) data, due Friday, surpass expectations, potentially removing projections for two interest rate cuts in 2025.
In global energy developments, China's Sinopec reported that domestic gasoline demand peaked last year, dimming the outlook for the world's largest crude importer. Meanwhile, the Group of Seven nations is deliberating stricter sanctions on Russian oil, potentially lowering the price cap to $40 per barrel. The weekly Baker Hughes U.S. oil rig count, set for release at 18:00 GMT, remains near annual lows, far from the peak of 888 rigs during Trump's earlier presidency. U.S. government oil inventory data will be delayed this week to December 26 due to the Christmas holiday.
Technical Perspective
Since mid-October, Crude Oil Has remained within a range between 72.50 and 66.76. The last red candle on the weekly chart after a solid green candle leaves buyers optimistic.
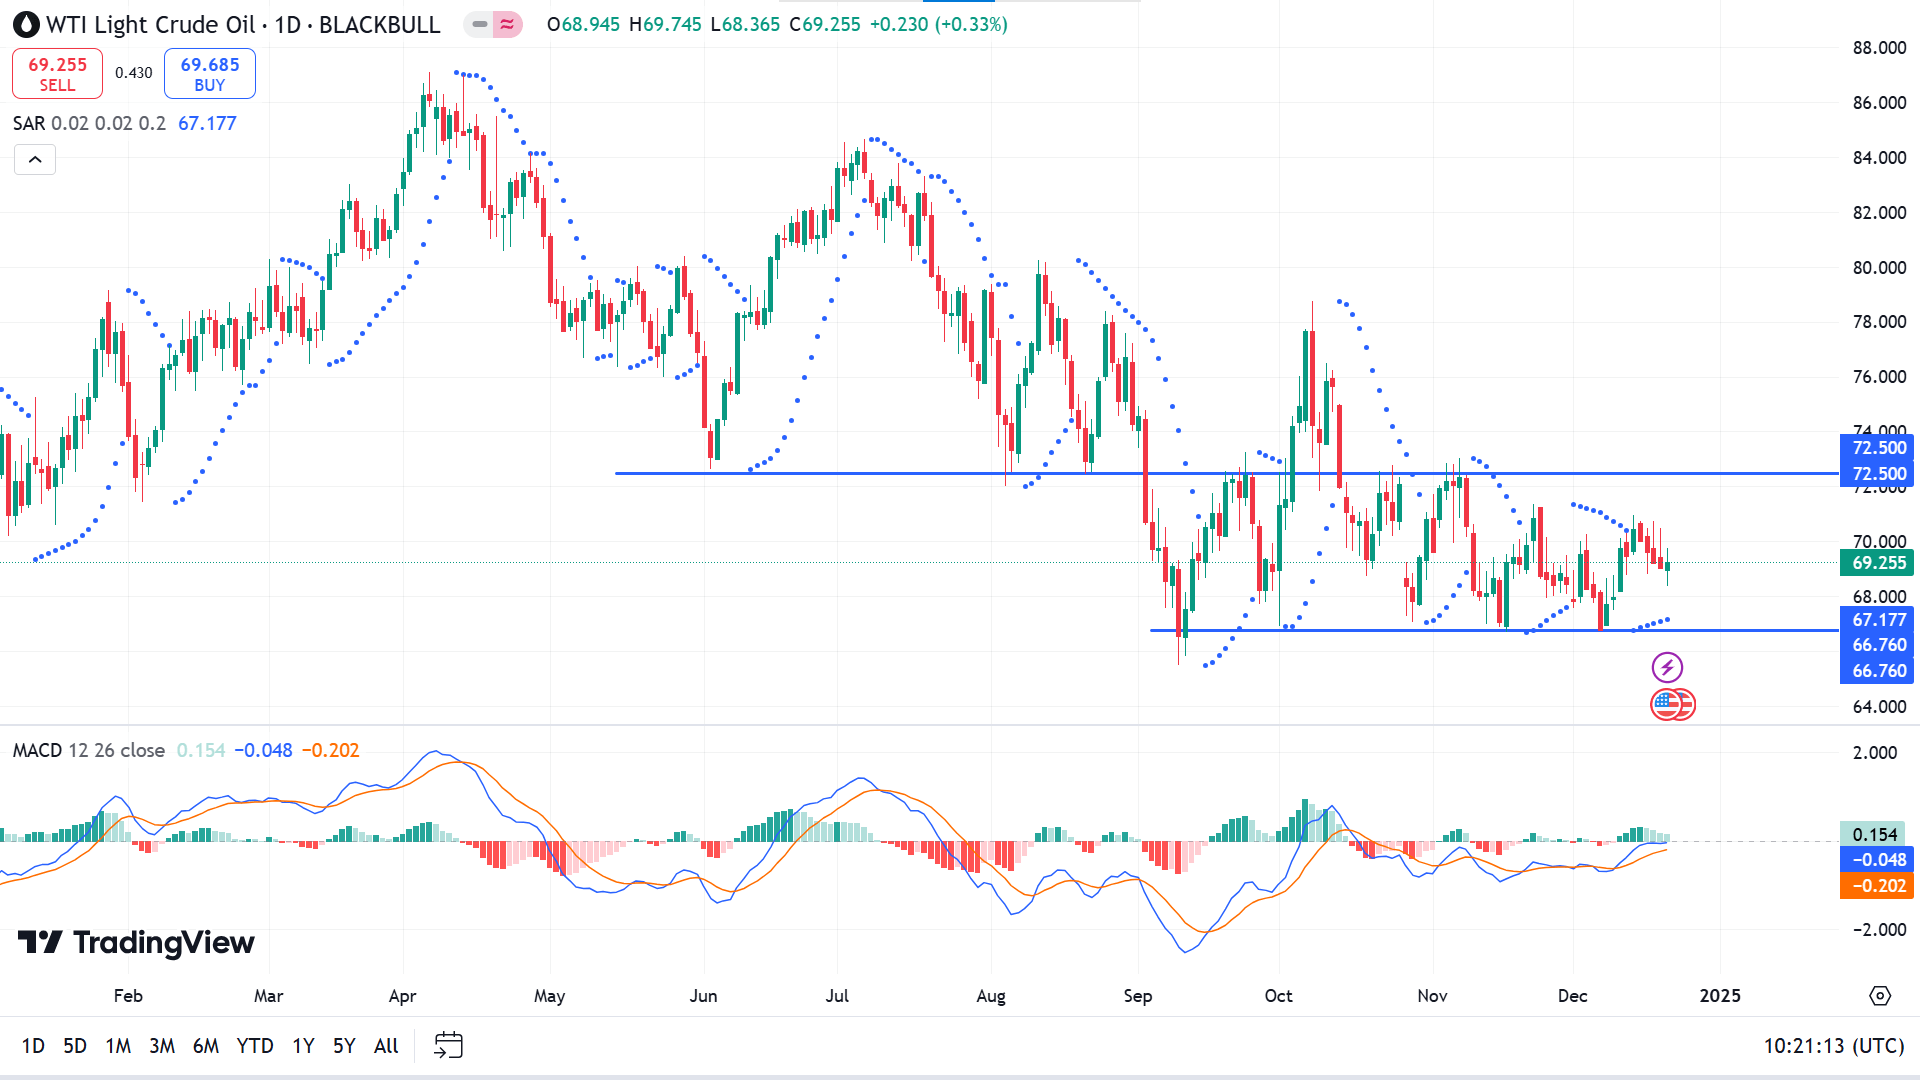
The parabolic SAR indicator creates dots below the price candles on the daily chart, indicating recent bullish pressure on the asset price. The MACD indicator window supports the buoyant force on the asset price through dynamic signal lines sloping upwards, and green histogram bars appear above the midline of the indicator window.
According to the current scenario, buyers are optimistic at near 66.67, while sellers primarily keep their eyes on 72.50, as the price has been consolidating over two months.
The price beyond the range might signal future price movements. The bullish signal would be invalidated if the price declines below the 66.67 level, triggering selling interest. Meanwhile, a successful breakout above the primary resistance of 72.50 would invalidate the bearish signal and draw buyers' attention toward the next resistance near 78.50.


